Validating NSS fq_codel's correctness

I am starting up a subproject to go and validate that fq_codel is implemented correctly, in the nss drivers, as well as attempting to take it apart as for the interactions with other subsystems in the kernel, such as GRO, device drivers, and the wifi implementation. Along the way I hope to have a few teaching moments as to how to use flent, understanding network behaviors at various RTTs, etc.

There's so much hardware using this algo now that I hope to rein in some support for each test from the community here.

@kong is testing the nss offloads here.

flent --step-size=.05 --socket-stats --te=upload_streams=4 tcp_nup -H [netperf-eu.bufferbloat.net](http://netperf-eu.bufferbloat.net/)
flent --step-size=.05 --socket-stats --te=download_streams=4 tcp_ndown -H [netperf-eu.bufferbloat.net](http://netperf-eu.bufferbloat.net/)

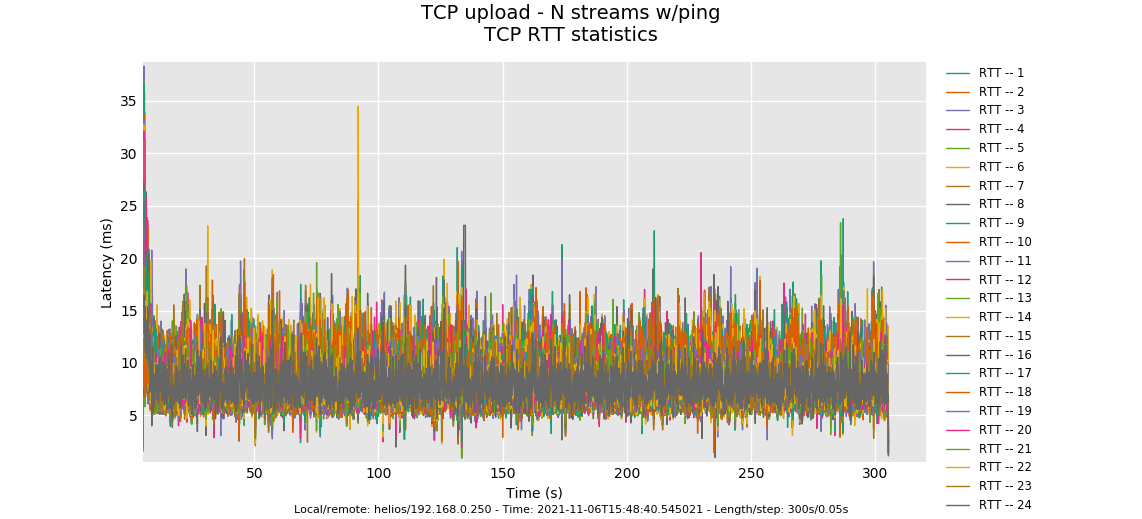
ISP speed is ~100Mbps/35Mbps. I have configured 95000 down and 30000 up.

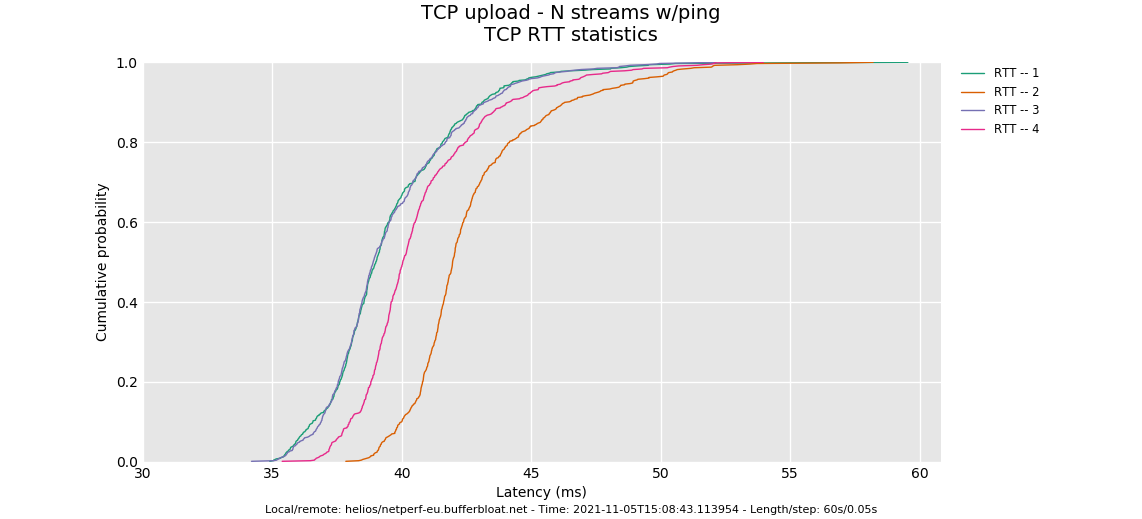
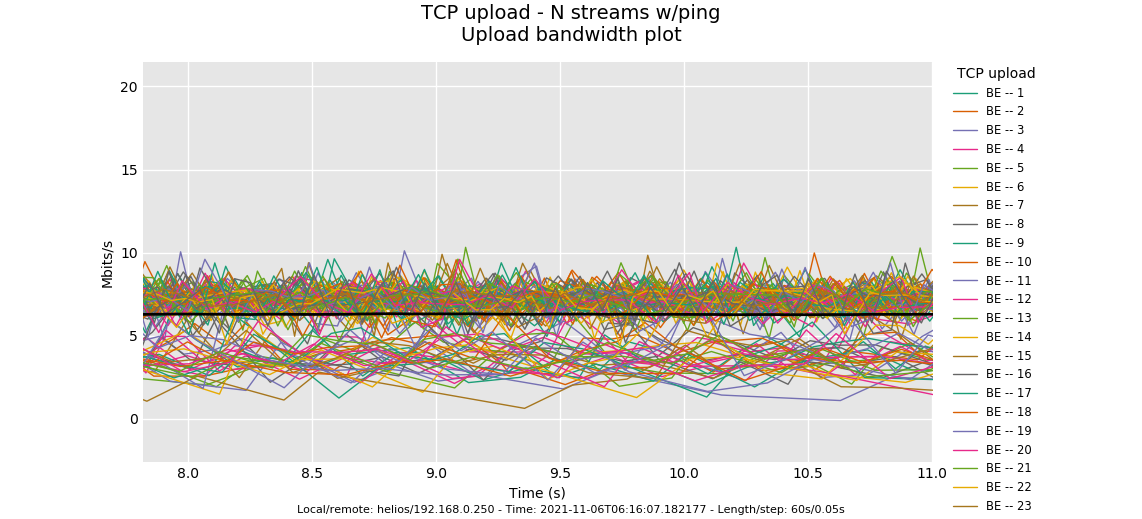
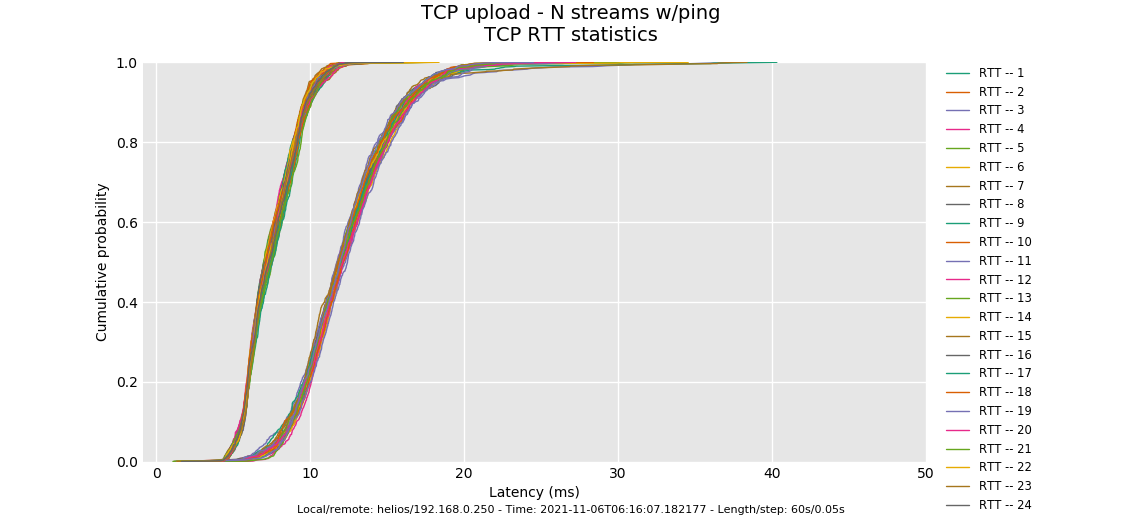
--socket-stats only works on the up. Both the up and down look ok, however the distribution of tcp RTT looks a bit off. These lines should be pretty identical.

Three possible causes: 1) your overlarge burst parameter. At 35Mbit you shouldn't need more than 8k!! The last flow has started up late and doesn't quite get back into fairness with the others. 2) They aren't using a DRR++ scheduler, but DRR. 3) Unknown. I always leave a spot in there for the unknown and without a 35ms rtt path to compare this against I just go and ask you for more data

No need for more down tests at the moment.

A) try 8 and 16 streams on the up.
B) try a vastly reduced htb burst.

A packet capture of a simple 1 stream test also helps me on both up and down, if you are in a position to take one. I don't need a long one (use -l 20) and tcpdump -i the_interface -s 128 -w whatever.cap on either the server or client will suffice.

I am temporarily relieved, it's just that the drop scheduler in the paper was too agressive above 100mbit... and we haven't tested that on this hardware....

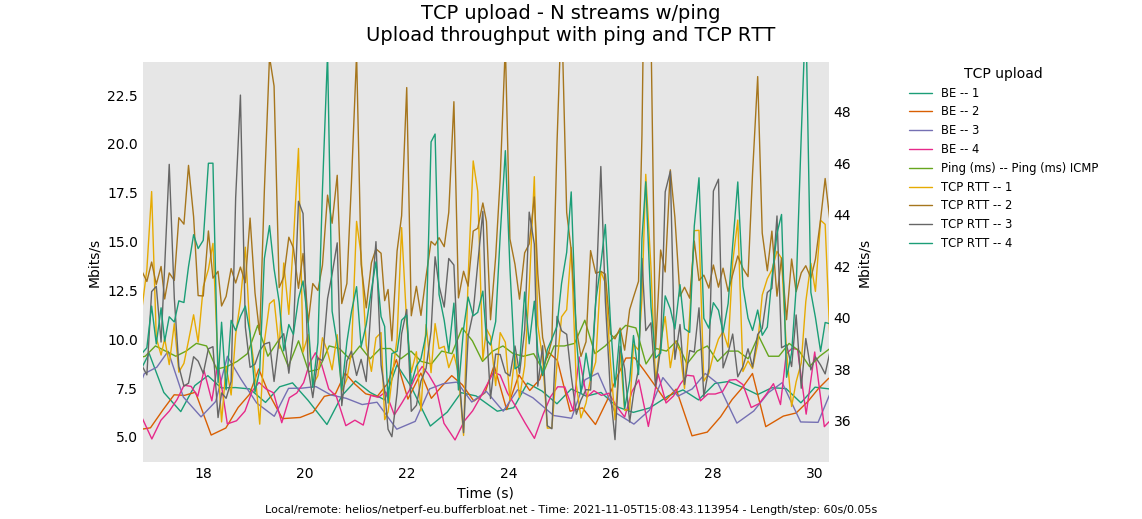
Anyway this more clearly shows two of the flows are "stuck":

The 100mbit download is just perfect - no synchronization, perfect throughput, 5ms of latency.

1 Like

OK, I updated my nss.qos script:

and here is a new flent test:

http://desipro.de/openwrt/flent/tcp_nup-2021-11-06T010707.353152.flent.gz

TCP RTT statistics now look better

Before I updated my nss.qos script (click on the links to see the detailed bufferbloat results):

after the update:

P.S. Looks like here was some hickup on the download test at the first run, but on the download side the improvement can be seen between the two runs.

1 Like

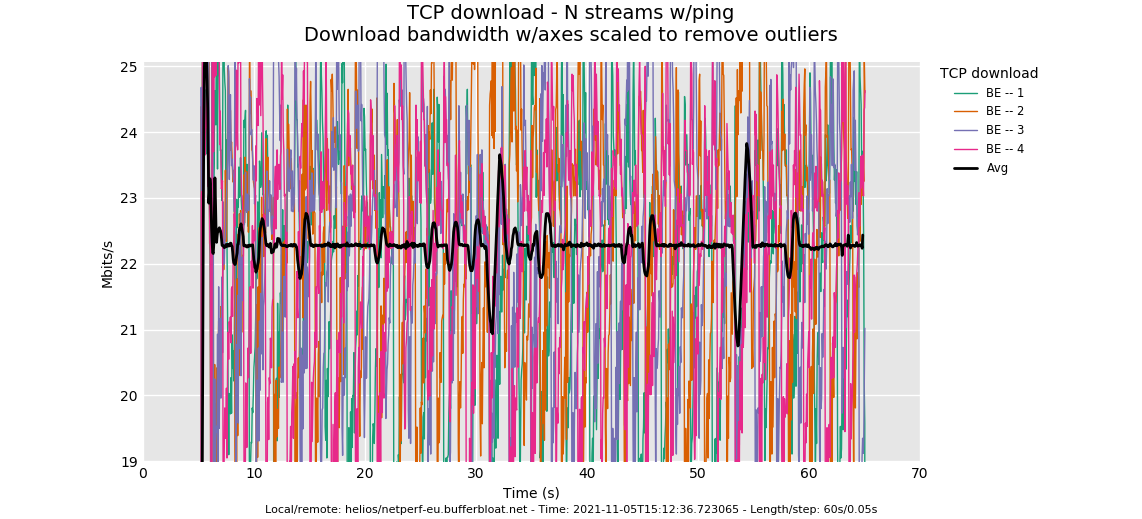
I ran another test. This time I set up netserver on wan side. Set up/download for my nss.qos to 500000 and tested using: flent --step-size=.05 --socket-stats --te=upload_streams=4 tcp_nup -H 192.168.1
.250

http://desipro.de/openwrt/flent/tcp_nup-2021-11-06T014707.853670.flent.gz

On the router only a 3% load.

Besides that I just uploaded builds, that include the updated nss.qos script.

Please: Hit it with 128 flows at that speed. We should see some hash collisions, which is ok, and from those we can infer how many flows they really have.

THEN the all seeing all knowing rrul test.

I'm very impressed that it only eats 3% of cpu at this speed. I'd be even more impressed if it operated correctly. :slight_smile:

Try 900Mbit, 128 flows?

Here is a new one with upload_streams=128:

http://www.desipro.de/openwrt/flent/tcp_nup-2021-11-06T141607.182177.flent.gz

The estimated completion time is a little off, at first I thought flent just got stuck :rofl:

I set 900000 up/down in qos settings:

tc -s qdisc | grep burst
qdisc nsstbl 1: dev eth0 root refcnt 2 buffer/maxburst 112500b rate 900Mbit mtu 1514b accel_mode 0
qdisc nsstbl 1: dev nssifb root refcnt 2 buffer/maxburst 112500b rate 900Mbit mtu 1514b accel_mode 0

Still pretty much no load on the router. The box where netserver runs is only a tiny Celeron(Intel(R) Celeron(R) N4100 CPU @ 1.10GHz) hopefully it is fast enough to not cause any issues in the runs.

any chance you can try ipv6?

Unfortunately I do not use ipv6 at all, it is disabled in all of my devices:-)

Is ipv6 working on the nss elsewhere?

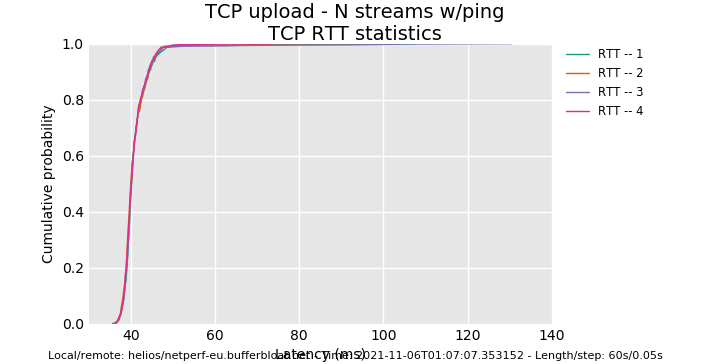
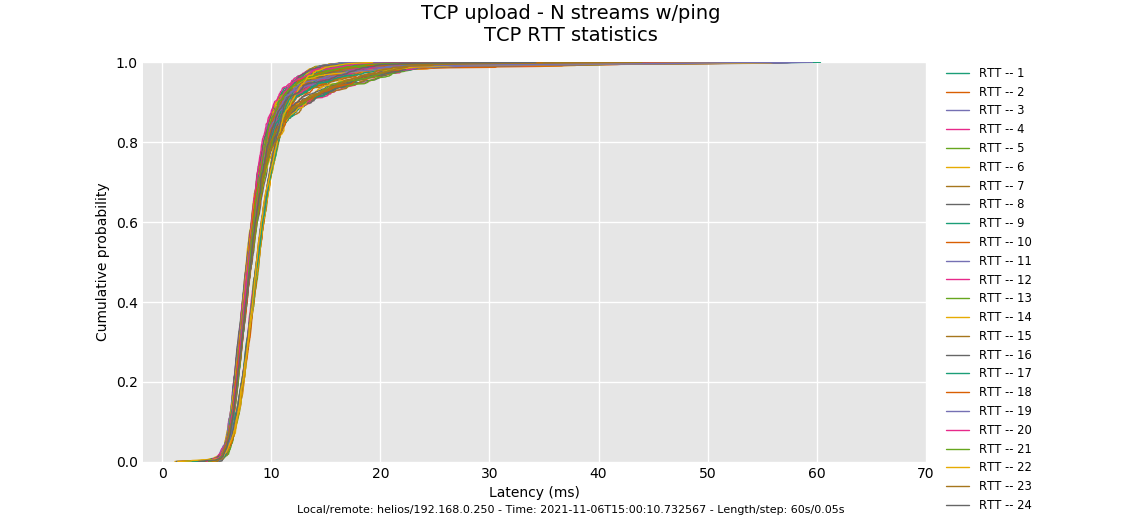
OK, that's puzzling. The odds were good that we'd see a third tier hash collission here, and we don't, and the bimodal distribution is odd... way too many flows in this other tier to be a birthday paradox at flows 1024.

And that's And codel, should have controlled all the RTTs here despite the collision - throughput should have been different but observed latencies eventually the same.

Do you know what the default is for the flows parameter? To see if this distribution moves around any try flows 16.

You can also try knocking the burst parameter down to about 32k. The autoscaling stuff we did there was designed for a software implementation of htb.

#include "nss_qdisc.h"
#include "nss_codel.h"

/*

  • Default number of flow queues used (in fq_codel) if user doesn't specify a value.
    */
    #define NSS_CODEL_DEFAULT_FQ_COUNT 1024

That's not what the data shows.

But tc also displays 1024

tc -s qdisc | grep flows
qdisc nssfq_codel 10: dev eth0 parent 1: target 5ms limit 4096p interval 100ms flows 1024 quantum 1514 set_default accel_mode 0 
 new_flows_len 0 old_flows_len 1
qdisc fq_codel 0: dev eth1 root refcnt 2 limit 10240p flows 1024 quantum 1514 target 5ms interval 100ms memory_limit 4Mb ecn drop_batch 64 
  new_flows_len 0 old_flows_len 0
qdisc nssfq_codel 10: dev nssifb parent 1: target 5ms limit 4096p interval 100ms flows 1024 quantum 1514 set_default accel_mode 0 
 new_flows_len 0 old_flows_len 0

Doesn't mean that underneath there isn't some flaw or limitation in the engine. Pass down 16 and see what happens?

OK flows at 16:

tc -s qdisc | grep flows
qdisc nssfq_codel 10: dev eth0 parent 1: target 5ms limit 4096p interval 100ms flows 16 quantum 1514 set_default accel_mode 0 
 new_flows_len 0 old_flows_len 1
qdisc fq_codel 0: dev eth1 root refcnt 2 limit 10240p flows 1024 quantum 1514 target 5ms interval 100ms memory_limit 4Mb ecn drop_batch 64 
  new_flows_len 0 old_flows_len 0
qdisc nssfq_codel 10: dev nssifb parent 1: target 5ms limit 4096p interval 100ms flows 16 quantum 1514 set_default accel_mode 0 
 new_flows_len 0 old_flows_len 0

And here is the result with upload_streams=128 tcp_nup:

http://www.desipro.de/openwrt/flent/tcp_nup-2021-11-06T230010.732567.flent.gz

ok! A) It looks to me that the hardware offload has issues with hashing lots of flows.

And... now we have a codelly result, with all latencies held to +5ms:

AND, a possibly smoking gun. That spike at T+40.

Can you re-run for -l 300 - if that repeats a few times we're on our way...

Holy cow, this took a while and consumed 50GB of RAM.

http://www.desipro.de/openwrt/flent/tcp_nup-2021-11-06T234840.545021.flent.gz

For SCIENCE!

2 Likes

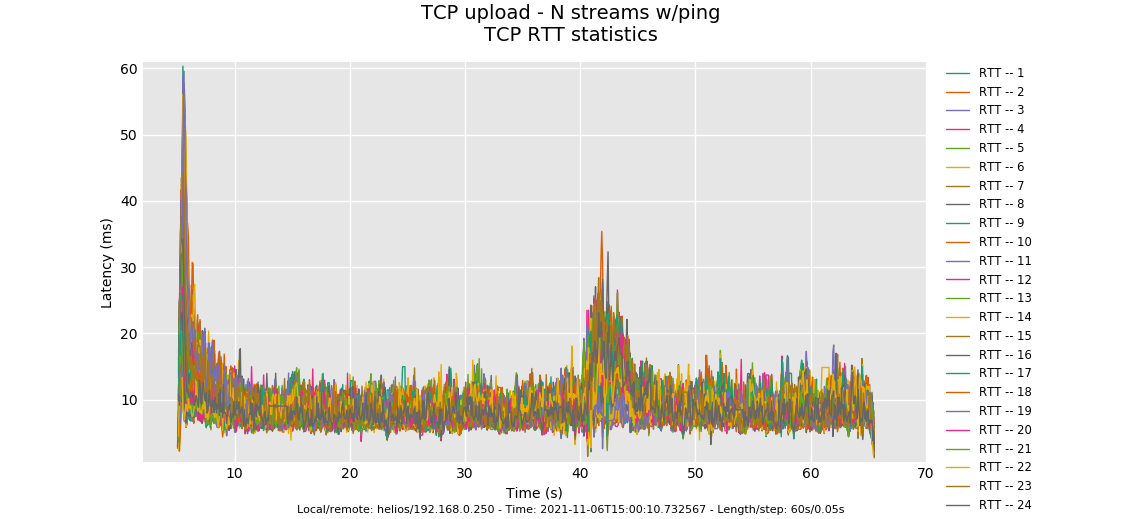
This one doesn't have that spike. Dang it. 50GB of memory used up for a good cause tho. Doing more than one plot OOMed my laptop also. Don't need to do -l 300 again for a while...

This is a pretty normal looking result. I note I am not recommending 16 flows to your end-users, it was just seeing if codel was correct.

OK, in looking at this and the 3 others, we hit a limit of 800Mbit/sec hard for some reason. Should have been about 870, I think, but haven't done the math. Add 20% or so to your burst parameter?

I created new plots with burst value as title:

25% increase
http://www.desipro.de/openwrt/flent/tcp_nup-2021-11-07T112914.046149.BURST140625.flent.gz
50% increase
http://www.desipro.de/openwrt/flent/tcp_nup-2021-11-07T114923.340090.BURST168750.flent.gz
100% increase
http://www.desipro.de/openwrt/flent/tcp_nup-2021-11-07T110339.742868.BURST224000.flent.gz