For you folks following along at home, the bufferbloat.net site has a description to help understand all these charts at: RRUL Chart Explanation...
3 Likes
@kong - can you get valid stats out of tc -s qdisc show or tc -s class show?
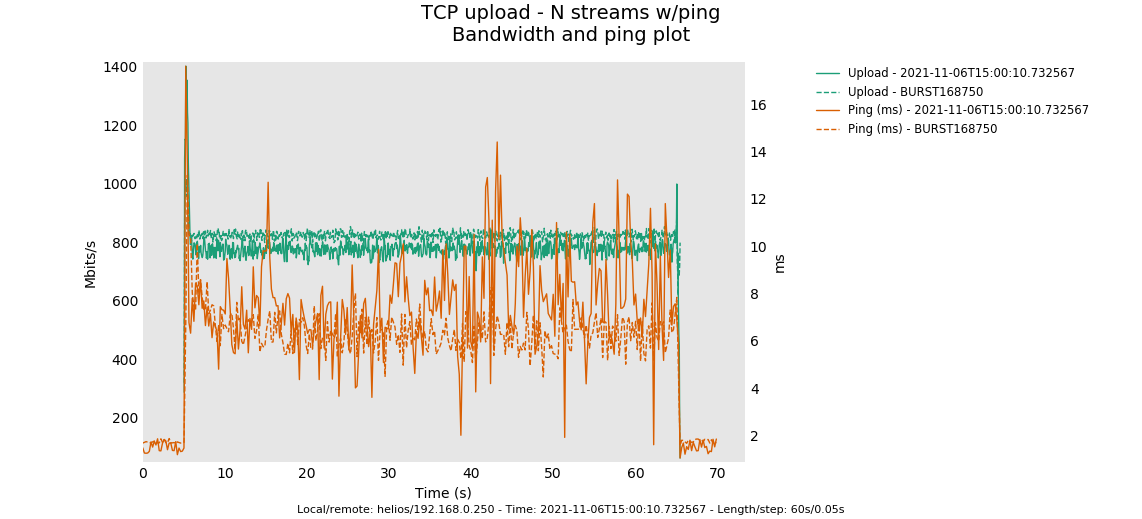
hmm. dont know where that 800mbit limit is coming from.It's mildly higher with a larger burst size and the ping is more stable (again we are engaging the codel component harder here).
Is GRO on on this device?
For laughs, try fq_codel quantum 300? We let that be the MTU at higher rates (in software'), but in practice the smaller quantum helps at lower loads (at the cost of a lot more cpu).
Another test would be to bump the rate up to 1GBit with the autoconfigured burst param and compare the shaped result at that speed vs just having fq_codel on without any shaper at all at that speed, still with flows 16.
in terms of even more wild speculation, double the packet limit. Thx for all your help!
OK, tried a couple of things including quantum change, qlen, nothing really changes things, but if I set rate to 950000, then we get 50000 more, with the same pings etc.
Only explanation for that is, that there is a bug in some calculation.
http://www.desipro.de/openwrt/flent/tcp_nup-2021-11-08T004821.799927.BURST112500.flent.gz
@moeller0 is our "king of weird framing math" guy, perhaps he can figure out the proper curve to set the rate here. Try 450 and 475 perhaps to get other data points?
Me, I am trying to figure out... hmm... do you overclock? underclock? have a dynamic cpu governor? the token bucket should fill independently of the actual clock rate...
Anyway, it sounds like lowering the burst size was an improvement, and tweaking it more up accomplishes little. Going back to the bifurcation we saw at flows 1024 vs flows 16, we have confirmed that codel is doing the right thing (5ms queue depth for ping and all flows holding steady except for some puzzling anomalies), but I'm really fond of having tons of queues for normal workloads.
One of my great joys in life is how much better than PIE this is, and has always been. Why do anything else, I've always thought... even if you could only hash into 16 or 32 queues as early experiments at cablelabs tried, drop head works so great....
If your brain hasn't exploded from overwork... a rrul test always makes me happy. There's one that has a settable number of flows.
And...
Just for giggles, if you are bored, and for SCIENCE! and since this is not an internet path, try target 1ms interval 10ms, flows 1024, tcp_nup with 128 flows. Nobody bothers to tune codel for the data center, and in software 1ms was about the lowest target we could achieve. What many don't "get" about that still being miserable is that on a 1Gbit path, a single packet takes 13us to traverse the network and an ack about 1us, so in an ideal world (one envisioned by both the l4s and SCE folk, with some interesting work now in BBRv2 for sub-packet windows) - you'd have 27us worth of buffering.
Are there any other cool or weird options nss lets you fiddle with? What does this accel_mode thing do?
I think you are talking about rrul_var. Here is my template for running this.
date ; ping -c 10 netperf-eu.bufferbloat.net ; ./run-flent --ipv4 -l 120 -H netperf-eu.bufferbloat.net rrul_var --remote-metadata=root@192.168.42.1 --test-parameter=cpu_stats_hosts=root@192.168.42.1 --socket-stats --test-parameter bidir_streams=8 --test-parameter markings=0,32,64,96,128,160,192,224 --test-parameter ping_hosts=1.1.1.1 -D . -t file_name_stem_string
0,32,64,96,128,160,192,224 are the TOS byte decimal values for CS0,CS1,CS2,CS3,CS4,CS5,CS6,CS7
192.168.42.1 is my openwrt router with flent-tools installed, and 1.1.1.1 is just an easy to remember address for an additional, close by ICMP reflector. I like to start out with a few manual pings so I have a better feel for the unloaded latency to the test servers...
853 Mbps TCP/IPv4 goodput out of 950 gross shaper rate
with before 800 out of 900... so ~100Mbps difference (or ~10%) that is a lot for overhead.... typically on Linux if no overhead is specified a qdisc will take the kernel's idea about an sku's size, which is 14 bytes larger than the IP frame size (which makes sense, as these 14 bytes are things the kernel itself might need to handle, but that obviously is not a complete picture of as most link layers require a whee bit more overhead/headers to do their thing). But I have no idea what the NSS code does internally. I do doubt though that
853 = 950 * ((1500-20-20)/(1500+X))
(1500 + X) = (950/853) * (1500-20-20)
X = ((950/853) * (1500-20-20)) - 1500 = 126.025791325
X = ((900/800) * (1500-20-20)) - 1500 = 142.5
100 Bytes of per-packet-overhead added inside the NSS qdisc would be the root cause of the issue.
Sorry, but I am out of ideas.
P.S.: The math is typically the lesser issue in "weird framing" compared to getting the information about the applicable per-packet-overheads.
I've been busy all weekend so I haven't been able to fiddle with flent, time is limited I'm afraid ![]()
I see you've been working with @KONG to get some decent measurements? I'll have to find some time to get flent started for the first time ![]()
-- EDIT --
@dtaht I've got flent installed on my NAS, I ran the very same commands like @KONG did first:
flent --step-size=.05 --socket-stats --te=upload_streams=4 tcp_nup -H netperf-eu.bufferbloat.net
flent --step-size=.05 --socket-stats --te=download_streams=4 tcp_ndown -H netperf-eu.bufferbloat.net
Now, to be clear, this is from a NSS build without SQM enabled. So you might call this my baseline without any form of SQM.
Here are the result files:
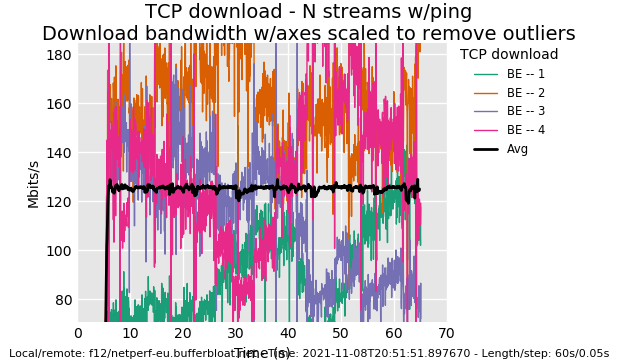
I'm getting to know flent step by step, I see that you can create plots from the data someone else gathered by using flent. I've attached a few to this post. I can't "read" these plots like you and KONG can but I can see a very clear difference between KONG's results with SQM for NSS and mine without:
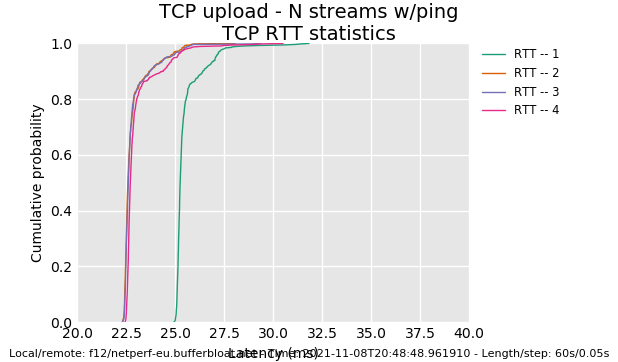
And another one:
If you guys would like to see more stuff, let me know what flent commands I need to enter and what I need to change/activate on my R7800 for NSS fq_codel.
Thx for contributing. I like having "teaching moments".
I'm not sure why the green flow is so slow for so long but it's not a huge problem.
What happens when a machine runs out of cpu is always variable, and I imagine your router ran out. You end up with drops on the rx ring typically. You could also have run out of memory bandwidth.
It may be your router doesn't have BQL in this mode. bqlmon is a good tool.
Check your NAS to see if it's running sch_fq or fq_codel (tc -s qdisc show). It doesn't look fq-y or fq-codelly, it looks like your queue is short as it looks like you ran out of buffer space on the rx ring or the egress qdisc.
In terms of teaching how to read stuff like this:
What we look for is a good tcp sawtooth, which this plot is reflection of, but as it is sampled, and is actually per packet, you don't see the detail you would see with an accurate simulation such as NS3. The cwnd plot can be more revealing. The "tighter" the sawtooth the more quickly a new flow can enter the link. The various tcp_square_wave tests are helpful in understanding that.
The width of the sawtooth is relative to the perceived delay (buffering + physical distance), the height relative to the number of flows and bandwidth, and the average, average. In a non-FQ'd world, you'll see the sawtooths cross up and down across the entire range of bandwidth, with FQ they hit the average and bounce off. The ultimate goal of tcp over any RTT is to give a fair share of the network to other TCPs but it takes a geometrically increasing amount of time to do the longer the perceived delay.
In order to see the bufferbloat problem in all it's glory that everyone had in 2011, and so many still have today, replace the egress qdisc on the router with pfifo, and repeat the test.
tc qdisc replace dev your_wan_interface pfifo 10000
A sawtooth is typical of Cubic and Reno. Cubic's sawtooth is, well, cubic, it has a distinct curve that cannot be seen at this resolution.
To see something very, very different, switch your tcp to bbr.
A lot of people have missed that flent has a gui. (flent-gui) it lets you flip between plots rapidly and merge two or more pieces of data to create a comparison plot.
btw, we have flent servers all over the world. There's one in germany, another in england.
Luckily I monitor my R7800 with luci_statistics and send that to InfluxDB/Grafana. These are the stats around the time I measured with flent:

The spikes you see above are the times I measured with flent.

No errors were measured
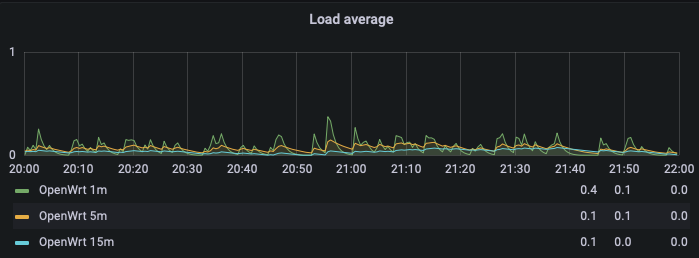
The router's load (it's a dual core, so no sweat at all)
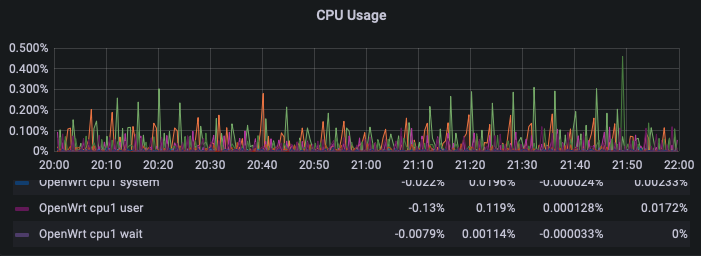
And the one we're after: CPU usage.
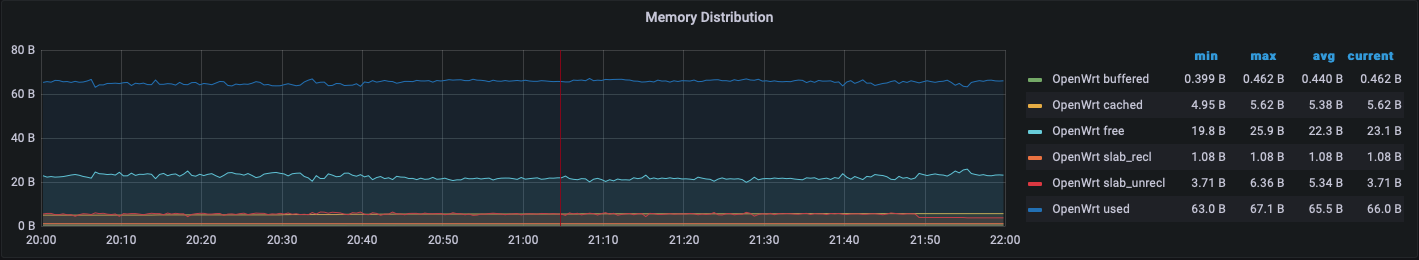
And how memory usage was at that time.
I can provide the RRD files too but they don't carry so much detail anymore like these pictures from Grafana.
It appears that BQL is zero, is that good?
root@OpenWrt:~# cat /sys/class/net/eth0/queues/tx-0/byte_queue_limits/limit
0
I don't think I have BQL, this R7800 is directly connected to the FTU/NT, so no ISP modem is interfering. How can I enable BQL?
I'm learning a lot! I had no idea my NAS (self built Ubuntu machine) was running anything like that:
~$ tc -s qdisc
qdisc noqueue 0: dev lo root refcnt 2
 Sent 0 bytes 0 pkt (dropped 0, overlimits 0 requeues 0)
 backlog 0b 0p requeues 0
qdisc fq_codel 0: dev eth0 root refcnt 2 limit 10240p flows 1024 quantum 1514 target 5.0ms interval 100.0ms memory_limit 32Mb ecn
 Sent 48942431499 bytes 67601851 pkt (dropped 7, overlimits 0 requeues 4560923)
 backlog 0b 0p requeues 4560923
  maxpacket 67770 drop_overlimit 0 new_flow_count 67801 ecn_mark 0
  new_flows_len 0 old_flows_len 0
qdisc noqueue 0: dev br-24e8282b2b0b root refcnt 2
 Sent 0 bytes 0 pkt (dropped 0, overlimits 0 requeues 0)
 backlog 0b 0p requeues 0
qdisc noqueue 0: dev docker0 root refcnt 2
 Sent 0 bytes 0 pkt (dropped 0, overlimits 0 requeues 0)
 backlog 0b 0p requeues 0
qdisc noqueue 0: dev br-65dbb47417f0 root refcnt 2
 Sent 0 bytes 0 pkt (dropped 0, overlimits 0 requeues 0)
 backlog 0b 0p requeues 0
qdisc noqueue 0: dev br-d105b742a060 root refcnt 2
 Sent 0 bytes 0 pkt (dropped 0, overlimits 0 requeues 0)
 backlog 0b 0p requeues 0
qdisc noqueue 0: dev veth08
I'm running docker on this NAS, I didn't include all the queue's for each container.
Ah, since it's al about buffering, a tighter sawtooth means less time spent in buffer processing. A wide sawtooth means some device is waiting for packets that isn't being transmitted by another. A tighter sawtooth means both communicating devices are perfectly teamed up and "synchronized". Am I right?
Gotcha, so if a sawtooth is very large and wide, that's a huge waste of time and add's up to latency in the chain from source to destination. Every layer in the OSI model add's it's own piece of buffering, the goal is to get them all aligned and tuned to another so that buffers can be smaller and pass data along as soon as it's received.
I'll do that when I'm the only one on the home network, right now I'm not ![]()
Just a quick note, you can try running your nas with cake gso-split without a bandwidth parameter, and get less latency for mixed traffic... if you have "enough cpu" on it. I really need to come up with another term for that, as we don't mean straight line cpu performance but the ability to context switch rapidly.
Also, if you are a graphena whiz? I've longed to plot dynamically the output of a high resolution irtt sample, but the output has two problems in that it uses mixed units (us, ms, s), and the one way delay measurements require a sync'd clock. the rtt measurement does not. (ok, that's three problems). If your nas however is doing nothing but TCP (no tunnels), sch_fq is better that fq_codel.
The json output doesn't use mixed units but requires the test complete before plotting. four problems.
a typical test I do is:
irtt client -i3ms -d1m --dscp=0xfe
and then I parse that with tr, awk and gnuplot. There isn't a way to send the json output (-o whatever.json) to a stream either. I have some really cool plots of how starlink works but haven't twiddled it enough to do one way delay yet (five problems).
@dtaht @moeller0 OK. I saw dropped packets on the machine which is previously hosted netserver, therefore I just installed netserver on my laptop and verified, that I see no dropped packets on client and server side. The result looks better. Upload is about 840Mbps now when I configure a limit of 900Mbps.
http://www.desipro.de/openwrt/flent/tcp_nup-2021-11-14T214732.043951.BURST112500.flent.gz
Heh. Thx for digging further into it. Ironically chrome will no longer let me download flent.gz files from this site for some reason, but your result now seems close enough to correct to just ship.
I'm still quite puzzled as to the bifurcation thing that happened, and would like to somehow test ipv6.
For giggles how does it work if you hash into a prime number of buckets? Say 17 or 31.
67 or 997 might be better. I know I was a really weird kid, but for some reason I memorized a bunch of primes like that.
1 Like
at one point I was helping hisham and he didn't have access to cake. we were trying to get per-internal-ip fairness using DRR, If I remember right, we did some packet captures and decided on some average number of streams on his network, and then picked a prime number such that the typical number of streams hashing to a bucket was something like 6, the prime might have been like 11 or 7 or something. The idea being that whether you had the avg number or +1 or -1 or whatever, it'd be a smallish percentage change from the avg. If you try to get always 1 per bucket, then if you get a collision it's suddenly 2x as much as normal!
Just some thoughts.
Thanks, the flent series meta reports a sum of 819 Mbps, while the theoretical maximum for a shaper rate of 900 is (assuming TCP/IPv4 without options and no explicit overhead configured):
900 * ((1500-20-20)/(1500+14)) = 867.90 Mbps
IMHO that seems pretty usable, but I will happily trade-in throughput for better latency-under-load performance.
Aside from testing with ipv6, how about with nat enabled?
What other offloads are in this thing?