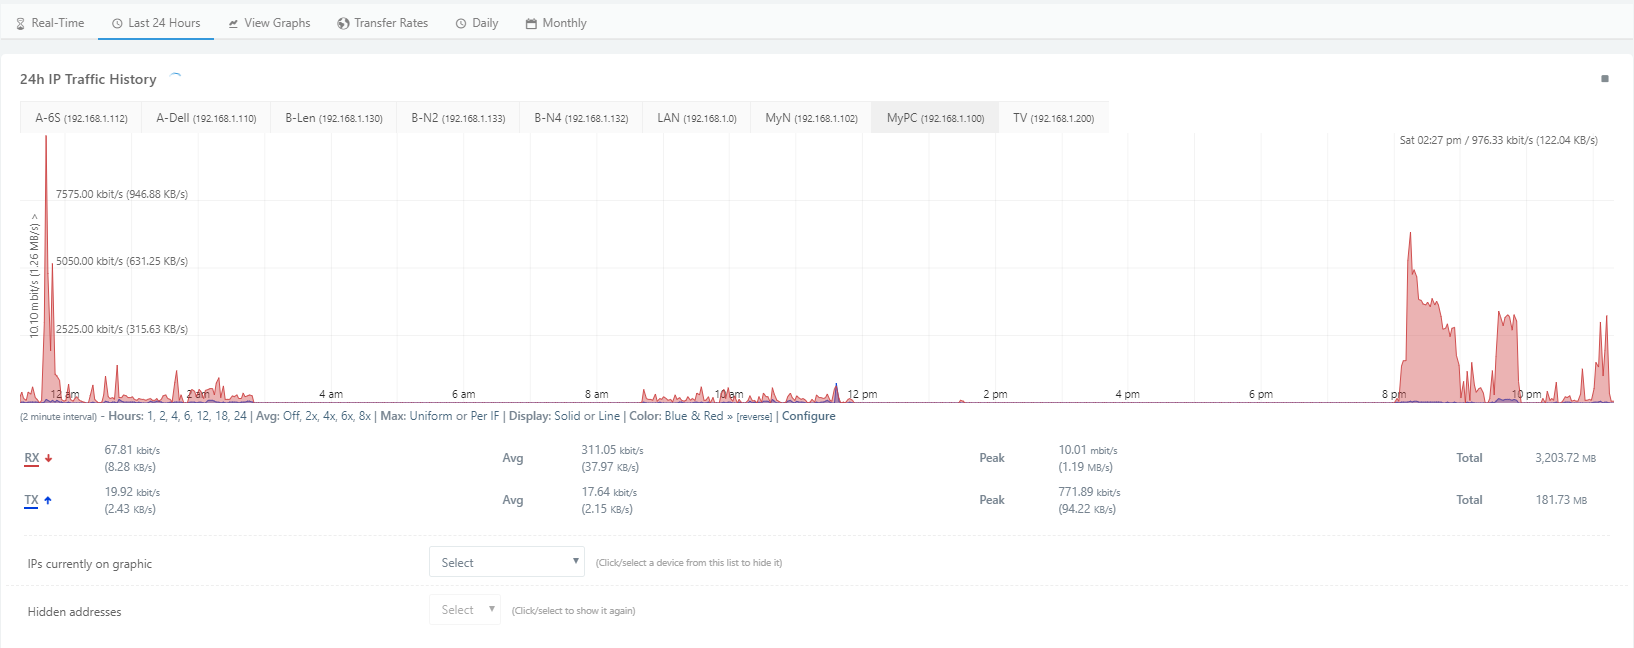
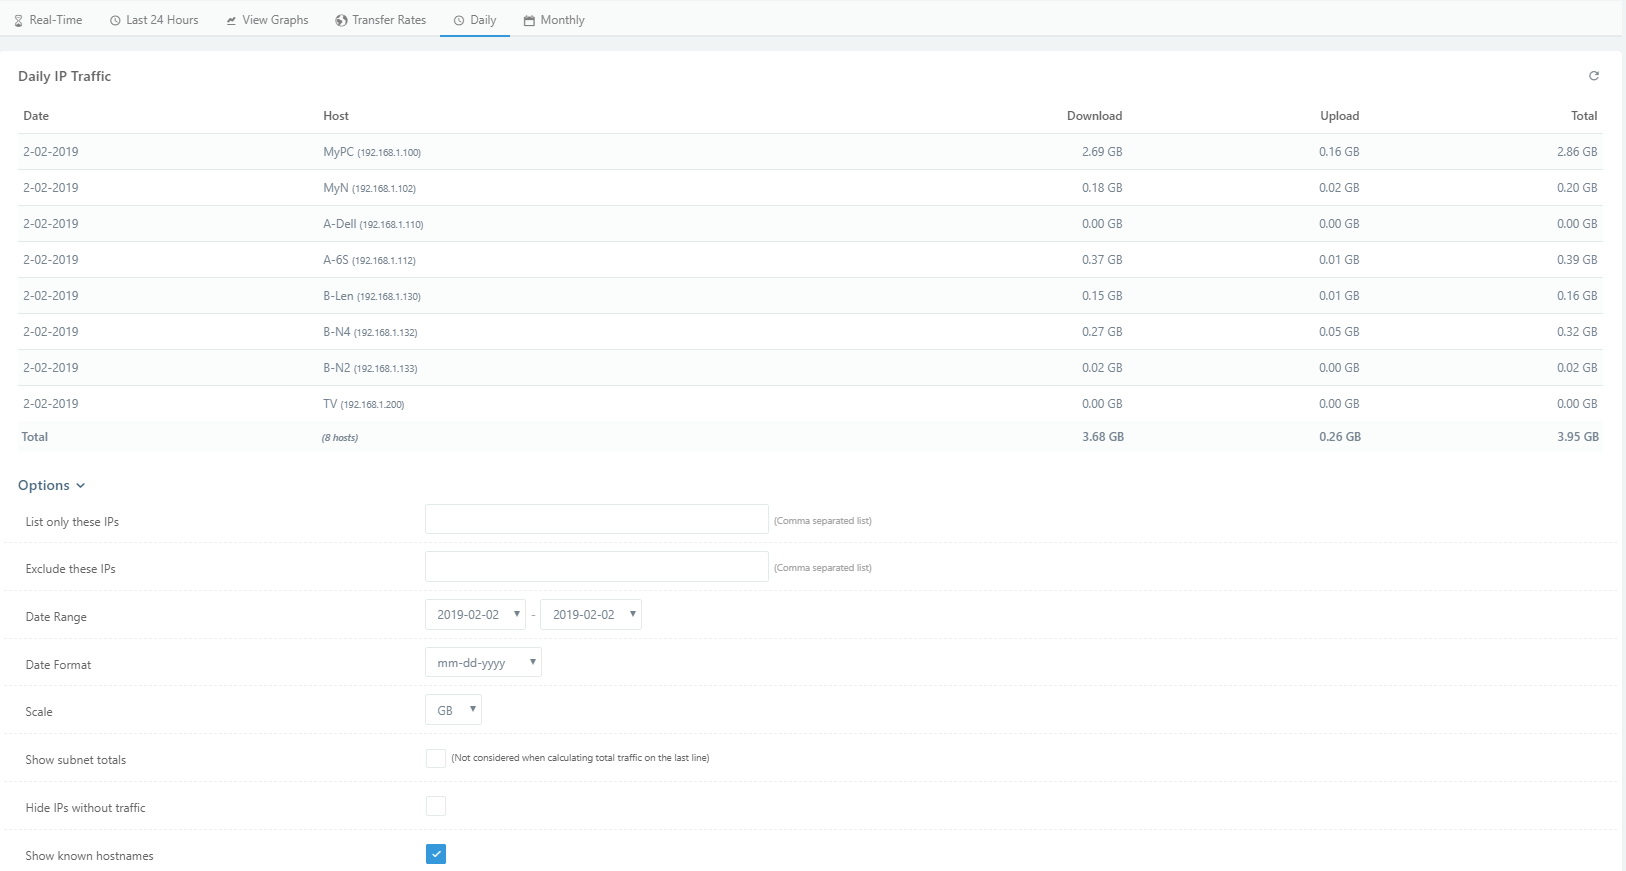
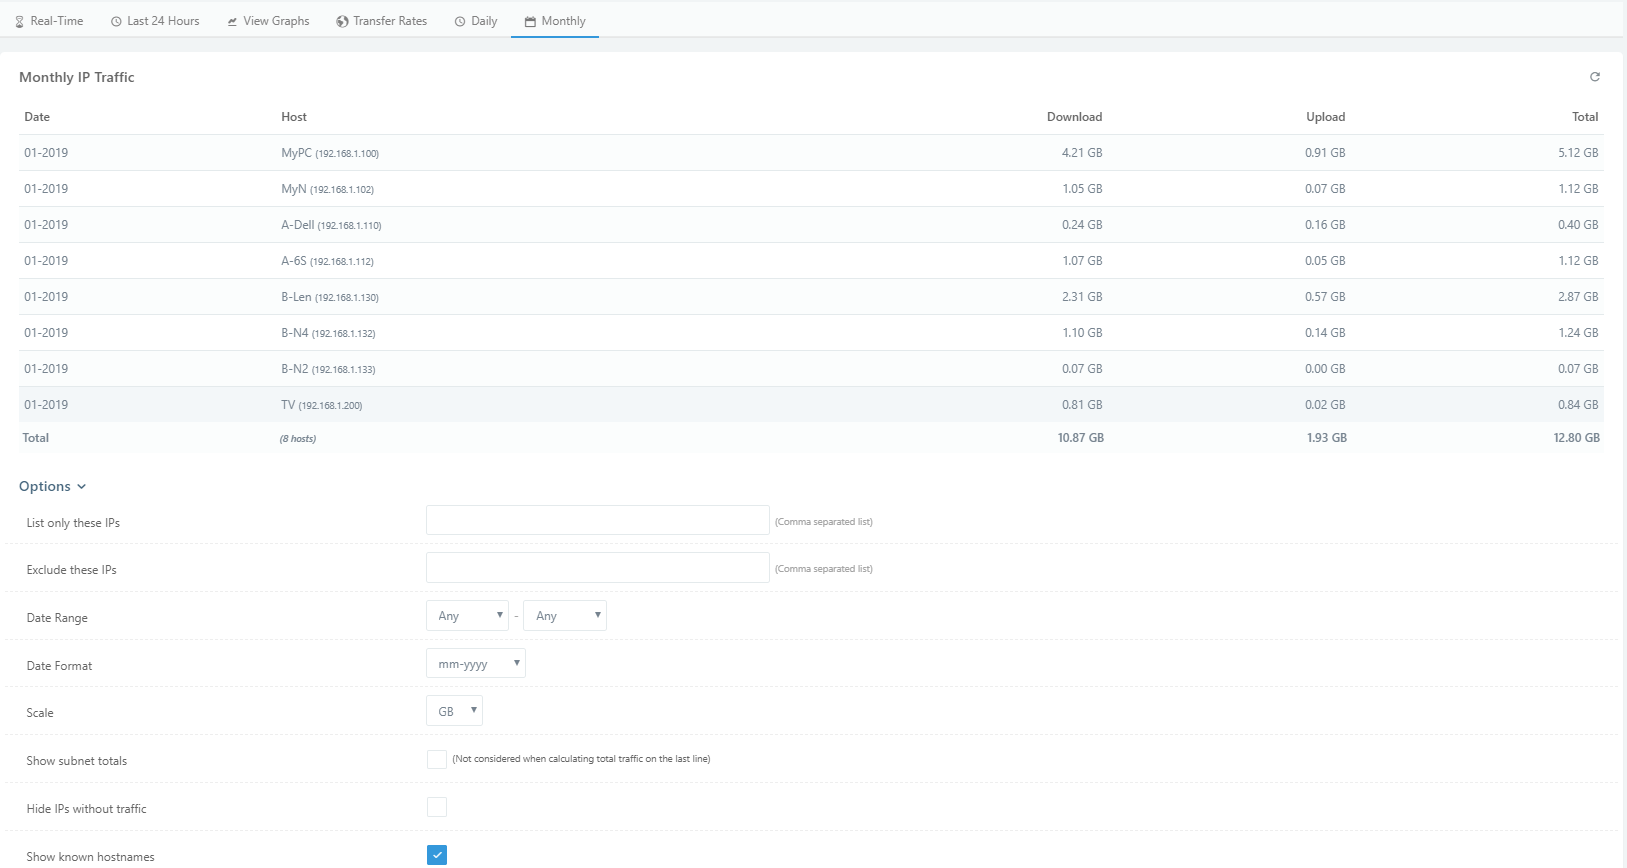
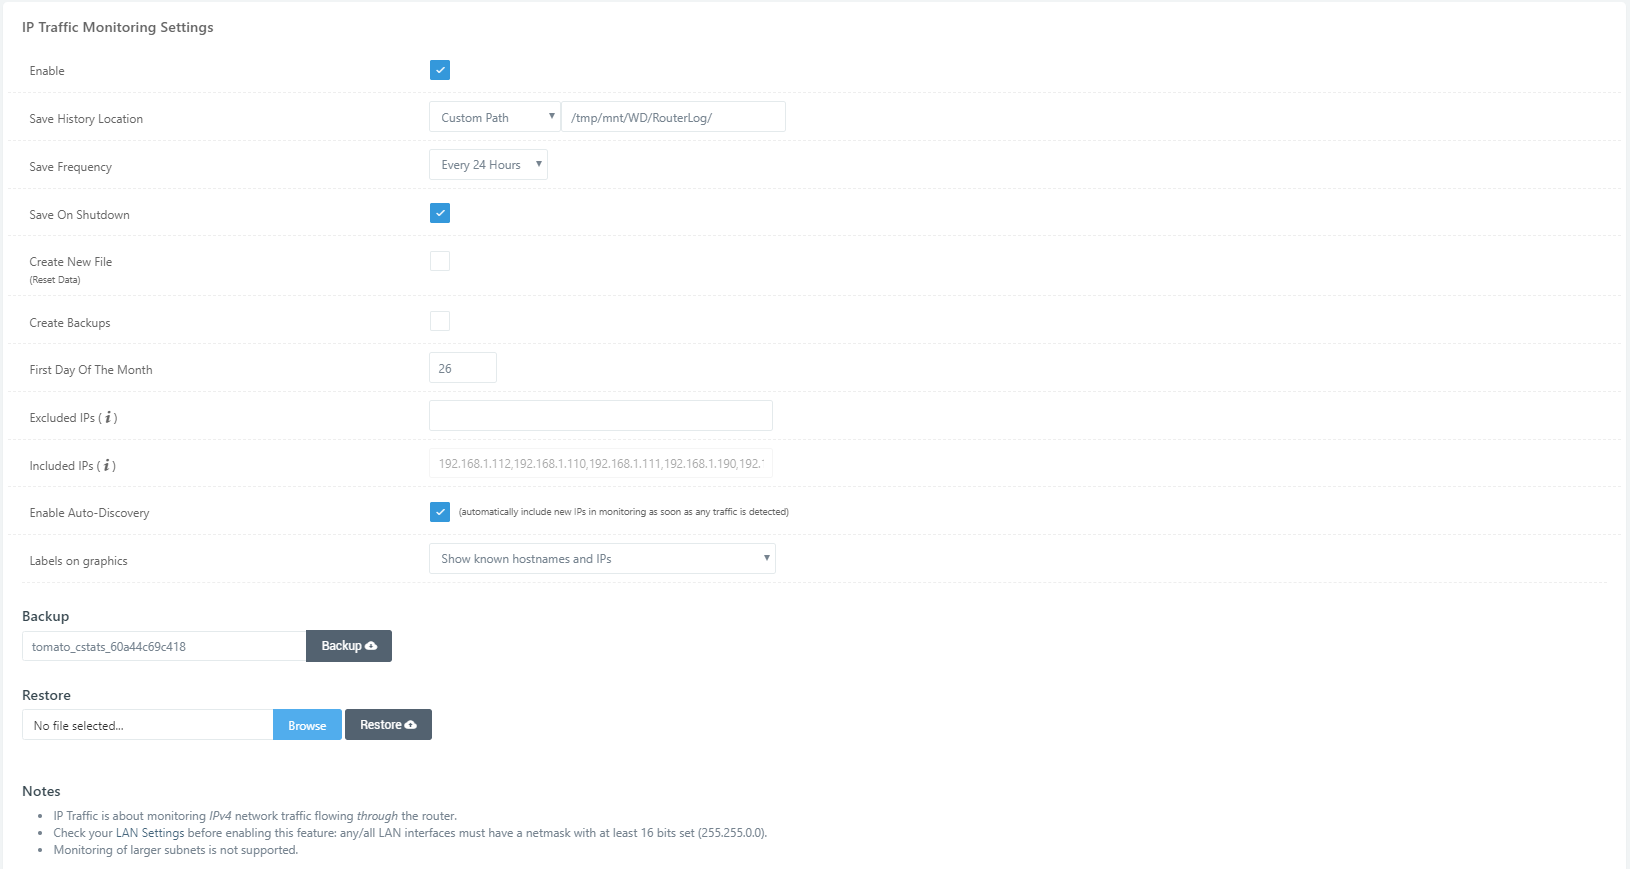
I am using an Asus RT-AC66UI ad my main router, running AdvancedTomato which have very decent traffic monitoring utility that displays interactive graphs for real time IP traffic (LAN side IPs), plus historical data. It's kind of useful for people who have limited monthly bandwidth (welcome to my world), so it's kind of useful to see what devices are consuming bandwidth.
I have gone through the documentations for OpenWrt regarding bandwidth monitoring and checked the different packages. It doesn't look like there is one package that can do the same easily. There are packages that show per IP traffic and there are packages that show historical, but I didn't find a package that does both, plus the interface and graphics is really outdated.
I love that the OpenWrt is continuously updated and maintained, thanks to the community here. I believe the development of such package could really be a good add-on to a great project. I'm not technically able to develop such tool, but I could provide screen shots of AdvancedTomato interface as starting point
With my "product manager hat on", with a sentence or two each, what are the things you'd like to be able to achieve?
An example might be, "I'd like to be able to know the total bandwidth consumed from the start of my billing period until the present, for each client IP, as well as the total."
The following images are from AdvancedTomato (which is a modern interface for Tomato by Shibby. It works well actually, but the fact that it's for a small number of routers, plus that it's not regularly updated is a downside.
I understand that OpenWrt is mostly for advanced users, but even advanced users could enjoy some nice customizable graphics, plus it could make it easier for novices.
I take the opportunity to suggest that features such as USB support (including NTFS) and miniDLNA to be included out of the box, as it's popular to use the router as DLNA server.
Yes, I am aware of bwmon and the likes, but I haven't found a package with modern interactive graphics, or simple overview of both real time and historical usage.
That one looks promising. I recall visiting it earlier before installing OpenWrt. The shortcoming is that it mandates using a USB storage for that. (some other solutions allow temporary storage on RAM or even NVRAM).
I am not sure if it gives data of real time usage or not, but I will give it a try.
The closest thing I found was YaMon https://usage-monitoring.com/index.php. It's feature rich but not very user friendly or elegant looking, and it requires a USB device.
I have the good intention to try to develop something, but I'm not prepared yet.
Would it be technically possible to modify the view in Luci at /cgi-bin/luci/admin/status/realtime/bandwidth to be able to list the amount of traffic used by client?
It doesn't require a flash drive. You can place it on a server and SMB share its folder, then mount it on OpenWRT. Its dev doesn't officially support this, but I've been using it so for 2 years with no issue.
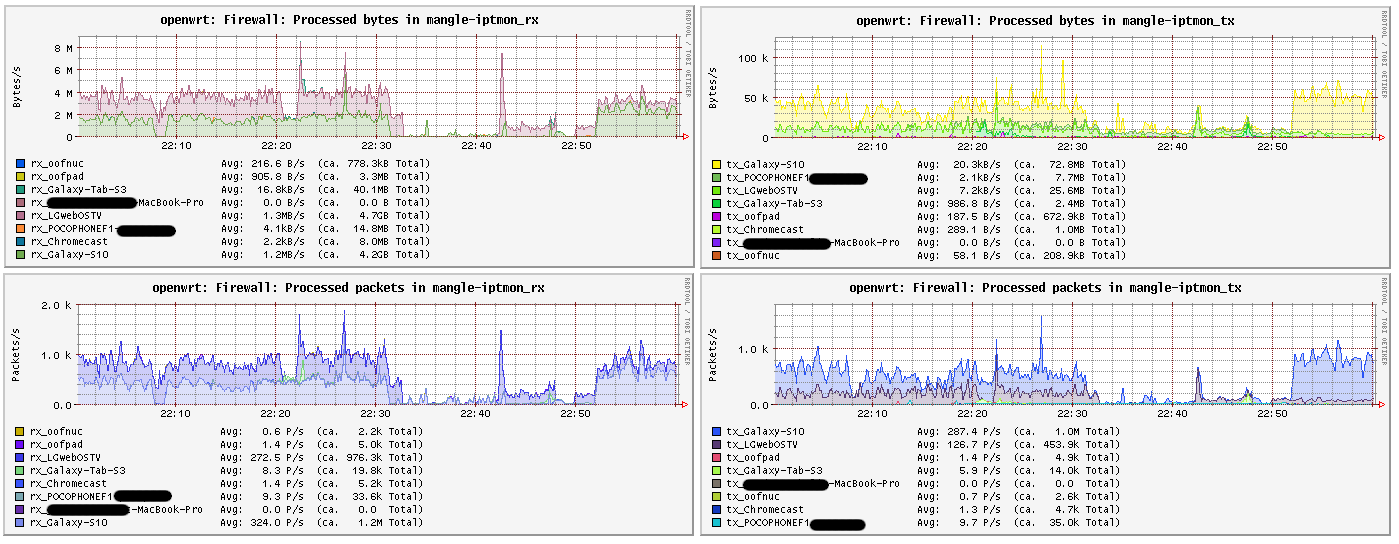
iptmon uses kernel netfilter rules to track data usage per IP address, making that data available directly through the web UI with luci-app-statistics. It supports both IPv4 and IPv6, dynamic updates through dnsmasq hooks, and is cross-platform (written in shell script) and resource efficient (no resident process, install size ~4kB). I have been maintaining it for a little over a year and it fits my needs nicely.
I have been trying to use several traffic monitoring packages: vnStat (doesn't provide data per device), nlbwmon (after a while it stops monitoring without any error or info in the system log), and now I am testing iptmon. Actually, it requires way more than just 4kb as it requires a lot of libraries, and the installation process requires a little bit more work than just opkging the ipk file. I will test it for a while to see if it can track the information I want. I would like to see the way it can handle a router with limited storage without USB.
This is the best I could create using grafana for the frontend.
It uses the Prometheus and collectd software on the router to collect basic metrics.
I installed IPTMON on the router to collect per IP traffic.
I set up Prometheus, collectd-exporter and grafana on my home server.
I created a GIT more for my sake so I can remember what I did. But it's also available to the public. You'll have to modify some of the configs such as your home server IP address.