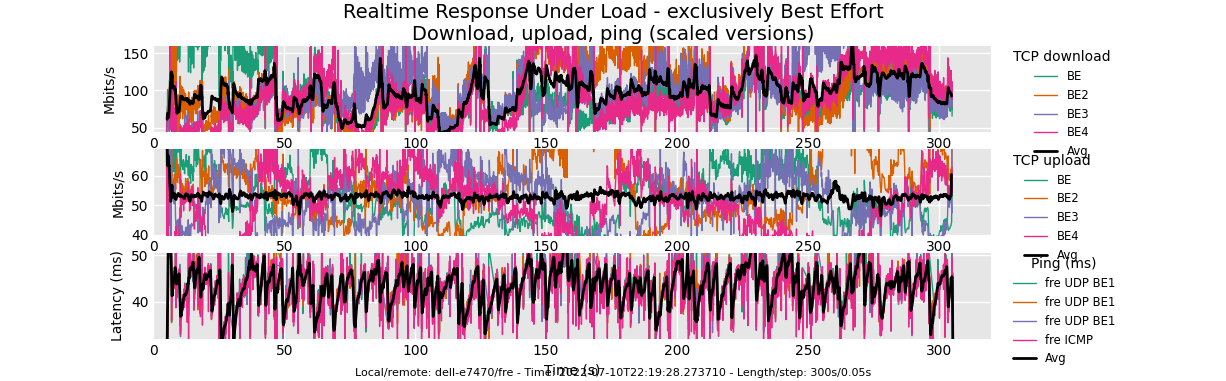
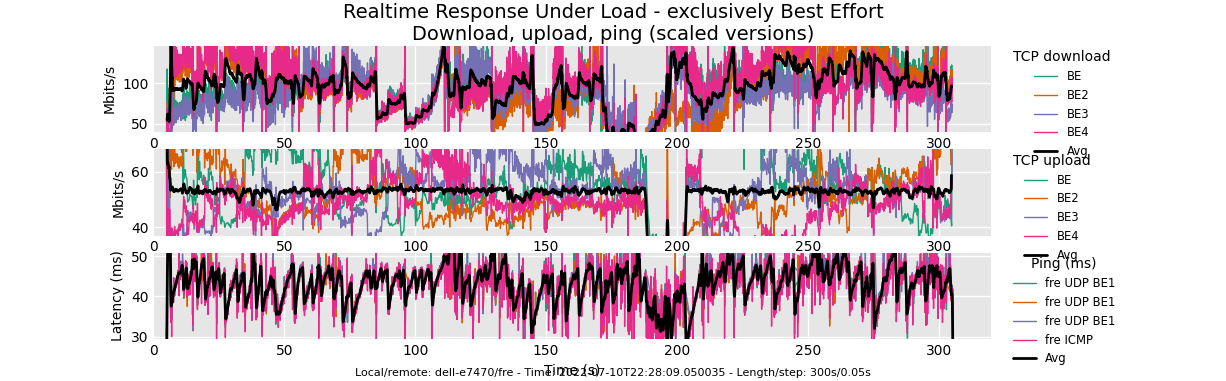
Flent client was connected (1000Mb/s, full duplex) to a LAN port on the router R7800. The test was repeated twice against the server flent-fremont.bufferbloat.net.
Somehow I don't fully trust these public Flent servers. The graphs only look nice for people having relatively slow D/U speeds. I will connect a local Flent server on the WAN port and then LAN port and run the tests tomorrow.
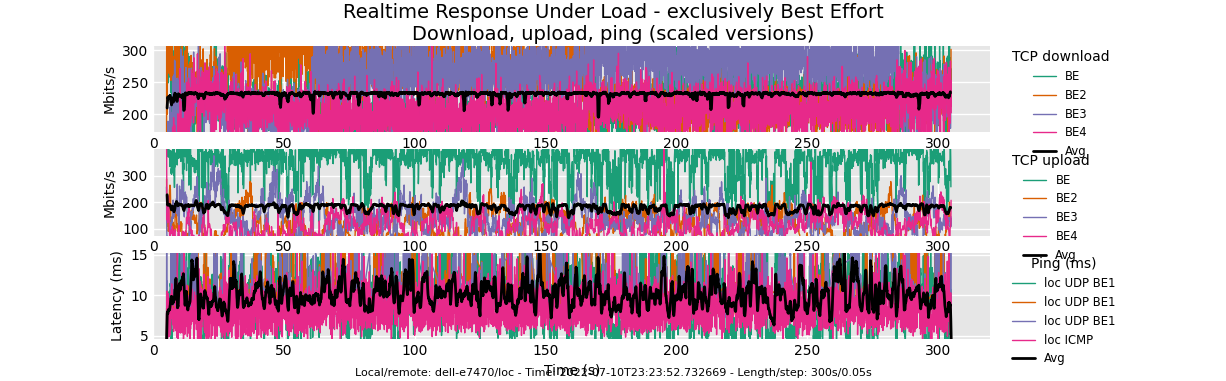
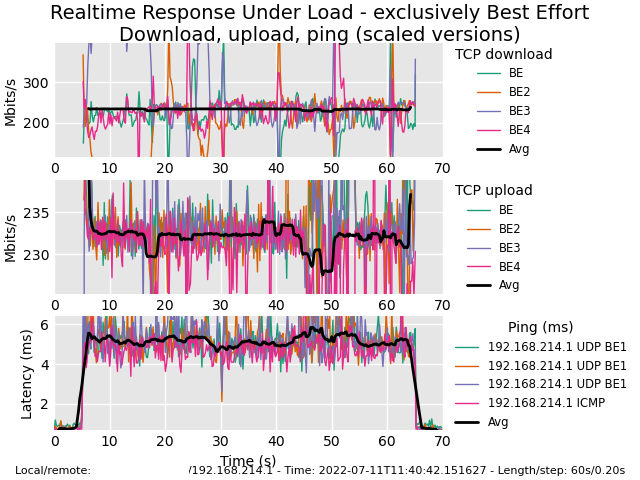
Here are the wired tests against local server running on the router R7800 itself. Compare them to the similar tests (same local server) for wireless client, we just have to think of WIFI like a living beating heart and wired Ethernet like a dead flat-lined electrocardiogram. Make WIFI a livingly "lovely" tsunami, not deadly "homely" flat-liner! J/k
@amteza Thx for showing a 110Mbit loss of throughput on this simper test comparing the reference release and your patchset.
Going back to the rpm test, I see it is using 20! download streams in your 800 RPM case, and 12 in the 3600 case.
Could you repeat the ndown test with 20 flows? (working hypothesis: we are scaling badly as we add flows)
Do you have two boxes setup for this or are you reflashing the same one? Even a distance of a millimeter could be accounting for the throughput difference.
I did not monitor router CPU usage during the tests.
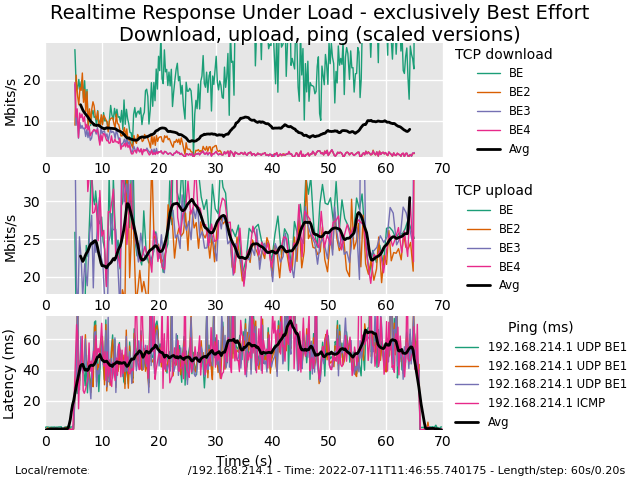
rrul_be WIRED test to local router/AP:
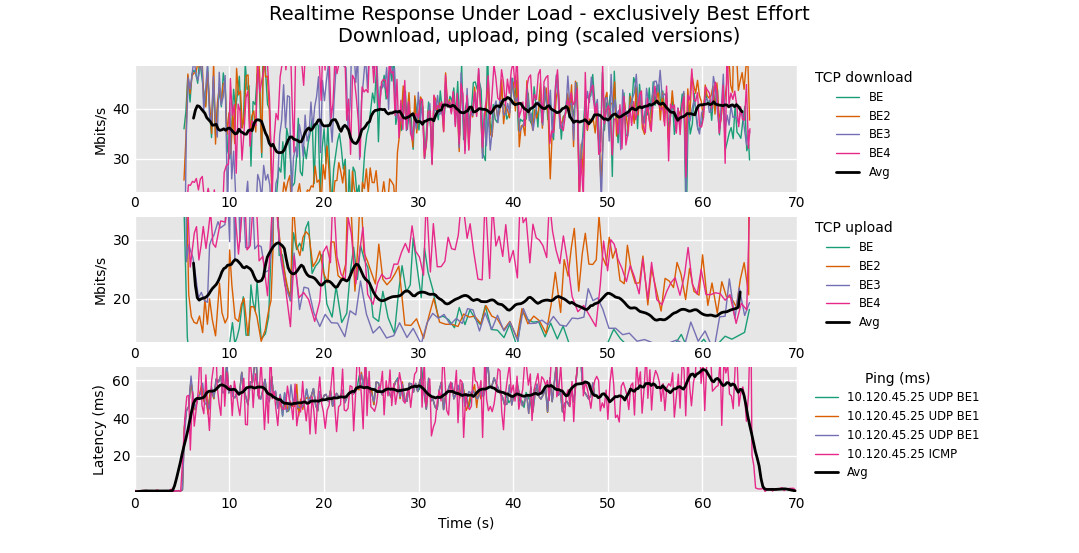
rrul_be WIFI test to local router/AP:
Client and router are in the same room. No wall in between.
"iwd" showed RSSI as -4300 which I believe translates to -43 dBm.
My Google Pixel 6 phone sitting next to the laptop showed same WiFi SSID RSSI as -38 dBm.
There's a couple different RT3200s out there... the belkin wifi 6 router? The client is on what wifi chip? Update - sorry, did not read the link to the pointer to the device...
You should be getting 100s of mbits out of this setup, but I'm confused - is HE20 a single channel, like HT20?
As much as I might advocate for minimal channel use, few folk testing ac and ax gear run below VHT80. If it's really a single channel then that's kind of near what we would expect from a wireless-n device.
But: The green BE download should not have run away with all the bandwidth, nor the ratio between down and up so poor.
What form of WPA is enabled? Update - still precoffee here - ok, WPA3. Try WPA2?
As for the wired result, pretty good, was there other traffic on the link to account for the upload loss at T+18 and T+49-T+52? (a 5 minute test is helpful for periodic checks)
the yoga's Intel Wireless AC-9560 should be fq_codel enabled in linux releases after 5.4, I think. Does it have noqueue as a qdisc and an aqm file in /sys/kernel/debug/iee*/phy*/aqm?
I think there is something else/more going on other than just a noqueue qdisc and lack of aqm on the linux client. I suspect HE20 (an 802.11ax throughput mode) might be part of it, but I don't think this explains the green BE download ending up with all the bandwidth. I do suspect other clients on the network are contributing to that.
@ka2107: simplest thing to do is retest a few times and see if the results reproduce (if possible try this with only one client on this band and then again with a few connected).
For reference, my linux kernel 5.4 laptop with an intel 7260 wifi card (noqueue qdisc, aqm file present but I cant output from it) connected to my r7500v2 on 5 GHz, channel 36, VHT80:
Multiple clients are connected to 5GHz but only the laptop is active during this test. Durring an earlier test, all the BE download streams went to near 0 Mbps at about 40s into the test for about 5 s and then recovered. This I suspect is the result of other 5GHz wifi clients network activity.
In short, @ka2107's set up should be "running circles around mine while laughing and singing happily"
FWIW, how AQL/ATF behaves with a "one" clinet flent test is useful to establish it's working as intended, nothing crashes, latency bugs are fixed, etc.; however, most use cases are with 6 to dozens of clients connected. I do still have wifi issues and I think they are related to how my AP behaves with multiple clients using it. I just don't know yet how to identify, demonstrate, or report it in a way that is "actionable" for a dev to fix it. I still suspect AQL/ATF contributing to that, but I also know its not all of it.
If there is still "fuel left in the tank" after the immediate bugs are sufficiently resolved, then maybe we could spend time on that - but I'm in no rush so take Aug. to ? off.
HE20 is 20 MHz 802.11ax (WiFi 6). In my Apt, channel 165 is the only channel that is completely free of any SSIDs. However Channel 165 is a 20 MHz only (no adjacent channels for 40 MHz or 80 MHz).
I thought with my plan speed being only 50/10 Mbps, I can get away with using only a single 20 MHz channel. My Google Pixel 6 connect to the WIFI in HE20 (802.11ax) mode and my Yoga laptop (Intel 9560) connects in VHT20 (802.11ac) mode.
# cat /sys/kernel/debug/ieee80211/phy0/aqm
access name value
R fq_flows_cnt 4096
R fq_backlog 0
R fq_overlimit 0
R fq_overmemory 0
R fq_collisions 0
R fq_memory_usage 0
RW fq_memory_limit 16777216
RW fq_limit 8192
RW fq_quantum 300
# uname -a
Linux  5.18.10-arch1-1 #1 SMP PREEMPT_DYNAMIC Thu, 07 Jul 2022 17:18:13 +0000 x86_64 GNU/Linux
Because with them, pinging the router goes up to 2,000 ms every 10 seconds, packets even get lost. After removing them, as per your suggestion to test, things are much much better.
Agree that green BE should not be hogging. Is GSO/GRO in use?
Massively agree that ATF and per station queueing are important to test next.
Delighted we aren't crashing.
Disturbed at 60ms induced latency on the intel implementation. Should be around 40. 6 year old Food for thought:
@nbd you have done a massive amount of work on rate control in the last decade. Several of the results on this thread looks more like a rate control issue. To what extent is anything I used to semi-understand in charge of rate control on the iwl, the mt76, the ath10k, 11k, 9k?
PING 192.168.1.1 (192.168.1.1) 56(84) bytes of data.
64 bytes from 192.168.1.1: icmp_seq=1 ttl=64 time=5.09 ms
64 bytes from 192.168.1.1: icmp_seq=2 ttl=64 time=3.98 ms
64 bytes from 192.168.1.1: icmp_seq=3 ttl=64 time=5.20 ms
64 bytes from 192.168.1.1: icmp_seq=4 ttl=64 time=3.83 ms
64 bytes from 192.168.1.1: icmp_seq=5 ttl=64 time=3.03 ms
64 bytes from 192.168.1.1: icmp_seq=6 ttl=64 time=3.45 ms
64 bytes from 192.168.1.1: icmp_seq=7 ttl=64 time=3.64 ms
64 bytes from 192.168.1.1: icmp_seq=8 ttl=64 time=4.59 ms
64 bytes from 192.168.1.1: icmp_seq=9 ttl=64 time=5.24 ms
64 bytes from 192.168.1.1: icmp_seq=10 ttl=64 time=5.22 ms
64 bytes from 192.168.1.1: icmp_seq=11 ttl=64 time=6.34 ms
64 bytes from 192.168.1.1: icmp_seq=12 ttl=64 time=5.53 ms
64 bytes from 192.168.1.1: icmp_seq=13 ttl=64 time=5.19 ms
64 bytes from 192.168.1.1: icmp_seq=14 ttl=64 time=4.75 ms
64 bytes from 192.168.1.1: icmp_seq=15 ttl=64 time=4.75 ms
64 bytes from 192.168.1.1: icmp_seq=16 ttl=64 time=4.64 ms
64 bytes from 192.168.1.1: icmp_seq=17 ttl=64 time=3.65 ms
64 bytes from 192.168.1.1: icmp_seq=18 ttl=64 time=3.32 ms
64 bytes from 192.168.1.1: icmp_seq=19 ttl=64 time=4.86 ms
64 bytes from 192.168.1.1: icmp_seq=20 ttl=64 time=3.58 ms
64 bytes from 192.168.1.1: icmp_seq=21 ttl=64 time=3.55 ms
64 bytes from 192.168.1.1: icmp_seq=22 ttl=64 time=3.35 ms
64 bytes from 192.168.1.1: icmp_seq=23 ttl=64 time=5.17 ms
64 bytes from 192.168.1.1: icmp_seq=24 ttl=64 time=4.01 ms
64 bytes from 192.168.1.1: icmp_seq=25 ttl=64 time=3.08 ms
64 bytes from 192.168.1.1: icmp_seq=26 ttl=64 time=5.25 ms
64 bytes from 192.168.1.1: icmp_seq=27 ttl=64 time=4.35 ms
64 bytes from 192.168.1.1: icmp_seq=28 ttl=64 time=4.51 ms
64 bytes from 192.168.1.1: icmp_seq=29 ttl=64 time=4.23 ms
64 bytes from 192.168.1.1: icmp_seq=30 ttl=64 time=5.77 ms
64 bytes from 192.168.1.1: icmp_seq=31 ttl=64 time=3.46 ms
64 bytes from 192.168.1.1: icmp_seq=32 ttl=64 time=4.85 ms
64 bytes from 192.168.1.1: icmp_seq=33 ttl=64 time=2.10 ms
64 bytes from 192.168.1.1: icmp_seq=34 ttl=64 time=4.35 ms
64 bytes from 192.168.1.1: icmp_seq=35 ttl=64 time=3.68 ms
64 bytes from 192.168.1.1: icmp_seq=36 ttl=64 time=4.18 ms
64 bytes from 192.168.1.1: icmp_seq=37 ttl=64 time=3.87 ms
64 bytes from 192.168.1.1: icmp_seq=38 ttl=64 time=4.05 ms
64 bytes from 192.168.1.1: icmp_seq=39 ttl=64 time=3.98 ms
64 bytes from 192.168.1.1: icmp_seq=40 ttl=64 time=4.62 ms
64 bytes from 192.168.1.1: icmp_seq=41 ttl=64 time=3.41 ms
64 bytes from 192.168.1.1: icmp_seq=42 ttl=64 time=3.72 ms
64 bytes from 192.168.1.1: icmp_seq=43 ttl=64 time=1.81 ms
64 bytes from 192.168.1.1: icmp_seq=44 ttl=64 time=1.94 ms
64 bytes from 192.168.1.1: icmp_seq=45 ttl=64 time=4.02 ms
64 bytes from 192.168.1.1: icmp_seq=46 ttl=64 time=4.73 ms
64 bytes from 192.168.1.1: icmp_seq=47 ttl=64 time=3.12 ms
64 bytes from 192.168.1.1: icmp_seq=48 ttl=64 time=5.35 ms
64 bytes from 192.168.1.1: icmp_seq=49 ttl=64 time=3.25 ms
64 bytes from 192.168.1.1: icmp_seq=50 ttl=64 time=3.31 ms
64 bytes from 192.168.1.1: icmp_seq=51 ttl=64 time=2.30 ms
64 bytes from 192.168.1.1: icmp_seq=52 ttl=64 time=3.99 ms
64 bytes from 192.168.1.1: icmp_seq=53 ttl=64 time=3.90 ms
64 bytes from 192.168.1.1: icmp_seq=54 ttl=64 time=4.83 ms
64 bytes from 192.168.1.1: icmp_seq=55 ttl=64 time=2.07 ms
64 bytes from 192.168.1.1: icmp_seq=56 ttl=64 time=2.81 ms
64 bytes from 192.168.1.1: icmp_seq=57 ttl=64 time=1.81 ms
64 bytes from 192.168.1.1: icmp_seq=58 ttl=64 time=3.64 ms
64 bytes from 192.168.1.1: icmp_seq=59 ttl=64 time=5.06 ms
64 bytes from 192.168.1.1: icmp_seq=60 ttl=64 time=3.63 ms
64 bytes from 192.168.1.1: icmp_seq=61 ttl=64 time=3.67 ms
64 bytes from 192.168.1.1: icmp_seq=62 ttl=64 time=4.64 ms
64 bytes from 192.168.1.1: icmp_seq=63 ttl=64 time=3.89 ms
64 bytes from 192.168.1.1: icmp_seq=64 ttl=64 time=3.28 ms
64 bytes from 192.168.1.1: icmp_seq=65 ttl=64 time=3.83 ms
64 bytes from 192.168.1.1: icmp_seq=66 ttl=64 time=3.92 ms
64 bytes from 192.168.1.1: icmp_seq=67 ttl=64 time=3.78 ms
64 bytes from 192.168.1.1: icmp_seq=68 ttl=64 time=4.87 ms
64 bytes from 192.168.1.1: icmp_seq=69 ttl=64 time=4.24 ms
64 bytes from 192.168.1.1: icmp_seq=70 ttl=64 time=4.35 ms
64 bytes from 192.168.1.1: icmp_seq=71 ttl=64 time=3.85 ms
64 bytes from 192.168.1.1: icmp_seq=72 ttl=64 time=4.88 ms
64 bytes from 192.168.1.1: icmp_seq=73 ttl=64 time=3.50 ms
64 bytes from 192.168.1.1: icmp_seq=74 ttl=64 time=3.49 ms
64 bytes from 192.168.1.1: icmp_seq=75 ttl=64 time=4.01 ms
64 bytes from 192.168.1.1: icmp_seq=76 ttl=64 time=4.33 ms
64 bytes from 192.168.1.1: icmp_seq=77 ttl=64 time=3.67 ms
64 bytes from 192.168.1.1: icmp_seq=78 ttl=64 time=3.93 ms
64 bytes from 192.168.1.1: icmp_seq=79 ttl=64 time=4.29 ms
64 bytes from 192.168.1.1: icmp_seq=80 ttl=64 time=4.06 ms
64 bytes from 192.168.1.1: icmp_seq=81 ttl=64 time=4.06 ms
64 bytes from 192.168.1.1: icmp_seq=82 ttl=64 time=4.89 ms
64 bytes from 192.168.1.1: icmp_seq=83 ttl=64 time=3.93 ms
64 bytes from 192.168.1.1: icmp_seq=84 ttl=64 time=1.57 ms
64 bytes from 192.168.1.1: icmp_seq=85 ttl=64 time=4.24 ms
64 bytes from 192.168.1.1: icmp_seq=86 ttl=64 time=4.73 ms
64 bytes from 192.168.1.1: icmp_seq=87 ttl=64 time=2.48 ms
64 bytes from 192.168.1.1: icmp_seq=88 ttl=64 time=4.01 ms
64 bytes from 192.168.1.1: icmp_seq=89 ttl=64 time=3.91 ms
64 bytes from 192.168.1.1: icmp_seq=90 ttl=64 time=5.84 ms
I read long ago your recommendation to set it to 300 if connection is lower than 40 Mbps, otherwise 1514, right? Shall we bring it back to 1514? WiFi 5 and 6 are clearly over 40 Mpbs.
My computer is finalising a run of 2.5 hours rrull_be test, sorry it couldn't be all night.
Found something, kinda funny:
Top Level Statistics
● root@nemesis:/sys/kernel/debug/ieee80211/phy0# cat aqm
access name value
R fq_flows_cnt 4096
R fq_backlog 0
R fq_overlimit 0
R fq_overmemory 0
R fq_collisions 14
R fq_memory_usage 0
RW fq_memory_limit 4194304 # 4MB on 802.11n per device not SSID
RW fq_limit 2048 # packet limit IMHO too high by default
RW fq_quantum 1514 # 300 currently by default, no...
The above comes from an slide deck, and I reckon it's yours, @dtaht. So, our (my) current parameters on an 802.11ac interface are:
R fq_flows_cnt 4096
R fq_backlog 0
R fq_overlimit 0
R fq_overmemory 0
R fq_collisions 152114
R fq_memory_usage 0
RW fq_memory_limit 16777216
RW fq_limit 8192
RW fq_quantum 300
Which funny enough clash with your opinion of the right sizes.
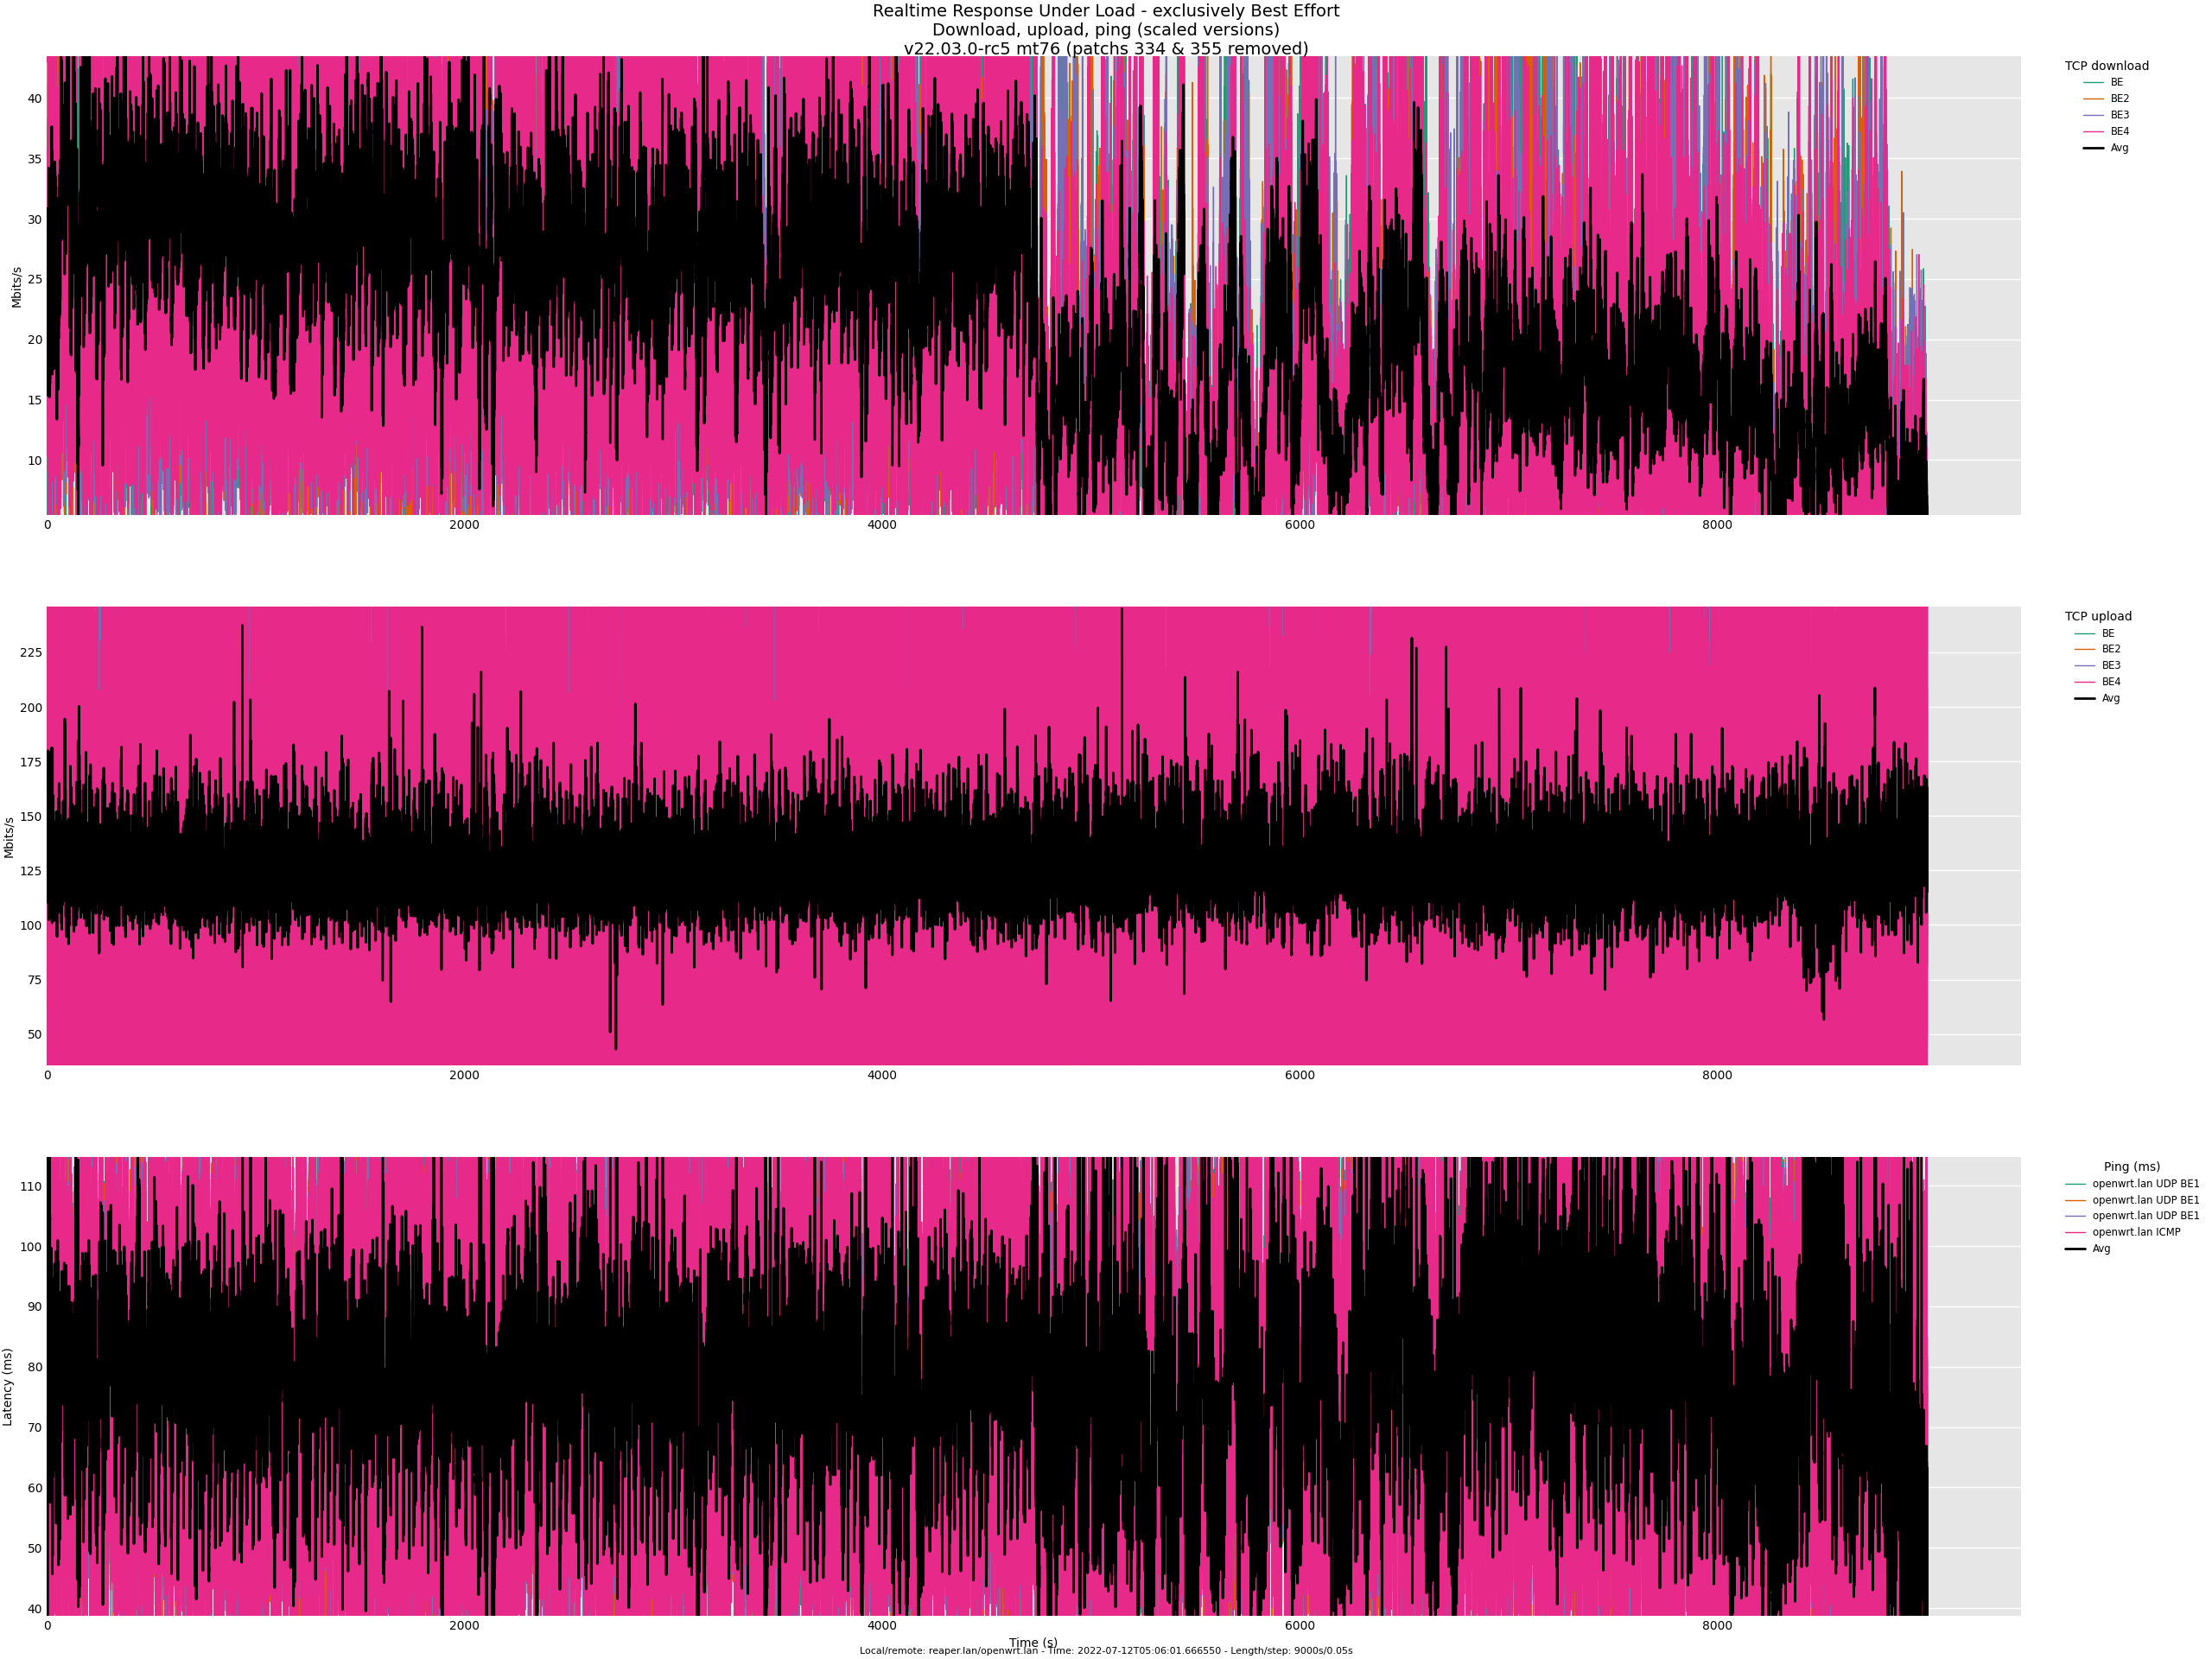
Here you go, but strange enough, this test is using v22.03.0-rc5 (minus 334 and 335 patches), something is at play here, which I'm not able to isolate:
==== SUMMARY ====
Upload capacity: 36.168 Mbps
Download capacity: 270.828 Mbps
Upload flows: 20
Download flows: 16
Responsiveness: High (3465 RPM)
Base RTT: 14
Start: 12/7/2022, 8:31:03 am
End: 12/7/2022, 8:31:18 am
OS Version: Version 12.4 (Build 21F79)
BTW, always using same box, not moving it between runs.
Following a 2.5-hour test run on v22.03.0-rc5 (mt76 with no 334 and 335 patches):