Because with them, pinging the router goes up to 2,000 ms every 10 seconds, packets even get lost. After removing them, as per your suggestion to test, things are much much better.
1 Like
Out of time today.
Agree that green BE should not be hogging. Is GSO/GRO in use?
Massively agree that ATF and per station queueing are important to test next.
Delighted we aren't crashing.
Disturbed at 60ms induced latency on the intel implementation. Should be around 40. 6 year old Food for thought:
@nbd you have done a massive amount of work on rate control in the last decade. Several of the results on this thread looks more like a rate control issue. To what extent is anything I used to semi-understand in charge of rate control on the iwl, the mt76, the ath10k, 11k, 9k?
2 Likes
I don't have such problem running 22.03.0 RC5.
PING 192.168.1.1 (192.168.1.1) 56(84) bytes of data.
64 bytes from 192.168.1.1: icmp_seq=1 ttl=64 time=5.09 ms
64 bytes from 192.168.1.1: icmp_seq=2 ttl=64 time=3.98 ms
64 bytes from 192.168.1.1: icmp_seq=3 ttl=64 time=5.20 ms
64 bytes from 192.168.1.1: icmp_seq=4 ttl=64 time=3.83 ms
64 bytes from 192.168.1.1: icmp_seq=5 ttl=64 time=3.03 ms
64 bytes from 192.168.1.1: icmp_seq=6 ttl=64 time=3.45 ms
64 bytes from 192.168.1.1: icmp_seq=7 ttl=64 time=3.64 ms
64 bytes from 192.168.1.1: icmp_seq=8 ttl=64 time=4.59 ms
64 bytes from 192.168.1.1: icmp_seq=9 ttl=64 time=5.24 ms
64 bytes from 192.168.1.1: icmp_seq=10 ttl=64 time=5.22 ms
64 bytes from 192.168.1.1: icmp_seq=11 ttl=64 time=6.34 ms
64 bytes from 192.168.1.1: icmp_seq=12 ttl=64 time=5.53 ms
64 bytes from 192.168.1.1: icmp_seq=13 ttl=64 time=5.19 ms
64 bytes from 192.168.1.1: icmp_seq=14 ttl=64 time=4.75 ms
64 bytes from 192.168.1.1: icmp_seq=15 ttl=64 time=4.75 ms
64 bytes from 192.168.1.1: icmp_seq=16 ttl=64 time=4.64 ms
64 bytes from 192.168.1.1: icmp_seq=17 ttl=64 time=3.65 ms
64 bytes from 192.168.1.1: icmp_seq=18 ttl=64 time=3.32 ms
64 bytes from 192.168.1.1: icmp_seq=19 ttl=64 time=4.86 ms
64 bytes from 192.168.1.1: icmp_seq=20 ttl=64 time=3.58 ms
64 bytes from 192.168.1.1: icmp_seq=21 ttl=64 time=3.55 ms
64 bytes from 192.168.1.1: icmp_seq=22 ttl=64 time=3.35 ms
64 bytes from 192.168.1.1: icmp_seq=23 ttl=64 time=5.17 ms
64 bytes from 192.168.1.1: icmp_seq=24 ttl=64 time=4.01 ms
64 bytes from 192.168.1.1: icmp_seq=25 ttl=64 time=3.08 ms
64 bytes from 192.168.1.1: icmp_seq=26 ttl=64 time=5.25 ms
64 bytes from 192.168.1.1: icmp_seq=27 ttl=64 time=4.35 ms
64 bytes from 192.168.1.1: icmp_seq=28 ttl=64 time=4.51 ms
64 bytes from 192.168.1.1: icmp_seq=29 ttl=64 time=4.23 ms
64 bytes from 192.168.1.1: icmp_seq=30 ttl=64 time=5.77 ms
64 bytes from 192.168.1.1: icmp_seq=31 ttl=64 time=3.46 ms
64 bytes from 192.168.1.1: icmp_seq=32 ttl=64 time=4.85 ms
64 bytes from 192.168.1.1: icmp_seq=33 ttl=64 time=2.10 ms
64 bytes from 192.168.1.1: icmp_seq=34 ttl=64 time=4.35 ms
64 bytes from 192.168.1.1: icmp_seq=35 ttl=64 time=3.68 ms
64 bytes from 192.168.1.1: icmp_seq=36 ttl=64 time=4.18 ms
64 bytes from 192.168.1.1: icmp_seq=37 ttl=64 time=3.87 ms
64 bytes from 192.168.1.1: icmp_seq=38 ttl=64 time=4.05 ms
64 bytes from 192.168.1.1: icmp_seq=39 ttl=64 time=3.98 ms
64 bytes from 192.168.1.1: icmp_seq=40 ttl=64 time=4.62 ms
64 bytes from 192.168.1.1: icmp_seq=41 ttl=64 time=3.41 ms
64 bytes from 192.168.1.1: icmp_seq=42 ttl=64 time=3.72 ms
64 bytes from 192.168.1.1: icmp_seq=43 ttl=64 time=1.81 ms
64 bytes from 192.168.1.1: icmp_seq=44 ttl=64 time=1.94 ms
64 bytes from 192.168.1.1: icmp_seq=45 ttl=64 time=4.02 ms
64 bytes from 192.168.1.1: icmp_seq=46 ttl=64 time=4.73 ms
64 bytes from 192.168.1.1: icmp_seq=47 ttl=64 time=3.12 ms
64 bytes from 192.168.1.1: icmp_seq=48 ttl=64 time=5.35 ms
64 bytes from 192.168.1.1: icmp_seq=49 ttl=64 time=3.25 ms
64 bytes from 192.168.1.1: icmp_seq=50 ttl=64 time=3.31 ms
64 bytes from 192.168.1.1: icmp_seq=51 ttl=64 time=2.30 ms
64 bytes from 192.168.1.1: icmp_seq=52 ttl=64 time=3.99 ms
64 bytes from 192.168.1.1: icmp_seq=53 ttl=64 time=3.90 ms
64 bytes from 192.168.1.1: icmp_seq=54 ttl=64 time=4.83 ms
64 bytes from 192.168.1.1: icmp_seq=55 ttl=64 time=2.07 ms
64 bytes from 192.168.1.1: icmp_seq=56 ttl=64 time=2.81 ms
64 bytes from 192.168.1.1: icmp_seq=57 ttl=64 time=1.81 ms
64 bytes from 192.168.1.1: icmp_seq=58 ttl=64 time=3.64 ms
64 bytes from 192.168.1.1: icmp_seq=59 ttl=64 time=5.06 ms
64 bytes from 192.168.1.1: icmp_seq=60 ttl=64 time=3.63 ms
64 bytes from 192.168.1.1: icmp_seq=61 ttl=64 time=3.67 ms
64 bytes from 192.168.1.1: icmp_seq=62 ttl=64 time=4.64 ms
64 bytes from 192.168.1.1: icmp_seq=63 ttl=64 time=3.89 ms
64 bytes from 192.168.1.1: icmp_seq=64 ttl=64 time=3.28 ms
64 bytes from 192.168.1.1: icmp_seq=65 ttl=64 time=3.83 ms
64 bytes from 192.168.1.1: icmp_seq=66 ttl=64 time=3.92 ms
64 bytes from 192.168.1.1: icmp_seq=67 ttl=64 time=3.78 ms
64 bytes from 192.168.1.1: icmp_seq=68 ttl=64 time=4.87 ms
64 bytes from 192.168.1.1: icmp_seq=69 ttl=64 time=4.24 ms
64 bytes from 192.168.1.1: icmp_seq=70 ttl=64 time=4.35 ms
64 bytes from 192.168.1.1: icmp_seq=71 ttl=64 time=3.85 ms
64 bytes from 192.168.1.1: icmp_seq=72 ttl=64 time=4.88 ms
64 bytes from 192.168.1.1: icmp_seq=73 ttl=64 time=3.50 ms
64 bytes from 192.168.1.1: icmp_seq=74 ttl=64 time=3.49 ms
64 bytes from 192.168.1.1: icmp_seq=75 ttl=64 time=4.01 ms
64 bytes from 192.168.1.1: icmp_seq=76 ttl=64 time=4.33 ms
64 bytes from 192.168.1.1: icmp_seq=77 ttl=64 time=3.67 ms
64 bytes from 192.168.1.1: icmp_seq=78 ttl=64 time=3.93 ms
64 bytes from 192.168.1.1: icmp_seq=79 ttl=64 time=4.29 ms
64 bytes from 192.168.1.1: icmp_seq=80 ttl=64 time=4.06 ms
64 bytes from 192.168.1.1: icmp_seq=81 ttl=64 time=4.06 ms
64 bytes from 192.168.1.1: icmp_seq=82 ttl=64 time=4.89 ms
64 bytes from 192.168.1.1: icmp_seq=83 ttl=64 time=3.93 ms
64 bytes from 192.168.1.1: icmp_seq=84 ttl=64 time=1.57 ms
64 bytes from 192.168.1.1: icmp_seq=85 ttl=64 time=4.24 ms
64 bytes from 192.168.1.1: icmp_seq=86 ttl=64 time=4.73 ms
64 bytes from 192.168.1.1: icmp_seq=87 ttl=64 time=2.48 ms
64 bytes from 192.168.1.1: icmp_seq=88 ttl=64 time=4.01 ms
64 bytes from 192.168.1.1: icmp_seq=89 ttl=64 time=3.91 ms
64 bytes from 192.168.1.1: icmp_seq=90 ttl=64 time=5.84 ms
I was not aware that fq_codel's quantum was set to 300 in a distributors release.
Is it on a mt76 or ath10k? Important difference, I'm using this thread because all the testing, but I am NOT running ath10k.
I read long ago your recommendation to set it to 300 if connection is lower than 40 Mbps, otherwise 1514, right? Shall we bring it back to 1514? WiFi 5 and 6 are clearly over 40 Mpbs.
My computer is finalising a run of 2.5 hours rrull_be test, sorry it couldn't be all night.
Found something, kinda funny:
Top Level Statistics
● root@nemesis:/sys/kernel/debug/ieee80211/phy0# cat aqm
access name value
R fq_flows_cnt 4096
R fq_backlog 0
R fq_overlimit 0
R fq_overmemory 0
R fq_collisions 14
R fq_memory_usage 0
RW fq_memory_limit 4194304 # 4MB on 802.11n per device not SSID
RW fq_limit 2048 # packet limit IMHO too high by default
RW fq_quantum 1514 # 300 currently by default, no...
The above comes from an slide deck, and I reckon it's yours, @dtaht. So, our (my) current parameters on an 802.11ac interface are:
R fq_flows_cnt 4096
R fq_backlog 0
R fq_overlimit 0
R fq_overmemory 0
R fq_collisions 152114
R fq_memory_usage 0
RW fq_memory_limit 16777216
RW fq_limit 8192
RW fq_quantum 300
Which funny enough clash with your opinion of the right sizes. ![]()
Here you go, but strange enough, this test is using v22.03.0-rc5 (minus 334 and 335 patches), something is at play here, which I'm not able to isolate:
==== SUMMARY ====
Upload capacity: 36.168 Mbps
Download capacity: 270.828 Mbps
Upload flows: 20
Download flows: 16
Responsiveness: High (3465 RPM)
Base RTT: 14
Start: 12/7/2022, 8:31:03 am
End: 12/7/2022, 8:31:18 am
OS Version: Version 12.4 (Build 21F79)
BTW, always using same box, not moving it between runs.
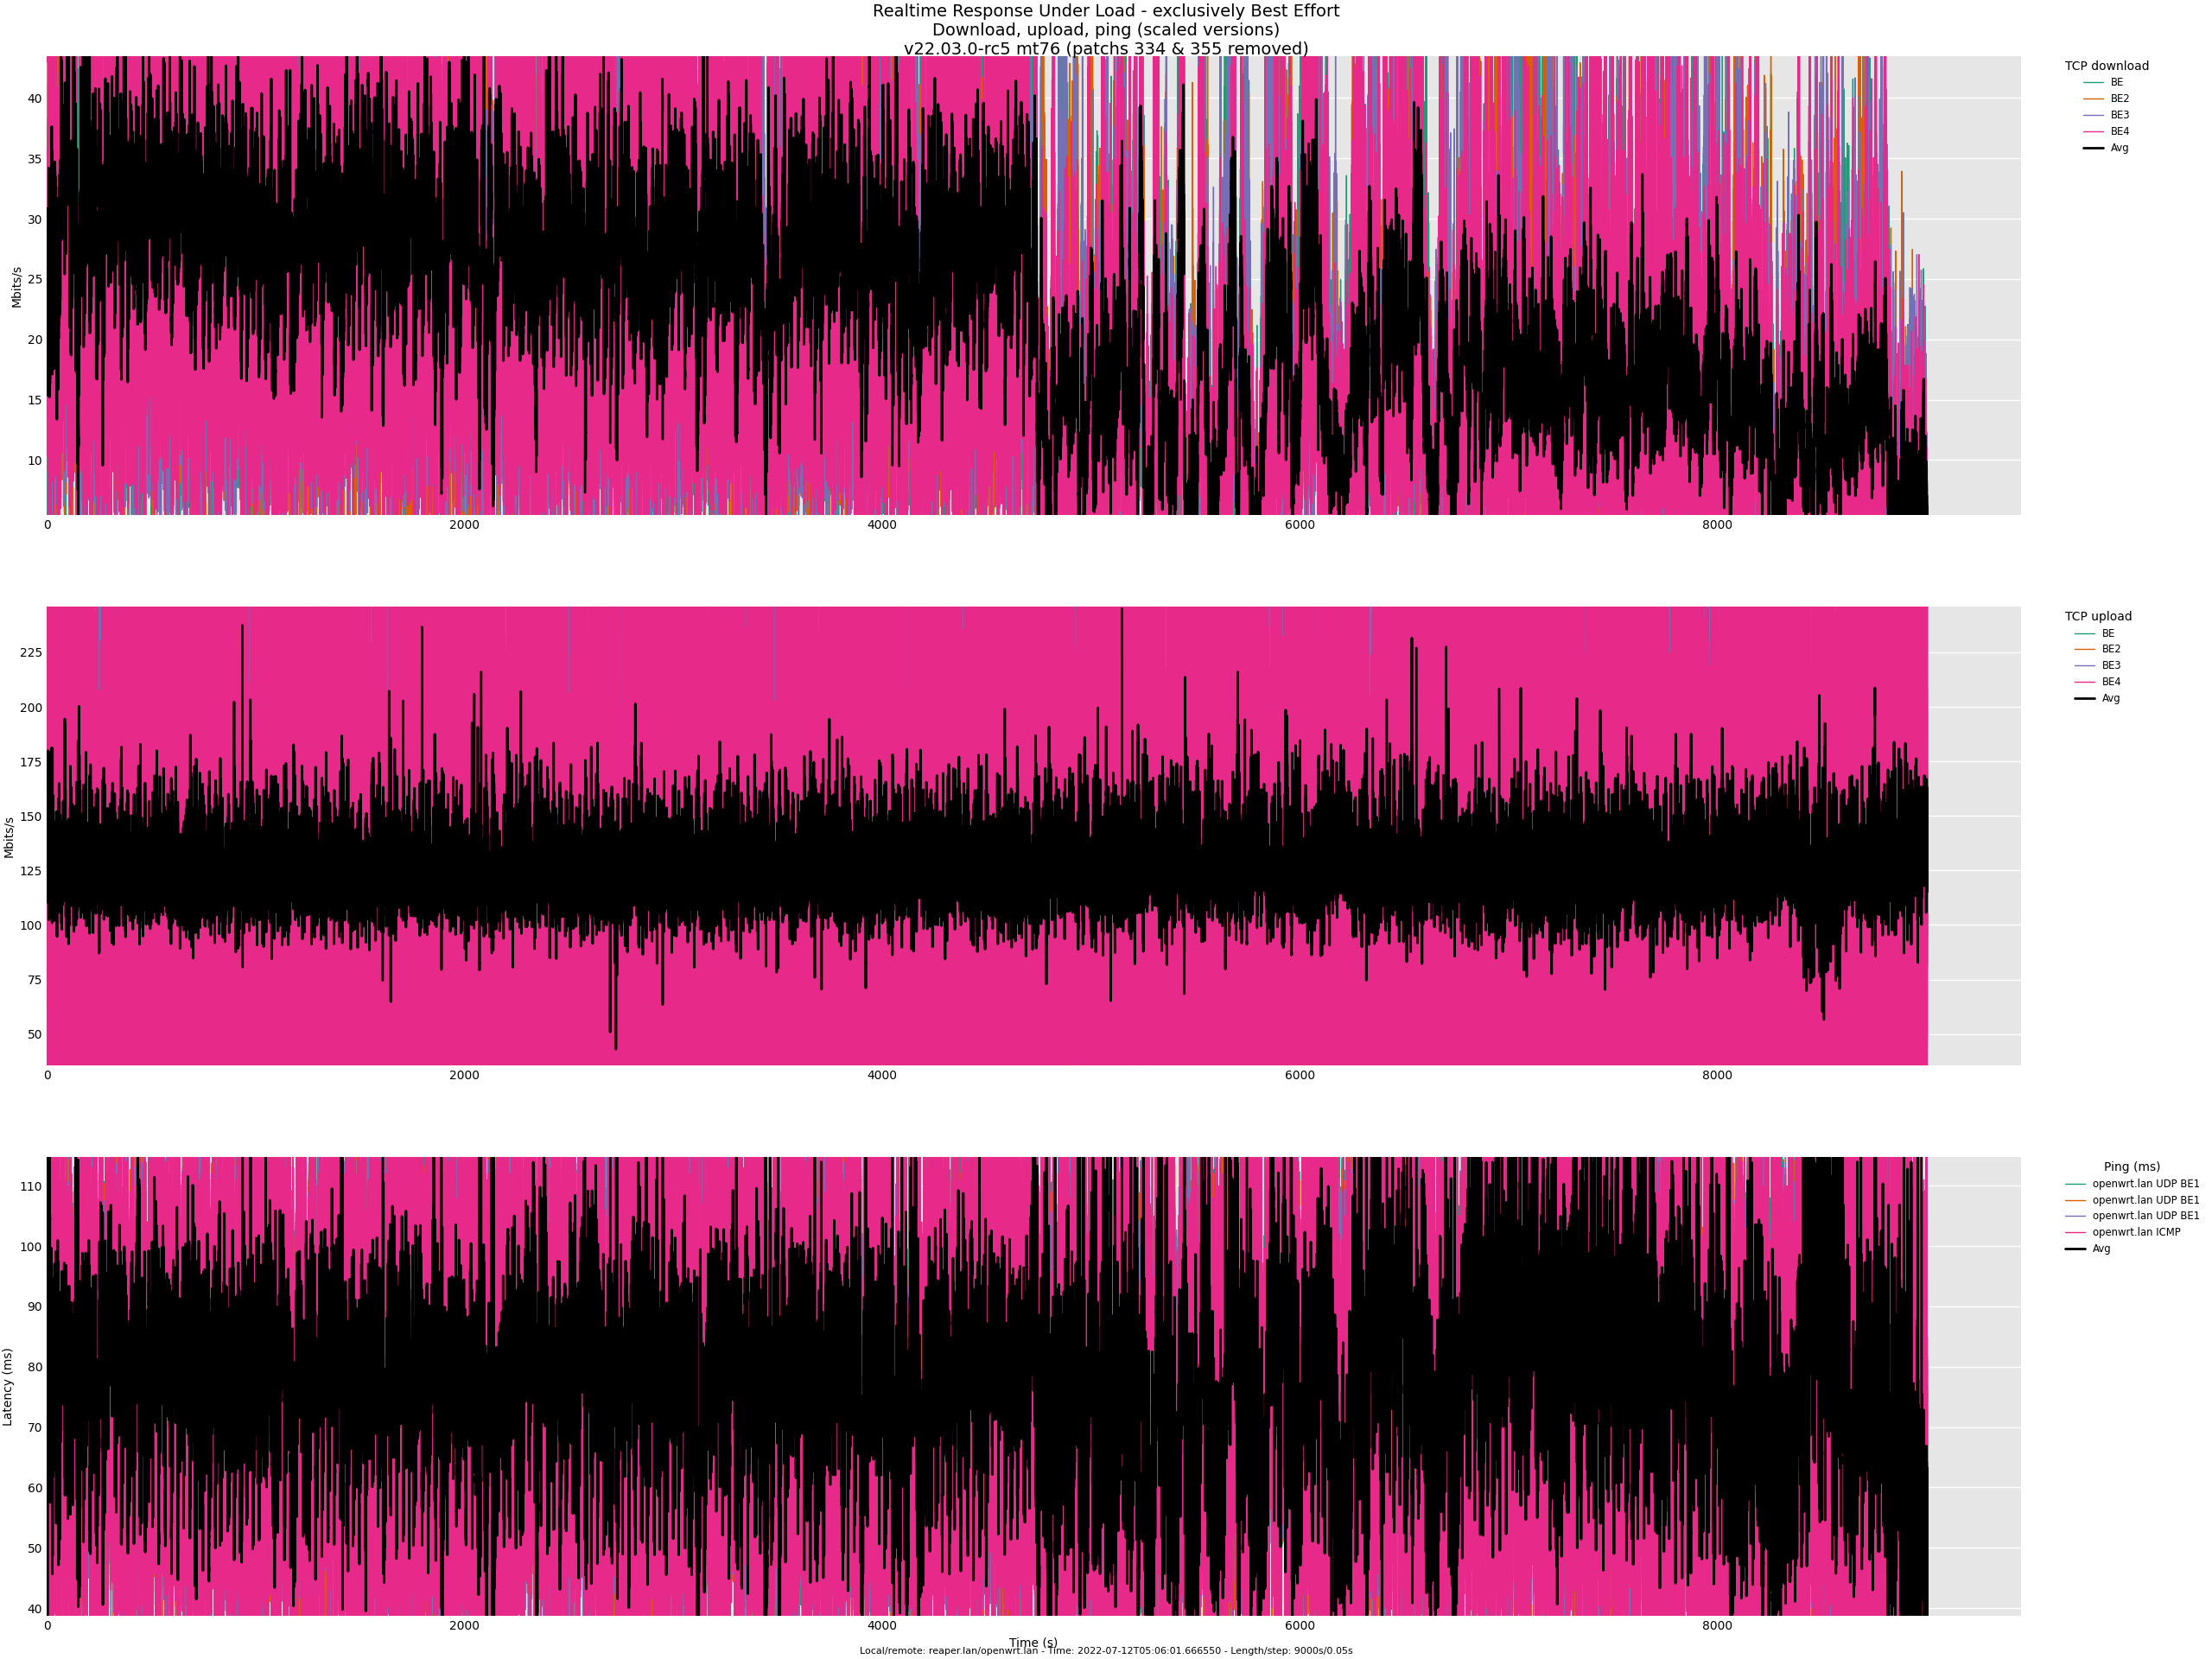
Following a 2.5-hour test run on v22.03.0-rc5 (mt76 with no 334 and 335 patches):
flent rrul_be -H openwrt.lan -l 9000 --step-size=.05
1 Like
I'm going to go all socratic, and ask, what do y'all think is happening here?
Did you verify that this is still the case after the mt76 2022-07-03 update?
@nbd, mt76 2022-07-03 update is part of v22.03.0-rc5, right? If that is the case, I just tested it 9 hours ago right before replaying to you.
Love it.
"y'all" and "here" are open for interpretation.
Regarding amteza observations, not sure. I'd have to look deeper into what the patches 334/335 do to understand why removing them seems to help them.
Regarding ameteza's most recent flent observations, I'd speculate the change about half way through is due to other client wifi activity perhaps combined my own "wag" that apple is able to do it's own thing regarding "wifi rate control."
Retesting a few times with running netserver on a box wired to the AP compared to running netserver on the AP gives ave latency ~40 ms. The AP cpu probably has trouble keeping up. Retesting with and without fq_codel and noqueue on the client wifi if makes no difference (not enough tests to be statistically significant tho).
ya, ya, ya I get it, I likely have a wifi rate control issue. Thanks for the link btw.
1 Like
Not sure if you are aware, but there is Asahi Linux which is basically a modified Arch Linux ARM that can run Bare Metal on Apple Silicon Macs. However it is considered to be Alpha quality as of July 2022. I don't have a Apple Silicon Mac to try it myself, so this is just me repeating what I read online.
Thanks, @ka2107. I'm aware of Asahi, just not willing to share my drive with it. I might have a look this weekend, though.
I will redo it, just to be sure is not an interference. I plan to stand up a new SSID only for the test and stand down current SSIDs to ensure no other device uses the AP. This will help isolate the test.
1 Like
Another quick update, last night compiled and tested r20085-7c02a4a00b (ramips/mt7621/ubnt_unifi-nanohd). Same result, massive delays going up to 2.5 seconds and ICMP packet loss. To double check fired up some SSH sessions and the lag is there every 5-10 seconds.
Update (@nbd @dtaht ): @anon11662642 sent me a PM suggesting to disable UPNP, and the high ping spikes on r20085 are gone!
2 Likes
upnp uses multicast.
mdns-scan is also a good multicast exerciser.
1 Like
By y'all I mean a group rather than a specific person.
I went socratic because I came up with 20 possible explanations of this 9000 second test in 20 minutes and I needed a day off to re-evaluate my life choices. ![]() This bug ain't putting food on the table, but I will be glad to see "my" part of openwrt be stable again. I enjoy the teaching parts A LOT - passing on life lessons like long term stress tests, sharing the mistakes I'd made 6+ years ago and documented in my blog, what the graphs might mean, how to structure tests, and applying my six sigma perspectives on testing and QA which are so woefully unfashionable nowadays. I grew up on Deming's TQM, and the later 6 sigma stuff before it became a cult, agghhhh ... anyway, thx all for adopting new tools, helping fix the tools, and testing so thoroughly!
This bug ain't putting food on the table, but I will be glad to see "my" part of openwrt be stable again. I enjoy the teaching parts A LOT - passing on life lessons like long term stress tests, sharing the mistakes I'd made 6+ years ago and documented in my blog, what the graphs might mean, how to structure tests, and applying my six sigma perspectives on testing and QA which are so woefully unfashionable nowadays. I grew up on Deming's TQM, and the later 6 sigma stuff before it became a cult, agghhhh ... anyway, thx all for adopting new tools, helping fix the tools, and testing so thoroughly!
Toke just landed this https://github.com/tohojo/flent/issues/271 can you confirm that detects "stealth mode" on osx?
From a top level perspective I'd like to find a testing house that can automate and report on how all the other wifi chipsets in openwrt are behaving with long tests like these. Every day. Back when I had my lab, I'd wake up in the morning to a test result set with an extremely small delta in patch count and while hundreds of changes to the codebase were landing still be able to meander forward.
or... Evolving a stress test suite more users could run would improve MTBF.
example: https://www.flood.io/blog/manufactured-chaos-how-netflix-does-performance-testing
Anyway... what's wrong with this 9000 second run?
- Would love it if we got a result from the ath9k, and ath10k also (and a result every night while fixes for this land: https://github.com/openwrt/mt76/issues/633 - unclear if this work is done? and entered the system? @nbd I'm under the impression mt76 2.4ghz still has power problems?)
Headaches
A) simul Uploads 4x better than downloads. Ideally they should be about the same.
B) The random falloff halfway through looks a lot like interference. However the client just kept motoring along.
C) It was the slow falloff in the last 1/4 of the plot that was genuinely odd.
As for speculating about the possible causes, I'm going to go socratic for another day. One is... heat. But a higher priority headscratcher would be why the 4x1 up/down disparity.
PS To throw a heavy multicast workload in on top of rrul, I used to use uftp, mdns-scan, an/or rtod: https://github.com/dtaht/rtod/ I enjoyed writing the README for rtod. Most of the problems I pointed out with it have not been fixed.
Watching what happened to your throughput and latency on wifi with multicast bridged to ethernet was miserable, which is why cerowrt routed and not bridged and why apple's mdns to unicast replacement daemon exists somewhere that hasn't made openwrt yet.
I hope the default in openwrt is still NOT to convert multicast to unicast?
It never occurred to me to stress test via upnp, btw, far too insecure a protocol, even though it is so widely used, or is using it on this build resetting the firewall or ... ?
2 Likes
Just to clarify the WiFi issue you described sounded familiar to me and it happens when you have UPnP enabled and that's why I suggested you try to disable it.
PS. I found this:
1 Like
Great, remove upnp and latency issues (likely related to multicast) go away.
Why does removing patches 334/335 from the ATF updates also fix this?
No one needs to attempt to explain it to me, but the why might be usefull.
I am glad there is a fix.
1 Like
Exactly what I was thinking, and why I don't see the same latency spikes on 21.02.1 even with UPNP enabled?
1 Like