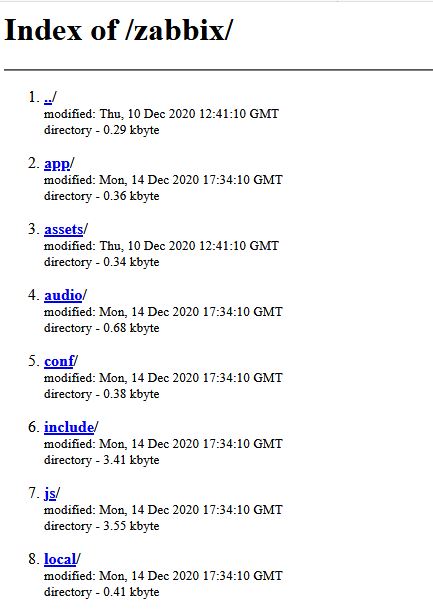
When I open the browser screen I would have expected to have a dashboard more or less similar to the one I saw on the servers and instead I find myself having a similar problem. It seems that the interface is not being interpreted correctly. Should anything else be installed? Maybe something php on the router. I had try three different browser on two PC's. Same problem both of them.
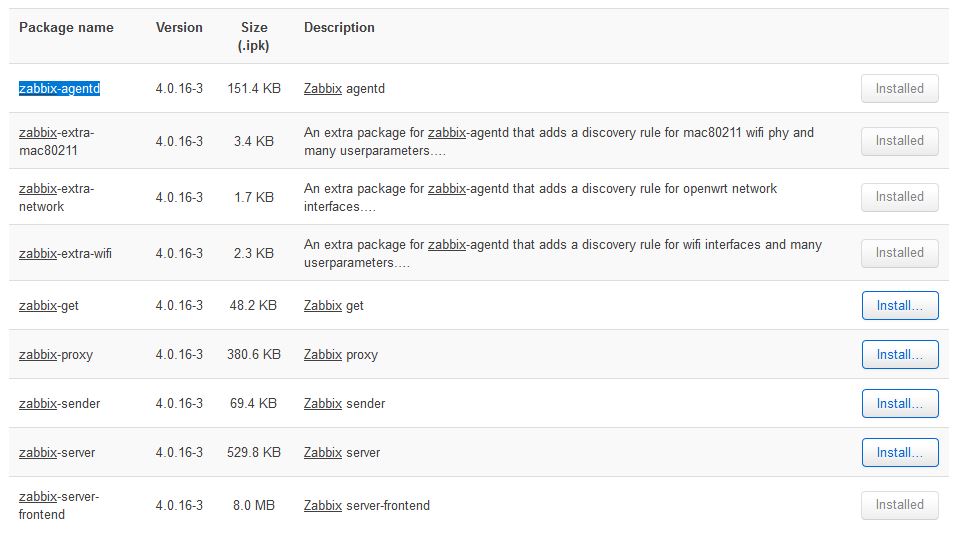
OK php and its dependencies were already installed but apache was missing. I installed it but there was probably still something missing. However the system was getting heavy and I took it off. I test the agent with an external zabbix server on VM.
Yes, zabbix service on ubuntu and connect to openwrt agent. This is what I did already.
zabbix service on openwrt MIGHT be possible, for a "large" device (32MB flash, 256MB RAM, MMC/SSD ?) , I guess, because of required DB, web server and PHP.
Can you detect abnormal traffic from connected clients(IOT) on zabbix and show the traffic details for IOT?
I don't know if this can be achieved,because I have a requirement, I need to know the IOT information and IOT traffic abnormality, and send an email to notify the user