I've been busy all weekend so I haven't been able to fiddle with flent, time is limited I'm afraid ![]()
I see you've been working with @KONG to get some decent measurements? I'll have to find some time to get flent started for the first time ![]()
-- EDIT --
@dtaht I've got flent installed on my NAS, I ran the very same commands like @KONG did first:
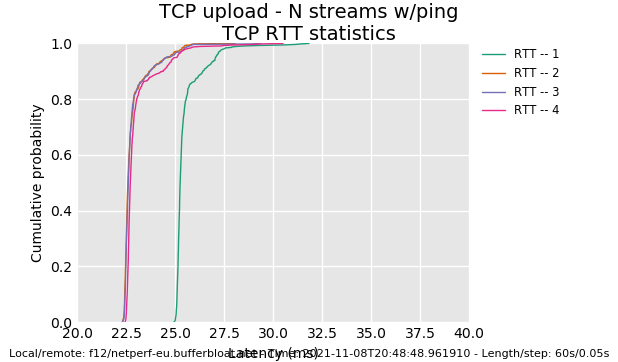
flent --step-size=.05 --socket-stats --te=upload_streams=4 tcp_nup -H netperf-eu.bufferbloat.net
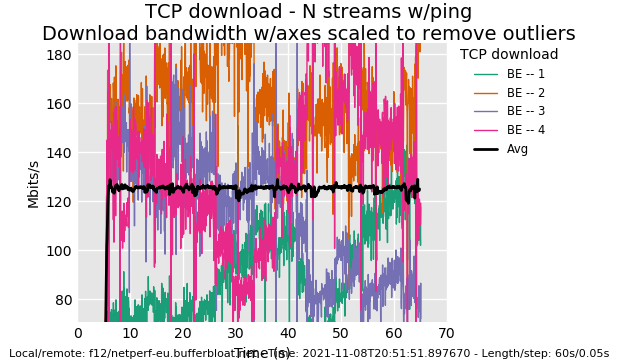
flent --step-size=.05 --socket-stats --te=download_streams=4 tcp_ndown -H netperf-eu.bufferbloat.net
Now, to be clear, this is from a NSS build without SQM enabled. So you might call this my baseline without any form of SQM.
Here are the result files:
I'm getting to know flent step by step, I see that you can create plots from the data someone else gathered by using flent. I've attached a few to this post. I can't "read" these plots like you and KONG can but I can see a very clear difference between KONG's results with SQM for NSS and mine without:
And another one:
If you guys would like to see more stuff, let me know what flent commands I need to enter and what I need to change/activate on my R7800 for NSS fq_codel.