How can I create the diagrams used in the OpenWrt wiki e.g one link below.?

1 Like
Usually the easy way is with some really expensive organisation scheme program that has these symbols integrated.
But my personal experience is after paying up a year license of 400€ that it may look good but in the end a simple PowerPoint block scheme is cheaper, easier to maintain and give more information and it works with many programs. But I am pretty sure you will go for the fancy solution anyway.
2 Likes
I just want to use something which is free and open source if that exists. How these diagrams mentioned in OpenWrt wiki and those on Wikipedia were drawn?
If there is something free, open-source and available online, it will make forum member's Jobs a lot easier to explain their OpenWrt network.
They have to answer it but it is a possibility that they have the programs available through work.
I never found it easy and fast to use these diagrams.
That is why I personally went back to standard block scheme for my network.
1 Like
For example to explain this network it is much easier to simply show the following diagram which was incomplete at the time of writing this post.

I'm a happy user of this:
1 Like
can you create the above diagram in that?
No. As the name implies it's all ASCII. But with a bit of creativity you can draw neat stuff, e.g.:
                 ┌──────────────────────────────────────────────────────────────────IPMI (apart VLAN)──────────────────────────────────────────────────────────────────────┐
                 │                                                                                                                                                         │
                 │                                                            ┌─────────────────────────────────────────────────────────┐                                  │
                 │                                                            │                                                         │                                  │
                 │  ┌──────────────────────────────────────────┐              │   ┌──────────────────────────────────────────────────┐  │                                  │
                 │  │                                          │              │   │                                                  │  │                                  │
                 │  │   MikroTik RB5009UG+S+IN (Edge router)   │              │   │               ZyXEL XGS1250-12                   │  │                                  │
                 │  │                                          │              │   │                                                  │  │                                  │
                 │  │    (1x 10G SFP+, 1x 2,5 GbE*, 7x GbE)    │              │   │       (8x GbE, 3x 10 GbE*, 1x 10 Gb SFP+)        │  │                                  │
                 │  │                                          │              │   │                                                  │  │                                  │
                 │  │     1* 2  3  4  5  6  7  8  SFP+         │              │   │  1  2  3  4  5  6    7  8  9*    10*  11*  SFP+  │  │                                  │
                 │  └────────▲──┬──▲──▲──▲──▲──▲───▲───────────┘              │   └──▲──▲──▲──▲──▲─ ▲────▲──▲──▲──────▲────▲────┬────┘  │                                  │
                 │           │  │  │  │  │  │  │   │                          │      │  │  │  │  │  │    │  │  │      │    │    │       │                                  │
                 └───────────┘  │  │  │  │  │  │   └──────────────────────────┘      │  │  │  │  │  │    │  │  │      │    │    └───────┘                                  │
                                │  │  │  │  │  │                                     │  │  │  │  │  │    │  │  │      │    │                                               │
                                │  │  │  │  │  │                                    ┌┴──┴──┴──┴──┴──┴┐ ┌─┴──┴──┴──┐   │    │                                               │
┌───────────────────┐           │  │  │  │  │  │                                    │    Bureau 2    │ │ Bureau 1 │  Failover    ┌──────────────────────────────────────┐  │
│  WAN uplink (ISP )◄───────────┘  │  │  │  │  │                                    │                │ │          │   │    │     │                                      │  │
└───────────────────┘              │  │  │  │  │                                    │     6x GbE     │ │ Ethernet │   │    │     │      Asrock Rack bestandsserver      │  │
                                   │  │  │  │  │                                    └────────────────┘ └──────────┘   │    │     │                                      │  │
                                   │  │  │  │  │                                                                      │    └─────┤ 10 GbE      (2x GbE standaard   IPMI ├──┘
                                   │  │  │  │  │                                                                      │          │              niet ingeplugd)         │
                                   │  │  │  │  │                                                                      └──────────┤ 10 GbE                               │
                                   │  │  │  │  │                                                                                 │              1 GbE  1 GbE            │
                                   │  │  │  │  │                                                                                 └──────────────────────────────────────┘
                                   │  │  │  │  │
                                   │  │  │  │  │
                                   │  │  │  │  │
                                   │  │  │  │  │
                                   │  │  │  │  │                                                 ┌────────────────────────────┐
                                   │  │  │  │  │                                                 │                            │
                                   │  │  │  │  │                                                 │   ZyXEL GS1900-8HP PoE+    │
                                   │  │  │  │  │                                                 │                            │
                                   │  │  │  │  │                                                 │   1  2  3  4  5  6  7  8   │
                                   │  │  │  │  │                                                 └───┬──┬──▲──▲──▲────────────┘
                   ┌───────────┐   │  │  │  │  │                                                     │  │  │  │  │
                   │           │   │  │  │  │  └─────────────────────────────────────────────────────┘  │  │  │  │
                   │  Plotter  ├───┘  │  │  │        Link aggregation voor 2 Gbps uplink?               │  │  │  │
                   │           │      │  │  └───────────────────────────────────────────────────────────┘  │  │  └─────────────────────────────┐
                   └───────────┘      │  │                                                                 │  │                                │
                                      │  │                                                                 │  └──────────────┐                 │
                                      │  │   ┌────────────────────────────┐                                │                 │                 │
                      ┌───────────┐   │  │   │                            │                        ┌───────┴───────┐ ┌───────┴───────┐  ┌──────┴────────┐
                      │           │   │  │   │  Dell Optiplex 3020 Micro  │                        │               │ │               │  │               │
                      │  Printer  ├───┘  └───┤                            │                        │ EAP615-Wall 1 │ │ EAP615-Wall 2 │  │ EAP615-Wall 3 │
                      │           │          │   Backup bestandsserver    │                        │               │ │               │  │               │
                      └───────────┘          │                            │                        │   Bureau 1    │ │   Bureau 2    │  │  Lunchruimte  │
                                             └────────────────────────────┘                        └───────────────┘ └───────────────┘  └───────────────┘
2 Likes
kivio/ koffice (now calligra) wasn't too bad either, but a consistent symbol set is a (one of many) weak point; I usually shuffle between libreoffice draw and kivio for different parts of a diagram.
...but, both pen(cil) and paper and simple ASCII graphics tend to provide reasonable results much quicker.
1 Like
how about draw.io?
8 Likes
Would LibreOffice Draw do this for you? Its similar to MS Visio...
1 Like
seems to do the trick. Will investigate further
Cisco Packet Tracer is FREE, you just need to create an acount.
there is also something free from Huawei : http://www.techspacekh.com/huawei-network-device-simulation-with-ensp/
search google for : Huawei eNSP
Both can be used to draw some network pictures, but also to simulate and validate the functioning
I did download the cisco packet tracer, but it requires booking a course.
@atux_null for the win. Follow the help section to find the Help About 20.0.4; follow that to GitHubs Release.
Download the no-installer and double click > Select Templet > Have fun.

2 Likes
For an Open Source standalone app, Libreoffice Draw can be used for this if you don't mind a little effort.
you are wrong, you only need an account and it's free.
It didn't allow me to run without a course.
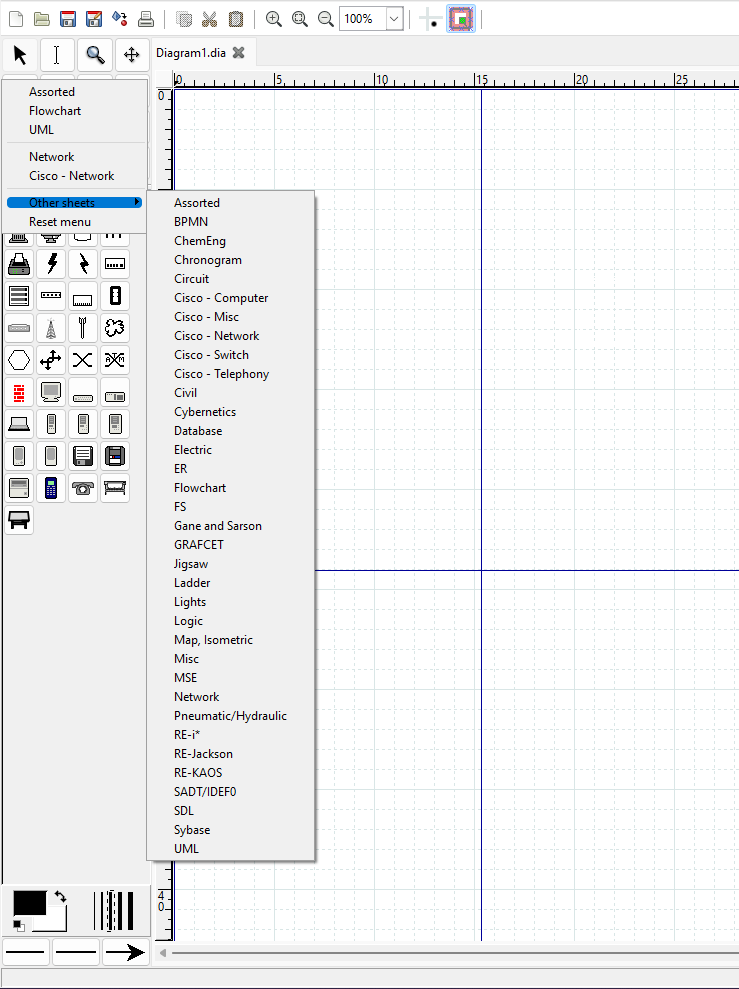
You can do nice things with Dia Dia Diagram Editor. It is GPL software running on linux and windows.

1 Like