So one more thing to do, surf to https://www.thinkbroadband.com , reguster for free and set up their broadband quality monitoring tool to your fixed IPv4. This will constantly monitor latency between the thinkbroadband measurement platform in London and your link (make sure your router respondes to ICMP echo requests or pings). You will then be able to see a plot like this for the last running 60 days IIRC:
https://www.thinkbroadband.com/broadband/monitoring/quality/share/d559d014c2c685dc301f5e74a4537d31adcad6ca-17-01-2022 [url=https://www.thinkbroadband.com/broadband/monitoring/quality/share/d559d014c2c685dc301f5e74a4537d31adcad6ca-17-01-2022]
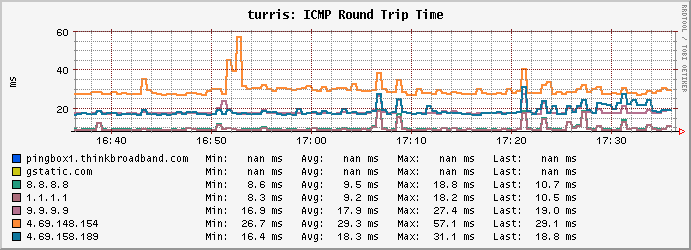
which might help documenting spurious latency excursions. The ping packets will come from pingbox1.thinkbroadband.com an address you can also use in your OpenWrt router's statistics -> network plugins -> ping to measure pings against that reflector, you can actually add a few more ping targets there and you will get constantly updated RTT plots like:
which can also help in documenting RTT excursions, if you ad multiple ping targets you can figure out easier whether spike only affect a single target or affect all (which implicates that the delay occurred on the shared path). And once you find pingable IP addresses close to the game servers you can configure the ping plugin to monitor these as well for documentation purposes.
Neither of these two things will fix your issue, but both might help in diagnosing it.
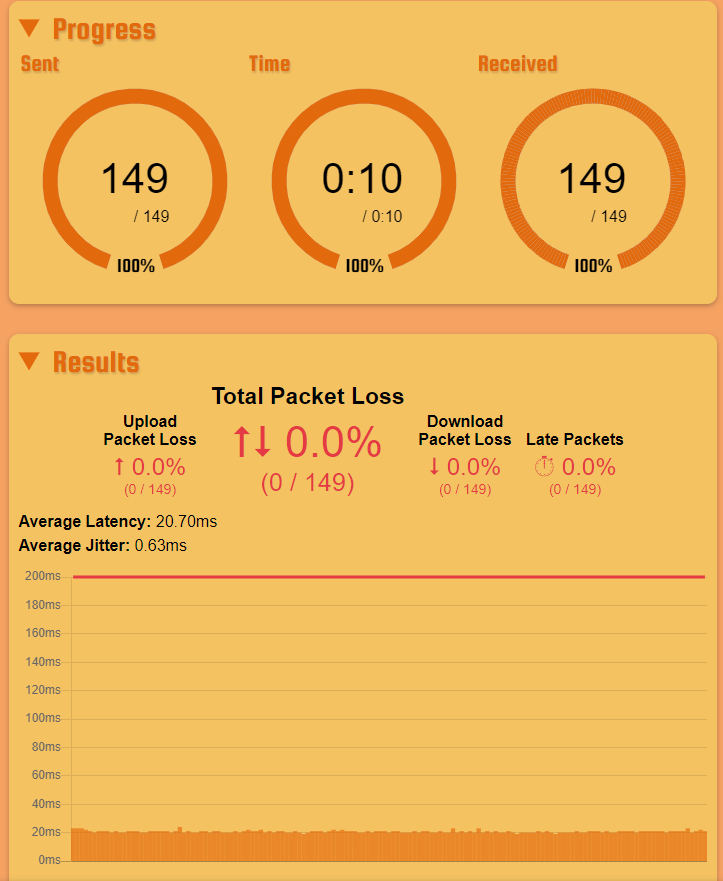
I note @dtaht just posted a link to https://packetlosstest.com which allows to measure and graph up to 180 seconds of isochronous small packet trains, similar to what happens in some games, this might be a helpful tool for the OP (just make sure to save the CSV files for post-game analysis and save a screenshot).
Yes, I've had him do packetlosstest.com before and it never showed any real issue, also iperf3 with a udp fixed bandwidth test didn't show an issue either.
To run that for example try the below command or you can also use different lengths of time (-t 10 for example) different ports from 9200-2940 for this server, and you can try different packet --lengths which will also change the pps rate to keep the bitrate constant, so --length 300 or --length 400 will send bigger packets but less often, or change the -b to be somewhat higher, for example 800K or 1500K to emulate moderate video rates https://iperf.fr/iperf-servers.php shows other servers
$ iperf3 -u -b 300K --pacing-timer 200 -t 30 -p 9211 --length 250 -c iperf.par2.as49434.net
which shows for me (across the atlantic no less)
Connecting to host iperf.par2.as49434.net, port 9211
[  5] local 2600:1700:4810:877f:0:55:ffaa:13 port 33914 connected to 2a0f:9240:1018::2 port 9211
[ ID] Interval           Transfer     Bitrate         Total Datagrams
[  5]   0.00-1.00   sec  36.6 KBytes   300 Kbits/sec  150
[  5]   1.00-2.00   sec  36.6 KBytes   300 Kbits/sec  150
[  5]   2.00-3.00   sec  36.6 KBytes   300 Kbits/sec  150
[  5]   3.00-4.00   sec  36.6 KBytes   300 Kbits/sec  150
[  5]   4.00-5.00   sec  36.6 KBytes   300 Kbits/sec  150
[  5]   5.00-6.00   sec  36.6 KBytes   300 Kbits/sec  150
[  5]   6.00-7.00   sec  36.6 KBytes   300 Kbits/sec  150
[  5]   7.00-8.00   sec  36.6 KBytes   300 Kbits/sec  150
^C[  5]   8.00-8.04   sec  1.71 KBytes   328 Kbits/sec  7
- - - - - - - - - - - - - - - - - - - - - - - - -
[ ID] Interval           Transfer     Bitrate         Jitter    Lost/Total Datagrams
[  5]   0.00-8.04   sec   295 KBytes   300 Kbits/sec  0.000 ms  0/1207 (0%)  sender
[  5]   0.00-8.04   sec  0.00 Bytes  0.00 bits/sec  0.000 ms  0/0 (0%)  receiver
I'm not sure how I can possibly have 0.000 ms jitter, I guess that it has 1ms granularity and that the jitter is always much less than 1ms?
when I let the test run the full 30 seconds and exit without breaking, I get a more reasonable jitter calculation:
[  5]  29.00-30.00  sec  36.6 KBytes   300 Kbits/sec  150
- - - - - - - - - - - - - - - - - - - - - - - - -
[ ID] Interval           Transfer     Bitrate         Jitter    Lost/Total Datagrams
[  5]   0.00-30.00  sec  1.07 MBytes   300 Kbits/sec  0.000 ms  0/4500 (0%)  sender
[  5]   0.00-30.14  sec  1.07 MBytes   299 Kbits/sec  0.162 ms  0/4500 (0%)  receiver
Great idea, I was attracted to packetlosstest since it seems relatively easy to set up and run (and that it directly produces interpretable delay graphs), which certainly helps in debugging sessions that cross language barriers (I wish my french was better....)
My general problem with iperf3 (and that might have gotten better) was finding servers willing to respond at all and especially with fancier options. (Sidenote: finding netperf servers to use with flent is much harder still)
Reverse:
user@1234-12345:~/SCRATCH$ iperf3 -u -b 300K --pacing-timer 200 -t 30 -p 9211 --length 250 -c iperf.par2.as49434.net -R
Connecting to host iperf.par2.as49434.net, port 9211
Reverse mode, remote host iperf.par2.as49434.net is sending
[  7] local 2a01:c22:916b:7400:ecb9:81d6:531a:b07c port 58959 connected to 2a0f:9240:1018::2 port 9211
[ ID] Interval           Transfer     Bitrate         Jitter    Lost/Total Datagrams
[  7]   0.00-1.00   sec  36.6 KBytes   300 Kbits/sec  8705.529 ms  0/150 (0%)
[  7]   1.00-2.00   sec  36.9 KBytes   302 Kbits/sec  0.679 ms  0/151 (0%)
[  7]   2.00-3.00   sec  36.4 KBytes   298 Kbits/sec  0.127 ms  0/149 (0%)
[  7]   3.00-4.00   sec  36.9 KBytes   302 Kbits/sec  0.136 ms  0/151 (0%)
[  7]   4.00-5.00   sec  36.4 KBytes   298 Kbits/sec  0.111 ms  0/149 (0%)
[  7]   5.00-6.00   sec  36.9 KBytes   302 Kbits/sec  0.153 ms  0/151 (0%)
[  7]   6.00-7.00   sec  36.4 KBytes   298 Kbits/sec  0.118 ms  0/149 (0%)
[  7]   7.00-8.00   sec  36.6 KBytes   300 Kbits/sec  0.107 ms  0/150 (0%)
[  7]   8.00-9.00   sec  36.9 KBytes   302 Kbits/sec  0.135 ms  0/151 (0%)
[  7]   9.00-10.00  sec  36.6 KBytes   300 Kbits/sec  0.114 ms  0/150 (0%)
[  7]  10.00-11.00  sec  36.6 KBytes   300 Kbits/sec  0.126 ms  0/150 (0%)
[  7]  11.00-12.00  sec  36.6 KBytes   300 Kbits/sec  0.142 ms  0/150 (0%)
[  7]  12.00-13.00  sec  36.6 KBytes   300 Kbits/sec  0.155 ms  0/150 (0%)
[  7]  13.00-14.00  sec  36.6 KBytes   300 Kbits/sec  0.173 ms  0/150 (0%)
[  7]  14.00-15.00  sec  36.6 KBytes   300 Kbits/sec  0.153 ms  0/150 (0%)
[  7]  15.00-16.00  sec  36.6 KBytes   300 Kbits/sec  0.141 ms  0/150 (0%)
[  7]  16.00-17.00  sec  36.6 KBytes   300 Kbits/sec  0.160 ms  0/150 (0%)
[  7]  17.00-18.00  sec  36.6 KBytes   300 Kbits/sec  0.139 ms  0/150 (0%)
[  7]  18.00-19.00  sec  36.6 KBytes   300 Kbits/sec  0.141 ms  0/150 (0%)
[  7]  19.00-20.00  sec  36.6 KBytes   300 Kbits/sec  0.114 ms  0/150 (0%)
[  7]  20.00-21.00  sec  36.6 KBytes   300 Kbits/sec  0.166 ms  0/150 (0%)
[  7]  21.00-22.00  sec  36.6 KBytes   300 Kbits/sec  0.116 ms  0/150 (0%)
[  7]  22.00-23.00  sec  36.6 KBytes   300 Kbits/sec  0.123 ms  0/150 (0%)
[  7]  23.00-24.00  sec  36.6 KBytes   300 Kbits/sec  0.099 ms  0/150 (0%)
[  7]  24.00-25.00  sec  36.6 KBytes   300 Kbits/sec  0.171 ms  0/150 (0%)
[  7]  25.00-26.00  sec  36.6 KBytes   300 Kbits/sec  0.142 ms  0/150 (0%)
[  7]  26.00-27.00  sec  36.6 KBytes   300 Kbits/sec  0.136 ms  0/150 (0%)
[  7]  27.00-28.00  sec  36.6 KBytes   300 Kbits/sec  0.101 ms  0/150 (0%)
[  7]  28.00-29.00  sec  36.6 KBytes   300 Kbits/sec  0.122 ms  0/150 (0%)
[  7]  29.00-30.00  sec  36.6 KBytes   300 Kbits/sec  0.113 ms  0/150 (0%)
- - - - - - - - - - - - - - - - - - - - - - - - -
[ ID] Interval           Transfer     Bitrate         Jitter    Lost/Total Datagrams
[  7]   0.00-30.03  sec  1.07 MBytes   300 Kbits/sec  0.000 ms  0/4505 (0%)  sender
[  7]   0.00-30.00  sec  1.07 MBytes   300 Kbits/sec  0.113 ms  0/4501 (0%)  receiver
Forward:
user@1234-12345:~/SCRATCH$ iperf3 -u -b 300K --pacing-timer 200 -t 30 -p 9211 --length 250 -c iperf.par2.as49434.net
Connecting to host iperf.par2.as49434.net, port 9211
[  7] local 2a01:c22:916b:7400:ecb9:81d6:531a:b07c port 32912 connected to 2a0f:9240:1018::2 port 9211
[ ID] Interval           Transfer     Bitrate         Total Datagrams
[  7]   0.00-1.00   sec  36.6 KBytes   300 Kbits/sec  150
[  7]   1.00-2.00   sec  36.6 KBytes   300 Kbits/sec  150
[  7]   2.00-3.00   sec  36.6 KBytes   300 Kbits/sec  150
[  7]   3.00-4.00   sec  36.6 KBytes   300 Kbits/sec  150
[  7]   4.00-5.00   sec  36.6 KBytes   300 Kbits/sec  150
[  7]   5.00-6.00   sec  36.6 KBytes   300 Kbits/sec  150
[  7]   6.00-7.00   sec  36.6 KBytes   300 Kbits/sec  150
[  7]   7.00-8.00   sec  36.6 KBytes   300 Kbits/sec  150
[  7]   8.00-9.00   sec  36.6 KBytes   300 Kbits/sec  150
[  7]   9.00-10.00  sec  36.6 KBytes   300 Kbits/sec  150
[  7]  10.00-11.00  sec  36.6 KBytes   300 Kbits/sec  150
[  7]  11.00-12.00  sec  36.6 KBytes   300 Kbits/sec  150
[  7]  12.00-13.00  sec  36.6 KBytes   300 Kbits/sec  150
[  7]  13.00-14.00  sec  36.6 KBytes   300 Kbits/sec  150
[  7]  14.00-15.00  sec  36.6 KBytes   300 Kbits/sec  150
[  7]  15.00-16.00  sec  36.6 KBytes   300 Kbits/sec  150
[  7]  16.00-17.00  sec  36.6 KBytes   300 Kbits/sec  150
[  7]  17.00-18.00  sec  36.6 KBytes   300 Kbits/sec  150
[  7]  18.00-19.00  sec  36.6 KBytes   300 Kbits/sec  150
[  7]  19.00-20.00  sec  36.6 KBytes   300 Kbits/sec  150
[  7]  20.00-21.00  sec  36.6 KBytes   300 Kbits/sec  150
[  7]  21.00-22.00  sec  36.6 KBytes   300 Kbits/sec  150
[  7]  22.00-23.00  sec  36.6 KBytes   300 Kbits/sec  150
[  7]  23.00-24.00  sec  36.6 KBytes   300 Kbits/sec  150
[  7]  24.00-25.00  sec  36.6 KBytes   300 Kbits/sec  150
[  7]  25.00-26.00  sec  36.6 KBytes   300 Kbits/sec  150
[  7]  26.00-27.00  sec  36.6 KBytes   300 Kbits/sec  150
[  7]  27.00-28.00  sec  36.6 KBytes   300 Kbits/sec  150
[  7]  28.00-29.00  sec  36.6 KBytes   300 Kbits/sec  150
[  7]  29.00-30.00  sec  36.6 KBytes   300 Kbits/sec  150
- - - - - - - - - - - - - - - - - - - - - - - - -
[ ID] Interval           Transfer     Bitrate         Jitter    Lost/Total Datagrams
[  7]   0.00-30.00  sec  1.07 MBytes   300 Kbits/sec  0.000 ms  0/4500 (0%)  sender
[  7]   0.00-30.03  sec  1.07 MBytes   300 Kbits/sec  0.165 ms  0/4500 (0%)  receiver
Still I guess, easier to see individual outliers on a plot.
Agreed it would be great to see all these tests from his connection... And while SQM is set to say 10Mbps both directions, so that we know the local bufferbloat is probably well controlled.
packetlosstest.com iperf3 test as above
mtr to the game server for 5 minute run
Subjective assessment "how well does the game do" at the same approximate time the above are being run
@segal_72 if you can provide those tests it would be very helpful
All of this is great.
I would also really like to see a reverse MTR from close to one of the affected servers. But for that we first need to find a responding game server (or a responder close by)....
And it would be great if you could remind us which game(s) you actually are having problems with?
address easo.ea.com is a server for diagnostic purposes it is not a game server.
here I am.. I've never had such a long day.. I'm very excited to see the range of tests to be carried out.. what do I start with and in what condition?
Agreed it would be great to see all these tests from his connection... And while SQM is set to say 10Mbps both directions, so that we know the local bufferbloat is probably well controlled.
packetlosstest.com
iperf3 test as above
mtr to the game server for 5 minute run
Subjective assessment "how well does the game do" at the same approximate time the above are being run
@segal_72 if you can provide those tests it would be very helpful
Set up SQM with 10Mbps each way, and run those tests, see last 4-5 posts for the iperf3 command
Yes, but since it is located in the US it seems not to be relevant for your problem, UNLESS the game servers you typically play at are also located in the U.S.. It is fine for EA to pointto that server, but for our purposes it is not that helpful, I assume.
By now there are multiple lists and proposals what to do, which means you can pick and choose
But really, please tell us in addition to @dlakelan 's recent questions:
A) Which game(s) do you see the problems with
B) What RTT do these games report
C) What are IP addresses of servers involved in those games (you might need to play a bit and collect a packet capture and then look inside that capture to get candidate IP addresses).
Because I really really want to see forward and reverse path information from you to the servers and back again.
No. download streams:
8
 (1-32)
No. upload streams:
8
 (1-32)

Hi-Res BufferBloat:	 yes

Upload duration:
30
s
Download duration:
30
 -----------------------------------------------------
 OpenWrt SNAPSHOT, r18541-7f2052ef22
 -----------------------------------------------------
root@OpenWrt:~# tc -s qdisc
qdisc noqueue 0: dev lo root refcnt 2
 Sent 0 bytes 0 pkt (dropped 0, overlimits 0 requeues 0)
 backlog 0b 0p requeues 0
qdisc fq_codel 0: dev eth0 root refcnt 2 limit 10240p flows 1024 quantum 1518 ta                                                                                                                                                             rget 5ms interval 100ms memory_limit 4Mb ecn drop_batch 64
 Sent 486323823 bytes 566981 pkt (dropped 0, overlimits 0 requeues 1)
 backlog 0b 0p requeues 1
  maxpacket 1518 drop_overlimit 0 new_flow_count 571 ecn_mark 0
  new_flows_len 0 old_flows_len 0
qdisc noqueue 0: dev lan1 root refcnt 2
 Sent 0 bytes 0 pkt (dropped 0, overlimits 0 requeues 0)
 backlog 0b 0p requeues 0
qdisc noqueue 0: dev lan2 root refcnt 2
 Sent 0 bytes 0 pkt (dropped 0, overlimits 0 requeues 0)
 backlog 0b 0p requeues 0
qdisc noqueue 0: dev lan3 root refcnt 2
 Sent 0 bytes 0 pkt (dropped 0, overlimits 0 requeues 0)
 backlog 0b 0p requeues 0
qdisc noqueue 0: dev lan4 root refcnt 2
 Sent 0 bytes 0 pkt (dropped 0, overlimits 0 requeues 0)
 backlog 0b 0p requeues 0
qdisc cake 8018: dev wan root refcnt 2 bandwidth 10Mbit besteffort triple-isolat                                                                                                                                                             e nonat nowash no-ack-filter split-gso rtt 100ms noatm overhead 44
 Sent 55034149 bytes 82479 pkt (dropped 3492, overlimits 71991 requeues 0)
 backlog 0b 0p requeues 0
 memory used: 126596b of 4Mb
 capacity estimate: 10Mbit
 min/max network layer size:           28 /    1500
 min/max overhead-adjusted size:       72 /    1544
 average network hdr offset:           14

                  Tin 0
  thresh         10Mbit
  target            5ms
  interval        100ms
  pk_delay       1.37ms
  av_delay        177us
  sp_delay         12us
  backlog            0b
  pkts            85971
  bytes        60316755
  way_inds          429
  way_miss         1833
  way_cols            0
  drops            3492
  marks               0
  ack_drop            0
  sp_flows            1
  bk_flows            1
  un_flows            0
  max_len         18168
  quantum           305

qdisc ingress ffff: dev wan parent ffff:fff1 ----------------
 Sent 98802509 bytes 101697 pkt (dropped 0, overlimits 0 requeues 0)
 backlog 0b 0p requeues 0
qdisc noqueue 0: dev br-lan root refcnt 2
 Sent 0 bytes 0 pkt (dropped 0, overlimits 0 requeues 0)
 backlog 0b 0p requeues 0
qdisc noqueue 0: dev wlan0 root refcnt 2
 Sent 0 bytes 0 pkt (dropped 0, overlimits 0 requeues 0)
 backlog 0b 0p requeues 0
qdisc noqueue 0: dev wlan1 root refcnt 2
 Sent 0 bytes 0 pkt (dropped 0, overlimits 0 requeues 0)
 backlog 0b 0p requeues 0
qdisc cake 8019: dev ifb4wan root refcnt 2 bandwidth 10Mbit besteffort triple-is                                                                                                                                                             olate nonat wash no-ack-filter split-gso rtt 100ms noatm overhead 44
 Sent 92939665 bytes 96826 pkt (dropped 4871, overlimits 126150 requeues 0)
 backlog 0b 0p requeues 0
 memory used: 433Kb of 4Mb
 capacity estimate: 10Mbit
 min/max network layer size:           46 /    1500
 min/max overhead-adjusted size:       90 /    1544
 average network hdr offset:           14

                  Tin 0
  thresh         10Mbit
  target            5ms
  interval        100ms
  pk_delay       12.9ms
  av_delay       2.98ms
  sp_delay          7us
  backlog            0b
  pkts           101697
  bytes       100303427
  way_inds            8
  way_miss         1059
  way_cols            0
  drops            4871
  marks               0
  ack_drop            0
  sp_flows            1
  bk_flows            1
  un_flows            0
  max_len          6056
  quantum           305

root@OpenWrt:~#
root@OpenWrt:~# cat /etc/config/sqm

config queue 'eth1'
        option qdisc 'cake'
        option interface 'wan'
        option debug_logging '0'
        option verbosity '5'
        option linklayer 'ethernet'
        option script 'piece_of_cake.qos'
        option overhead '44'
        option enabled '1'
        option download '10000'
        option upload '10000'

root@OpenWrt:~#
root@OpenWrt:~# iperf3 -u -b 300K --pacing-timer 200 -t 30 -p 9211 --length 250 -c iperf.par2.as49434.net -R
Connecting to host iperf.par2.as49434.net, port 9211
Reverse mode, remote host iperf.par2.as49434.net is sending
[  5] local 170.17.128.50 port 50918 connected to 193.177.162.41 port 9211
[ ID] Interval           Transfer     Bitrate         Jitter    Lost/Total Datagrams
[  5]   0.00-1.00   sec  36.9 KBytes   302 Kbits/sec  0.125 ms  0/151 (0%)
[  5]   1.00-2.00   sec  36.6 KBytes   300 Kbits/sec  0.101 ms  0/150 (0%)
[  5]   2.00-3.00   sec  36.6 KBytes   300 Kbits/sec  0.123 ms  0/150 (0%)
[  5]   3.00-4.00   sec  36.6 KBytes   300 Kbits/sec  0.125 ms  0/150 (0%)
[  5]   4.00-5.00   sec  36.6 KBytes   300 Kbits/sec  0.120 ms  0/150 (0%)
[  5]   5.00-6.00   sec  36.6 KBytes   300 Kbits/sec  0.130 ms  0/150 (0%)
[  5]   6.00-7.00   sec  36.6 KBytes   300 Kbits/sec  0.114 ms  0/150 (0%)
[  5]   7.00-8.00   sec  36.6 KBytes   300 Kbits/sec  0.130 ms  0/150 (0%)
[  5]   8.00-9.00   sec  36.6 KBytes   300 Kbits/sec  0.108 ms  0/150 (0%)
[  5]   9.00-10.00  sec  36.6 KBytes   300 Kbits/sec  0.128 ms  0/150 (0%)
[  5]  10.00-11.00  sec  36.6 KBytes   300 Kbits/sec  0.105 ms  0/150 (0%)
[  5]  11.00-12.00  sec  36.6 KBytes   300 Kbits/sec  0.124 ms  0/150 (0%)
[  5]  12.00-13.00  sec  36.6 KBytes   300 Kbits/sec  0.106 ms  0/150 (0%)
[  5]  13.00-14.00  sec  36.6 KBytes   300 Kbits/sec  0.140 ms  0/150 (0%)
[  5]  14.00-15.00  sec  36.6 KBytes   300 Kbits/sec  0.105 ms  0/150 (0%)
[  5]  15.00-16.00  sec  36.6 KBytes   300 Kbits/sec  0.111 ms  0/150 (0%)
[  5]  16.00-17.00  sec  36.6 KBytes   300 Kbits/sec  0.116 ms  0/150 (0%)
[  5]  17.00-18.00  sec  36.6 KBytes   300 Kbits/sec  0.122 ms  0/150 (0%)
[  5]  18.00-19.00  sec  36.6 KBytes   300 Kbits/sec  0.127 ms  0/150 (0%)
[  5]  19.00-20.00  sec  36.6 KBytes   300 Kbits/sec  0.128 ms  0/150 (0%)
[  5]  20.00-21.00  sec  36.6 KBytes   300 Kbits/sec  0.129 ms  0/150 (0%)
[  5]  21.00-22.00  sec  36.6 KBytes   300 Kbits/sec  0.120 ms  0/150 (0%)
[  5]  22.00-23.00  sec  36.6 KBytes   300 Kbits/sec  0.138 ms  0/150 (0%)
[  5]  23.00-24.00  sec  36.6 KBytes   300 Kbits/sec  0.131 ms  0/150 (0%)
[  5]  24.00-25.00  sec  36.6 KBytes   300 Kbits/sec  0.120 ms  0/150 (0%)
[  5]  25.00-26.00  sec  36.6 KBytes   300 Kbits/sec  0.118 ms  0/150 (0%)
[  5]  26.00-27.00  sec  36.6 KBytes   300 Kbits/sec  0.119 ms  0/150 (0%)
[  5]  27.00-28.00  sec  36.6 KBytes   300 Kbits/sec  0.112 ms  0/150 (0%)
[  5]  28.00-29.00  sec  36.6 KBytes   300 Kbits/sec  0.127 ms  0/150 (0%)
[  5]  29.00-30.00  sec  36.6 KBytes   300 Kbits/sec  0.109 ms  0/150 (0%)
- - - - - - - - - - - - - - - - - - - - - - - - -
[ ID] Interval           Transfer     Bitrate         Jitter    Lost/Total Datagrams
[  5]   0.00-30.03  sec  1.07 MBytes   300 Kbits/sec  0.000 ms  0/4505 (0%)  sender
[  5]   0.00-30.00  sec  1.07 MBytes   300 Kbits/sec  0.109 ms  0/4501 (0%)  receiver

iperf Done.
root@OpenWrt:~# mtr -ezbw -c 10  easo.ea.com
Start: 2022-01-18T01:01:15+0100
HOST: OpenWrt                                                                      Loss%   Snt   Last   Avg  Best  Wrst StDev
  1. AS3303   49.128.17.170.static.wline.lns.sme.cust.swisscom.ch (170.17.128.49)   0.0%    10    0.6   0.5   0.5   0.6   0.0
  2. AS3303   213.3.210.192 (213.3.210.192)                                         0.0%    10    5.2   5.2   5.1   5.4   0.1
  3. AS???    ???                                                                  100.0    10    0.0   0.0   0.0   0.0   0.0
  4. AS???    i69lss-015-ae1.bb.ip-plus.net (193.134.95.122)                        0.0%    10    8.4  10.5   8.0  21.4   4.3
  5. AS3303   i64bei-015-ae0.bb.ip-plus.net (138.187.129.109)                       0.0%    10   10.7  10.0   8.3  16.1   2.5
  6. AS3303   i73olt-005-ae0.bb.ip-plus.net (138.187.129.246)                       0.0%    10    8.4   9.8   8.1  20.5   3.8
  7. AS3303   i62bsg-005-ae6.bb.ip-plus.net (138.187.130.7)                         0.0%    10    8.9   9.5   8.6  14.6   1.8
  8. AS3303   i62bsw-015-ae11.bb.ip-plus.net (138.187.130.223)                      0.0%    10   10.8  10.3   8.8  16.7   2.6
  9. AS3303   i00nye-015-ae3.bb.ip-plus.net (138.187.129.53)                        0.0%    10   85.0  85.1  84.8  85.9   0.3
 10. AS3356   lag-3.ear1.NewYork6.Level3.net (4.68.38.65)                           0.0%    10   85.2  85.2  84.8  85.6   0.3
 11. AS3356   ae-2-3602.ear3.Washington1.Level3.net (4.69.206.81)                  90.0%    10   90.6  90.6  90.6  90.6   0.0
 12. AS3356   4.79.23.202 (4.79.23.202)                                             0.0%    10   91.2  91.4  91.1  91.9   0.2
 13. AS19541  159.153.92.10 (159.153.92.10)                                         0.0%    10   91.4  91.8  91.4  92.4   0.3
 14. AS19541  159.153.92.94 (159.153.92.94)                                         0.0%    10   91.4  91.7  91.3  92.9   0.4
 15. AS19541  easo.ea.com (159.153.64.173)                                          0.0%    10   91.5  91.6  91.3  92.3   0.3
root@OpenWrt:~#
1 Like
Lynx
January 18, 2022, 12:01am
73
I'm wondering about traffic shaping like I experienced with Vodafone UK and hence whether issues remain with VPN?
You can set up VPN through NordVPN for peanuts and use WireGuard and see if issues remain. You can cancel and get your money back if you're not satisfied.
The dslreports tests reports two animalities:
SERVER                                  speed       RTT/Jitter  Avg	Re-xmit Avg	Cwnd
Zurich, Switzerland, EU (iWay.ch)	d7	1.6 Mb/s	20.3±5.5ms	7.1%	     4 (SACK,SCALE, mss=1460/536 1500)
Zurich, Switzerland, EU (iWay.ch)	u59	1.61 Mb/s	9.8±4.2ms	-	        10 (SACK,SCALE, mss=1460/1460 1500)
First the high retransmit rate of 7.1%, but I fear this is a consequence of the harsh 10/10 Mbps SQQM limit we asked for, the second is the mss=1460/536 for the download server, but the 536 just seems to be the RFC compliant lowest MSS it will accept.
The packetloss and the iperf3 tests look OK, but I guess you really need to record these while you are playing and actually encountering issues....
The mtr looks also clean, how about letting that run for much longer:mtr -ezbw -c 1000 easo.ea.com
But that is still the US server and likely different from the path your packets travel over during actual game play.
@segal_72 Can you do the MTR to a game server that you actually play on?
And, given these results for the moment, can you run a game and tell us how does it feel?
dlakelan:
mtr -ezbw -c 10
root@OpenWrt:~# mtr -ezbw -c 10 213.179.218.36
Start: 2022-01-18T01:05:51+0100
HOST: OpenWrt                                                                      Loss%   Snt   Last   Avg  Best  Wrst StDev
  1. AS3303   49.128.17.170.static.wline.lns.sme.cust.swisscom.ch (170.17.128.49)   0.0%    10    0.8   0.8   0.6   0.9   0.1
  2. AS3303   213.3.210.192 (213.3.210.192)                                         0.0%    10    5.3   5.5   5.3   5.7   0.1
  3. AS???    ???                                                                  100.0    10    0.0   0.0   0.0   0.0   0.0
  4. AS???    i69lss-015-ae3.bb.ip-plus.net (193.134.95.56)                         0.0%    10    8.2   9.4   8.2  13.5   1.7
  5. AS3303   i69lsp-015-ae0.bb.ip-plus.net (138.187.129.54)                        0.0%    10   10.0   8.8   8.1  10.0   0.6
  6. AS3303   i68geb-015-ae8.bb.ip-plus.net (138.187.130.113)                       0.0%    10    9.1   9.7   9.0  12.2   1.2
  7. AS3303   i00mad-015-ae0.bb.ip-plus.net (138.187.129.201)                       0.0%    10   29.4  33.2  29.0  65.5  11.4
  8. AS???    i3d.baja.espanix.net (193.149.1.155)                                 80.0%    10  2031. 2032. 2031. 2033.   1.4
  9. AS???    ???                                                                  100.0    10    0.0   0.0   0.0   0.0   0.0
root@OpenWrt:~#
root@OpenWrt:~# mtr -ezbw -c 10 15.161.164.242
Start: 2022-01-18T01:09:28+0100
HOST: OpenWrt                                                                       Loss%   Snt   Last   Avg  Best  Wrst StDev
  1. AS3303   49.128.17.170.static.wline.lns.sme.cust.swisscom.ch (170.17.128.49)    0.0%    10    0.5   0.7   0.5   1.6   0.3
  2. AS3303   213.3.210.192 (213.3.210.192)                                          0.0%    10    5.2   5.4   5.2   5.9   0.2
  3. AS???    ???                                                                   100.0    10    0.0   0.0   0.0   0.0   0.0
  4. AS???    i69lss-015-ae3.bb.ip-plus.net (193.134.95.56)                          0.0%    10    8.3   9.1   8.0  15.8   2.4
  5. AS3303   i79zhh-015-ae12.bb.ip-plus.net (138.187.130.209)                       0.0%    10    8.9   9.5   8.1  17.7   3.0
  6. AS???    52.46.167.230 (52.46.167.230)                                          0.0%    10    8.7   8.9   8.4  12.0   1.1
  7. AS???    52.93.42.72 (52.93.42.72)                                              0.0%    10   18.9  20.5  18.9  29.5   3.3
  8. AS???    52.93.42.83 (52.93.42.83)                                              0.0%    10   18.9  19.2  18.6  20.5   0.6
  9. AS???    150.222.245.2 (150.222.245.2)                                          0.0%    10   24.1  25.7  23.8  35.3   3.7
 10. AS???    ???                                                                   100.0    10    0.0   0.0   0.0   0.0   0.0
 11. AS???    ???                                                                   100.0    10    0.0   0.0   0.0   0.0   0.0
 12. AS???    ???                                                                   100.0    10    0.0   0.0   0.0   0.0   0.0
 13. AS???    ???                                                                   100.0    10    0.0   0.0   0.0   0.0   0.0
 14. AS???    ???                                                                   100.0    10    0.0   0.0   0.0   0.0   0.0
 15. AS16509  52.119.155.24 (52.119.155.24)                                          0.0%    10   36.4  27.2  25.2  36.4   3.5
 16. AS16509  52.119.155.9 (52.119.155.9)                                            0.0%    10   25.1  24.9  24.7  25.2   0.2
 17. AS16509  52.119.154.230 (52.119.154.230)                                        0.0%    10   22.8  23.5  22.8  24.5   0.6
 18. AS16509  52.119.154.251 (52.119.154.251)                                        0.0%    10   20.3  19.5  18.9  20.5   0.7
 19. AS16509  52.119.154.88 (52.119.154.88)                                          0.0%    10   19.1  19.0  18.8  19.5   0.3
 20. AS???    ???                                                                   100.0    10    0.0   0.0   0.0   0.0   0.0
 21. AS???    ???                                                                   100.0    10    0.0   0.0   0.0   0.0   0.0
 22. AS???    ???                                                                   100.0    10    0.0   0.0   0.0   0.0   0.0
 23. AS16509  ec2-15-161-164-242.eu-south-1.compute.amazonaws.com (15.161.164.242)   0.0%    10   18.3  18.5  18.3  18.8   0.1
root@OpenWrt:~#
root@OpenWrt:~# mtr -ezbw -c 10 213.163.73.233
Start: 2022-01-18T01:11:13+0100
HOST: OpenWrt                                                                      Loss%   Snt   Last   Avg  Best  Wrst StDev
  1. AS3303   49.128.17.170.static.wline.lns.sme.cust.swisscom.ch (170.17.128.49)   0.0%    10    0.6   0.6   0.5   0.6   0.0
  2. AS3303   213.3.210.192 (213.3.210.192)                                         0.0%    10    5.3   5.3   5.2   5.6   0.1
  3. AS???    ???                                                                  100.0    10    0.0   0.0   0.0   0.0   0.0
  4. AS???    i69lss-015-ae1.bb.ip-plus.net (193.134.95.122)                        0.0%    10    8.4  10.0   8.3  15.9   3.0
  5. AS3303   i79zhh-015-ae12.bb.ip-plus.net (138.187.130.209)                      0.0%    10    8.3  10.8   8.3  15.0   3.0
  6. AS3303   i79tix-025-ae10.bb.ip-plus.net (138.187.129.174)                      0.0%    10    8.5  14.8   8.1  32.0  10.2
  7. AS49544  chzrh1-rt001i.i3d.net (5.200.30.24)                                   0.0%    10    8.4   9.0   8.3  14.5   1.9
  8. AS49544  defra1-rt001i.i3d.net (109.200.218.126)                               0.0%    10   13.5  13.7  13.4  13.9   0.2
  9. AS49544  nlrtm1-rt002i.i3d.net (109.200.218.62)                                0.0%    10   22.9  23.2  22.9  23.9   0.3
 10. AS49544  hosted-by.i3d.net (213.163.73.233)                                    0.0%    10   22.1  22.0  21.7  22.2   0.1
root@OpenWrt:~#
213.163.73.233hosted-by.i3d.net
it's a server that responds
segal_72:
this server seems ideal compared to others, it is clean, short traceroute, and the server is located in netherlands.
can you play a game on that server and tell us what happens?
yes I will ban the other servers to be sure to play in the Netherlands
segal_72:
213.163.73.233
This seems like a good/better starting point since the server at least responds to probes
i3D.net the network operator has a looking glas service we can use to get the path back into the Swisscom network close to your router (here I selected nlrtm1-rt002i as orginating server):
Command: traceroute as-number-lookup 170.17.128.49 interface lo0.0

traceroute to 170.17.128.49 (170.17.128.49), 30 hops max, 52 byte packets
 1  defra1-rt001i.i3d.net (109.200.218.63)  10.652 ms  10.908 ms  10.831 ms
     MPLS Label=2352 CoS=0 TTL=1 S=1
 2  chzrh1-rt001i.i3d.net (109.200.218.127)  17.557 ms  16.938 ms  18.996 ms
 3  swisscom.chzrh1-rt001i.i3d.net (5.200.30.25)  57.850 ms  17.431 ms  16.048 ms
 4  i79zhh-015-ae25.bb.ip-plus.net (138.187.129.175) [AS  3303]  40.865 ms  17.727 ms  16.095 ms
 5  * * *
 6  213.3.210.192 (213.3.210.192) [AS  3303]  18.844 ms  18.279 ms  19.793 ms
     MPLS Label=15075 CoS=0 TTL=254 S=1
 7  49.128.17.170.static.wline.lns.sme.cust.swisscom.ch (170.17.128.49) [AS  3303]  23.505 ms  23.335 ms  23.299 ms
MTR would be nicer, but traceroute will need to do. Now with that looking glass you have a view on the return path of packets, and now you can start playing and once problem occur again, run the forward mtr as above and also have a look at the reverse mtrs from i3D's looking glas
But what game are you playing
root@OpenWrt:~# mtr -ezbw -c 1000 213.163.73.233
Start: 2022-01-18T01:17:49+0100
HOST: OpenWrt                                                                      Loss%   Snt   Last   Avg  Best  Wrst StDev
  1. AS3303   49.128.17.170.static.wline.lns.sme.cust.swisscom.ch (170.17.128.49)   0.0%  1000    0.6   0.5   0.4   2.7   0.2
  2. AS3303   213.3.210.192 (213.3.210.192)                                         0.0%  1000    5.4   5.2   5.0  11.9   0.5
  3. AS???    ???                                                                  100.0  1000    0.0   0.0   0.0   0.0   0.0
  4. AS???    i69lss-015-ae1.bb.ip-plus.net (193.134.95.122)                        0.0%  1000   14.7   9.5   8.0  48.6   3.3
  5. AS3303   i79zhh-015-ae12.bb.ip-plus.net (138.187.130.209)                      0.0%  1000    8.3  10.4   8.0  49.2   5.0
  6. AS3303   i79tix-025-ae10.bb.ip-plus.net (138.187.129.174)                      0.0%  1000    8.3  17.1   7.9  89.9  13.6
  7. AS49544  chzrh1-rt001i.i3d.net (5.200.30.24)                                   0.0%  1000    8.3   8.4   7.9  35.3   1.7
  8. AS49544  defra1-rt001i.i3d.net (109.200.218.126)                               0.0%  1000   13.4  14.7  13.2  43.8   3.5
  9. AS49544  nlrtm1-rt002i.i3d.net (109.200.218.62)                                0.0%  1000   23.5  25.0  22.7  75.7   5.0
 10. AS49544  hosted-by.i3d.net (213.163.73.233)                                    0.0%  1000   22.0  21.9  21.4  26.6   0.5
 [/url]