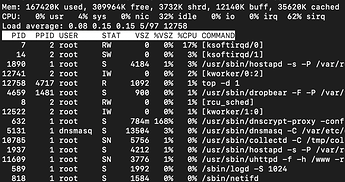
Hi folks, I am trying to understand the output of top wrt sirq. The total sirq is 62%, but the total of both ksoftirq is 20%. Why is the difference?
No the total is for two ksoftirqd so deamons that are involved in the sirq processing AFAICT, the best way to read the top output is to use 100-idle (in your case 100-32 = 68 %) as your systems PU load, as those are the cycles that are already used, all further processing needs will need to be served out of the idle reserve.
Thx, but I still do not understand why ksoftirq/[0|1] are showing 17 & 3% while the total for sirq is 62%.
UPDATE: 17 & 3% is relative to a single core, not the CPU. So the discrepancy is even bigger and those two numbers need to be divided by two. So according to the top two lines, the CPU usage by ksoftirqd is 10%.
BTW, pidstat is also displaying 17 & 3% for those two kernel processes.
see http://derpi.tuwien.ac.at/cgi-bin/man/man2html?9+ksoftirqd:
" DESCRIPTION
ksoftirqd is a per-cpu kernel thread that runs when the machine is under heavy soft-interrupt load. Soft interrupts are normally serviced on return from a hard interrupt, but it's possible for soft interrupts to be triggered more quickly than they can be serviced. If a soft interrupt is triggered for a second time while soft interrupts are being handled, the ksoftirq daemon is triggered to handle the soft interrupts in process context. If ksoftirqd is taking more than a tiny percentage of CPU time, this indicates the machine is under heavy soft interrupt load."
According to this not every sirq will trigger ksoftirqd and hence ksoftirqd <= sirq seems normal...
This topic was automatically closed 10 days after the last reply. New replies are no longer allowed.
