So here is a version that actually seems to work:
cat /usr/lib/collectd/exec/exec-lantiqdsl.sh
#!/bin/sh

# source jshn shell library
. /usr/share/libubox/jshn.sh

HOSTNAME="${COLLECTD_HOSTNAME:-$(cat /proc/sys/kernel/hostname)}"

# retrieve DSL metrics through ubus
dsl_metrics_json=$(/bin/ubus call dsl metrics)

# initialize JSHN and load JSON
json_init
json_load "$dsl_metrics_json"

# get line state
json_get_var linestate up

# only continue if line is up
# collecting any line stats is pointless if the line is down, downtime will be reflected by the gap in statistics
[ "$linestate" = "1" ] || exit 0

# get basic line stats
json_get_var uptime uptime

# get downstream and upstream stats
json_select downstream
	json_get_var downstream_datarate     data_rate
	json_get_var downstream_datarate_max attndr
	json_get_var downstream_snr          snr
json_close_object
json_select upstream
	json_get_var upstream_datarate       data_rate
	json_get_var upstream_datarate_max   attndr
	json_get_var upstream_snr            snr
json_close_object

# get near and far errors
json_select errors
	json_select near
		json_get_var errors_near_es       es
		json_get_var errors_near_ses      ses
		json_get_var errors_near_fecs     fecs
		json_get_var errors_near_crc      crc_p
		json_get_var errors_near_crcp     crcp_p
		json_get_var errors_near_cv       cv_p
		json_get_var errors_near_cvp      cvp_p
		json_get_var errors_near_rtx_uc   rx_corrupted
		json_get_var errors_near_rtx_ucp  rx_uncorrected_protected
		json_get_var errors_near_rtx_rx   rx_retransmitted
		json_get_var errors_near_rtx_c    rx_corrected
		json_get_var errors_near_rtx_tx   tx_retransmitted
	json_close_object
	json_select far
		json_get_var errors_far_es        es
		json_get_var errors_far_ses       ses
		json_get_var errors_far_fecs      fecs
		json_get_var errors_far_crc       crc_p
		json_get_var errors_far_crcp      crcp_p
		json_get_var errors_far_cv        cv_p
		json_get_var errors_far_cvp       cvp_p
		json_get_var errors_far_rtx_uc    rx_corrupted
		json_get_var errors_far_rtx_ucp   rx_uncorrected_protected
		json_get_var errors_far_rtx_rx    rx_retransmitted
		json_get_var errors_far_rtx_c     rx_corrected
		json_get_var errors_far_rtx_tx    tx_retransmitted
	json_close_object
json_close_object

# present values to collectd
echo "PUTVAL \"$HOSTNAME/exec-lantiqdsl/uptime\" N:$uptime"
echo "PUTVAL \"$HOSTNAME/exec-lantiqdsl/bitrate-downstream\" N:$downstream_datarate"
echo "PUTVAL \"$HOSTNAME/exec-lantiqdsl/bitrate-downstream_max\" N:$downstream_datarate_max"
echo "PUTVAL \"$HOSTNAME/exec-lantiqdsl/snr-downstream\" N:$downstream_snr"
echo "PUTVAL \"$HOSTNAME/exec-lantiqdsl/bitrate-upstream\" N:$upstream_datarate"
echo "PUTVAL \"$HOSTNAME/exec-lantiqdsl/bitrate-upstream_max\" N:$upstream_datarate_max"
echo "PUTVAL \"$HOSTNAME/exec-lantiqdsl/snr-upstream\" N:$upstream_snr"
echo "PUTVAL \"$HOSTNAME/exec-lantiqdsl/errors-near_es\" N:$errors_near_es"
echo "PUTVAL \"$HOSTNAME/exec-lantiqdsl/errors-near_ses\" N:$errors_near_ses"
echo "PUTVAL \"$HOSTNAME/exec-lantiqdsl/errors-near_fecs\" N:$errors_near_fecs"
echo "PUTVAL \"$HOSTNAME/exec-lantiqdsl/errors-near_crc\" N:$errors_near_crc"
echo "PUTVAL \"$HOSTNAME/exec-lantiqdsl/errors-near_crcp\" N:$errors_near_crcp"
echo "PUTVAL \"$HOSTNAME/exec-lantiqdsl/errors-near_cv\" N:$errors_near_cv"
echo "PUTVAL \"$HOSTNAME/exec-lantiqdsl/errors-near_cvp\" N:$errors_near_cvp"
echo "PUTVAL \"$HOSTNAME/exec-lantiqdsl/errors-near_rtx_uc\" N:$errors_near_rtx_uc"
echo "PUTVAL \"$HOSTNAME/exec-lantiqdsl/errors-near_rtx_ucp\" N:$errors_near_rtx_ucp"
echo "PUTVAL \"$HOSTNAME/exec-lantiqdsl/errors-near_rtx_rx\" N:$errors_near_rtx_rx"
echo "PUTVAL \"$HOSTNAME/exec-lantiqdsl/errors-near_rtx_c\" N:$errors_near_rtx_c"
echo "PUTVAL \"$HOSTNAME/exec-lantiqdsl/errors-near_rtx_tx\" N:$errors_near_rtx_tx"
echo "PUTVAL \"$HOSTNAME/exec-lantiqdsl/errors-far_es\" N:$errors_far_es"
echo "PUTVAL \"$HOSTNAME/exec-lantiqdsl/errors-far_ses\" N:$errors_far_ses"
echo "PUTVAL \"$HOSTNAME/exec-lantiqdsl/errors-far_fecs\" N:$errors_far_fecs"
echo "PUTVAL \"$HOSTNAME/exec-lantiqdsl/errors-far_crc\" N:$errors_far_crc"
echo "PUTVAL \"$HOSTNAME/exec-lantiqdsl/errors-far_crcp\" N:$errors_far_crcp"
echo "PUTVAL \"$HOSTNAME/exec-lantiqdsl/errors-far_cv\" N:$errors_far_cv"
echo "PUTVAL \"$HOSTNAME/exec-lantiqdsl/errors-far_cvp\" N:$errors_far_cvp"
echo "PUTVAL \"$HOSTNAME/exec-lantiqdsl/errors-far_rtx_uc\" N:$errors_far_rtx_uc"
echo "PUTVAL \"$HOSTNAME/exec-lantiqdsl/errors-far_rtx_ucp\" N:$errors_far_rtx_ucp"
echo "PUTVAL \"$HOSTNAME/exec-lantiqdsl/errors-far_rtx_rx\" N:$errors_far_rtx_rx"
echo "PUTVAL \"$HOSTNAME/exec-lantiqdsl/errors-far_rtx_c\" N:$errors_far_rtx_c"
echo "PUTVAL \"$HOSTNAME/exec-lantiqdsl/errors-far_rtx_tx\" N:$errors_far_rtx_tx"
cat /www/luci-static/resources/statistics/rrdtool/definitions/exec.js
'use strict';
'require baseclass';
return baseclass.extend({
title: _('DSL'),
rrdargs: function(graph, host, plugin, plugin_instance, dtype) {
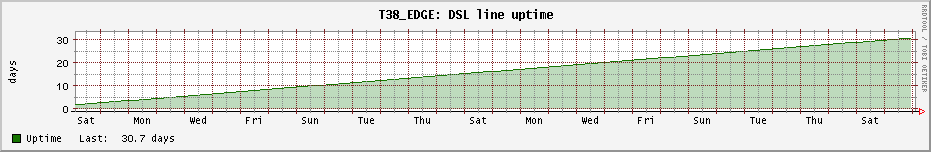
var uptime = {
title: "%H: DSL line uptime",
vlabel: "days",
alt_autoscale: true,
number_format: "%5.1lf days",
rrdopts: ["-h 80"],
data: {
types: ["uptime"],
options: {
uptime: {
title: "Uptime",
transform_rpn: "86400,/",
noavg: true,
color: "007700"
}
}
}
};
var datarate = {
title: "%H: DSL datarates",
vlabel: "bit/s",
number_format: "%5.1lf %sbit/s",
alt_autoscale: true,
data: {
instances: {
bitrate: ["downstream", "downstream_max", "upstream", "upstream_max"]
},
options: {
bitrate_downstream: {
title: "Downstream",
color: "007700"
},
bitrate_downstream_max: {
title: "Downstream (max.)",
color: "aaaaaa",
overlay: true,
noarea: true
},
bitrate_upstream: {
title: "Upstream",
color: "000077",
flip: true
},
bitrate_upstream_max: {
title: "Upstream (max.)",
color: "aaaaaa",
overlay: true,
noarea: true,
flip: true
}
}
}
};
var snr = {
title: "%H: DSL SNR",
vlabel: "dB",
number_format: "%4.1lf dB",
alt_autoscale: true,
data: {
instances: {
snr: ["downstream", "upstream"]
},
options: {
snr_downstream: {
title: "Downstream",
color: "007700",
overlay: true
},
snr_upstream: {
title: "Upstream",
color: "000077",
flip: true
}
}
}
};
var operational_counters = {
title: "%H: DSL operational counters",
vlabel: "events (per day)",
y_min: -4000,
y_max: 4000,
alt_autoscale: true,
data: {
instances: {
errors: ["near_fecs", "far_fecs"]
},
options: {
errors_near_fecs: {
title: "FECs (near)",
transform_rpn: "86400,*",
color: "007700"
},
errors_far_fecs: {
title: "FECs (far)",
transform_rpn: "86400,*",
color: "000077",
flip: true
}
}
}
};
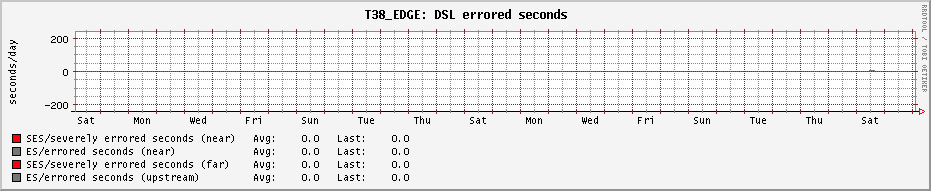
var error_seconds = {
title: "%H: DSL errored seconds",
vlabel: "seconds (per day)",
y_min: -200,
y_max: 200,
alt_autoscale: true,
data: {
instances: {
errors: ["near_ses", "near_es", "far_ses", "far_es" ]
},
options: {
errors_near_ses: {
title: "SES/severely errored seconds (near)",
transform_rpn: "86400,*",
color: "ff0000"
},
errors_near_es: {
title: "ES/errored seconds (near)",
transform_rpn: "86400,*",
color: "777777",
overlay: true,
noarea: true
},
errors_far_ses: {
title: "SES/severely errored seconds (far)",
transform_rpn: "86400,*",
color: "ff0000",
flip: true
},
errors_far_es: {
title: "ES/errored seconds (upstream)",
transform_rpn: "86400,*",
color: "777777",
flip: true,
overlay: true,
noarea: true
}
}
}
};
var error_counters = {
title: "%H: DSL error counters",
vlabel: "errors (per day)",
y_min: -200,
y_max: 200,
alt_autoscale: true,
data: {
instances: {
errors: ["near_crc", "near_crcp", "far_crc", "far_crcp"]
},
options: {
errors_near_crc: {
title: "CRC errors (near)",
transform_rpn: "86400,*",
color: "444444"
},
errors_near_crcp: {
title: "CRC errors (preemptive, near)",
transform_rpn: "86400,*",
color: "888888",
overlay: true,
noarea: true
},
errors_far_crc: {
title: "CRC errors (far)",
transform_rpn: "86400,*",
color: "444444",
flip: true,
overlay: true,
noarea: true
},
errors_far_crcp: {
title: "CRC errors (preemptive, far)",
transform_rpn: "86400,*",
color: "888888",
flip: true,
overlay: true,
noarea: true
}
}
}
};
var retx_counters = {
title: "%H: DSL G.INP(retx) retransmission counters",
vlabel: "DTUs (per day)",
y_min: -200,
y_max: 200,
alt_autoscale: true,
data: {
instances: {
errors: ["near_rtx_uc", "near_rtx_ucp", "near_rtx_c", "near_rtx_tx", "far_rtx_uc", "far_rtx_ucp", "far_rtx_c", "far_rtx_tx"]
},
options: {
errors_near_rtx_uc: {
title: "ReTx corrupted (near)",
transform_rpn: "86400,*",
color: "880000",
overlay: true,
noarea: false
},
errors_near_rtx_ucp: {
title: "ReTx corrupted protected (near)",
transform_rpn: "86400,*",
color: "ff0000",
overlay: true,
noarea: true
},
errors_near_rtx_c: {
title: "ReTx corrected (near)",
transform_rpn: "86400,*",
color: "00ff00",
overlay: true,
noarea: true
},
errors_near_rtx_tx: {
title: "ReTx tx-retransmitted (near)",
transform_rpn: "86400,*",
color: "ff00ff",
overlay: true,
noarea: true
},
errors_far_rtx_uc: {
title: "ReTx corrupted (far)",
transform_rpn: "86400,*",
color: "880000",
flip: true,
overlay: true,
noarea: false
},
errors_far_rtx_ucp: {
title: "ReTx corrupted protected (far)",
transform_rpn: "86400,*",
color: "ff0000",
flip: true,
overlay: true,
noarea: true
},
errors_far_rtx_c: {
title: "ReTx corrected (far)",
transform_rpn: "86400,*",
color: "00ff00",
flip: true,
overlay: true,
noarea: true
},
errors_far_rtx_tx: {
title: "ReTx tx-retransmitted (far)",
transform_rpn: "86400,*",
color: "ff00ff",
flip: true,
overlay: true,
noarea: true
},
}
}
};
return [uptime,datarate,snr,operational_counters,error_seconds,error_counters,retx_counters];
}
});
I have not yet tried any of the default to zero approaches, will update after testing. I do wonder whether using an undocumented feature in json_get_var is a robust way forward though, so I am more inclined to use the shell approach instead. If I do, would it make sense to just do this for all variables to reduce the dependency on the exact ubus dsl metrics?