SQM startup errors

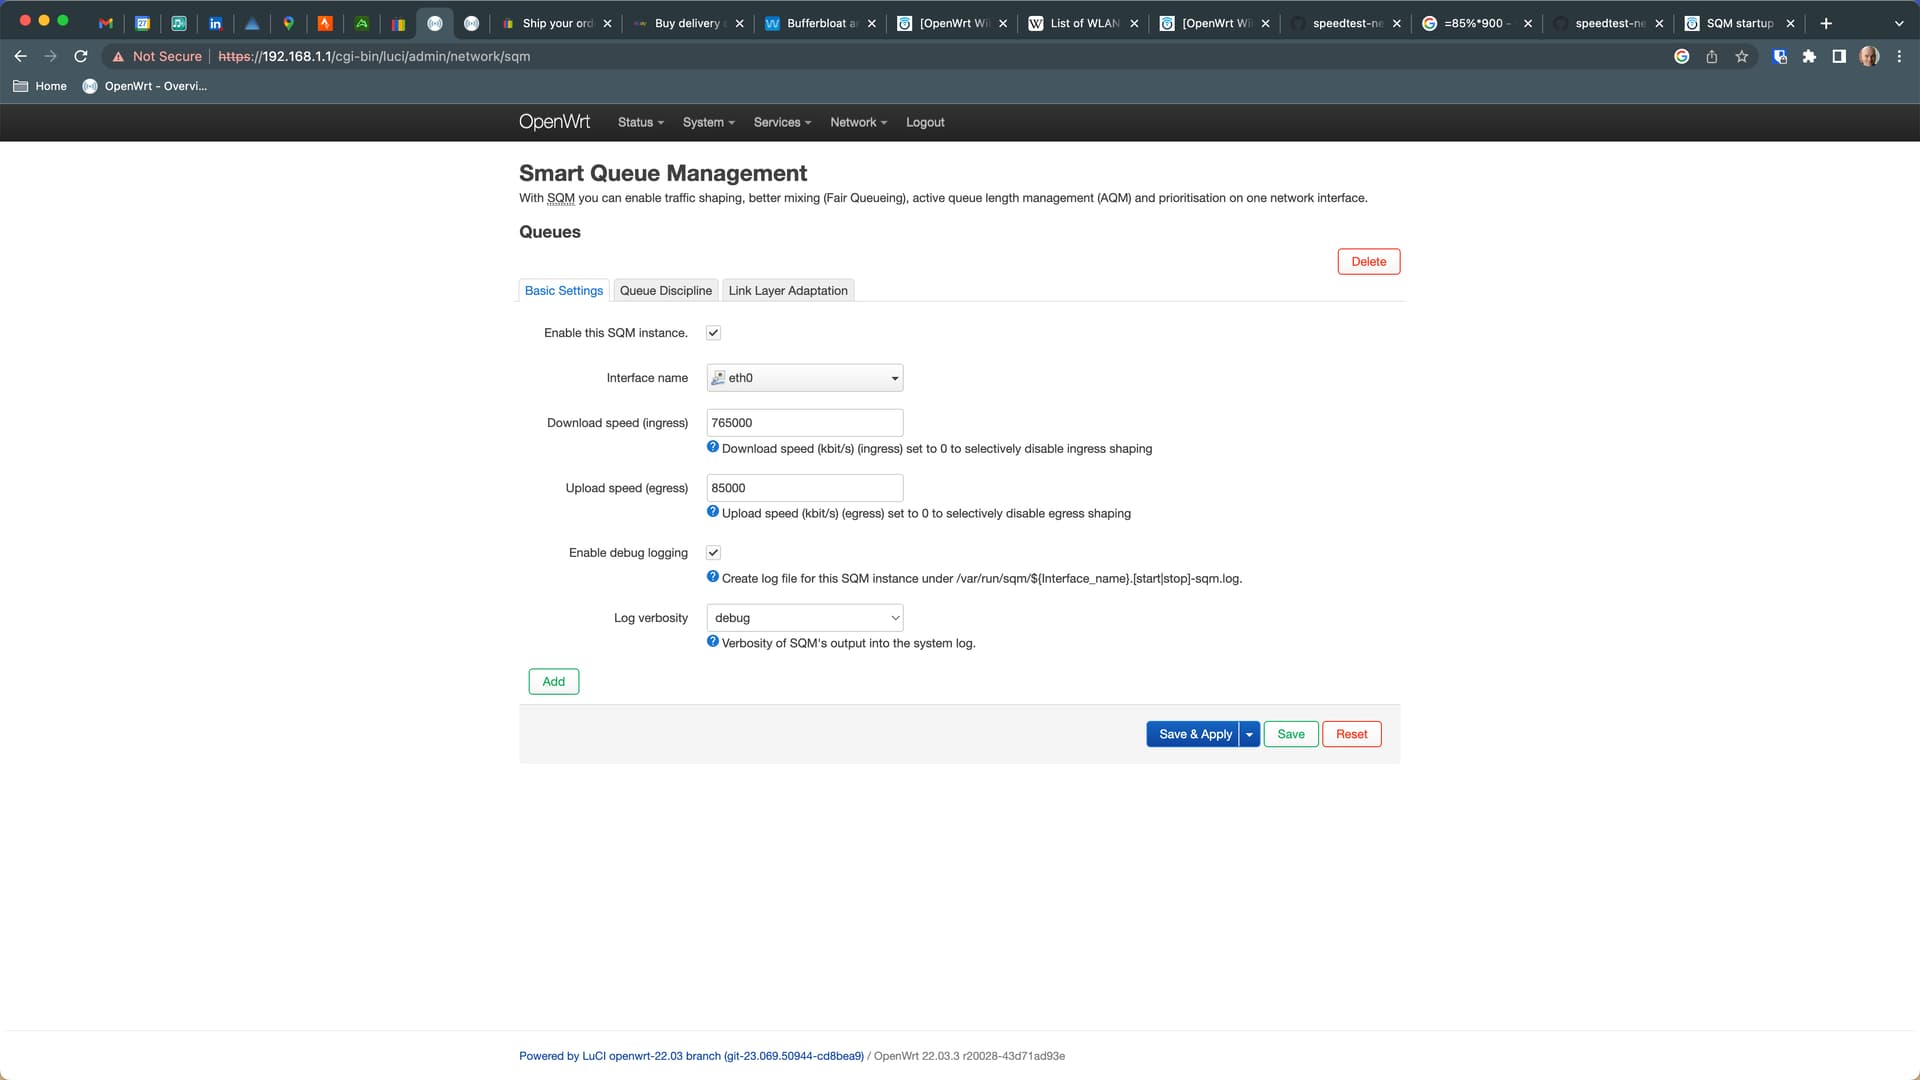
Hi, I'm getting several startup errors seen in the SQM log below. Are these anything to be concerned about please? Platform is Rpi 4, Internet is 900/100 BT UK Full Fibre to the Prem. Its shaped at 85% for testing as per the attached image and adaptation layer is set to 44 bytes.

Why do I ask? 1) I'd like to be sure its working as well as I can get it 2) I am seeing odd behaviours - speedtest.netperf.sh is showing a similar low latency with SQM turned on AND off, yet Waveform Speedtest from a macbook pro m2 cannot get A+ until I shape SQM to 65%)

start-sqm: Log for interface eth0: Thu Apr 27 09:58:49 UTC 2023

Thu Apr 27 09:58:49 UTC 2023: Starting.
Starting SQM script: piece_of_cake.qos on eth0, in: 765000 Kbps, out: 85000 Kbps
fn_exists: function candidate name: sqm_start
fn_exists: TYPE_OUTPUT: sqm_start: not found
fn_exists: return value: 1
Using generic sqm_start_default function.
fn_exists: function candidate name: sqm_prepare_script
fn_exists: TYPE_OUTPUT: sqm_prepare_script is a function
fn_exists: return value: 0
sqm_start_default: starting sqm_prepare_script
cmd_wrapper: COMMAND: /sbin/ip link add name SQM_IFB_dd205 type ifb
cmd_wrapper: ip: SUCCESS: /sbin/ip link add name SQM_IFB_dd205 type ifb
cmd_wrapper: COMMAND: /sbin/tc qdisc replace dev SQM_IFB_dd205 root cake
cmd_wrapper: tc: SUCCESS: /sbin/tc qdisc replace dev SQM_IFB_dd205 root cake
QDISC cake is useable.
cmd_wrapper: COMMAND: /sbin/ip link set dev SQM_IFB_dd205 down
cmd_wrapper: ip: SUCCESS: /sbin/ip link set dev SQM_IFB_dd205 down
cmd_wrapper: COMMAND: /sbin/ip link delete SQM_IFB_dd205 type ifb
cmd_wrapper: ip: SUCCESS: /sbin/ip link delete SQM_IFB_dd205 type ifb
cmd_wrapper: COMMAND: /sbin/ip link add name SQM_IFB_db42f type ifb
cmd_wrapper: ip: SUCCESS: /sbin/ip link add name SQM_IFB_db42f type ifb
cmd_wrapper: COMMAND: /sbin/tc qdisc replace dev SQM_IFB_db42f root cake
cmd_wrapper: tc: SUCCESS: /sbin/tc qdisc replace dev SQM_IFB_db42f root cake
QDISC cake is useable.
cmd_wrapper: COMMAND: /sbin/ip link set dev SQM_IFB_db42f down
cmd_wrapper: ip: SUCCESS: /sbin/ip link set dev SQM_IFB_db42f down
cmd_wrapper: COMMAND: /sbin/ip link delete SQM_IFB_db42f type ifb
cmd_wrapper: ip: SUCCESS: /sbin/ip link delete SQM_IFB_db42f type ifb
sqm_start_default: Starting piece_of_cake.qos
ifb associated with interface eth0: 
Currently no ifb is associated with eth0, this is normal during starting of the sqm system.
cmd_wrapper: COMMAND: /sbin/ip link add name ifb4eth0 type ifb
cmd_wrapper: ip: SUCCESS: /sbin/ip link add name ifb4eth0 type ifb
fn_exists: function candidate name: egress
fn_exists: TYPE_OUTPUT: egress is a function
fn_exists: return value: 0
egress
cmd_wrapper: tc: invocation silenced by request, FAILURE either expected or acceptable.
cmd_wrapper: COMMAND: /sbin/tc qdisc del dev eth0 root
cmd_wrapper: tc: FAILURE (2): /sbin/tc qdisc del dev eth0 root
cmd_wrapper: tc: LAST ERROR: Error: Cannot delete qdisc with handle of zero.
LLA: default link layer adjustment method for cake is cake
cake link layer adjustments:  overhead 44 mpu 0
cmd_wrapper: COMMAND: /sbin/tc qdisc add dev eth0 root cake bandwidth 85000kbit overhead 44 mpu 0 besteffort
cmd_wrapper: tc: SUCCESS: /sbin/tc qdisc add dev eth0 root cake bandwidth 85000kbit overhead 44 mpu 0 besteffort
sqm_start_default: egress shaping activated
cmd_wrapper: COMMAND: /sbin/ip link add name SQM_IFB_6e150 type ifb
cmd_wrapper: ip: SUCCESS: /sbin/ip link add name SQM_IFB_6e150 type ifb
cmd_wrapper: COMMAND: /sbin/tc qdisc replace dev SQM_IFB_6e150 ingress
cmd_wrapper: tc: SUCCESS: /sbin/tc qdisc replace dev SQM_IFB_6e150 ingress
QDISC ingress is useable.
cmd_wrapper: COMMAND: /sbin/ip link set dev SQM_IFB_6e150 down
cmd_wrapper: ip: SUCCESS: /sbin/ip link set dev SQM_IFB_6e150 down
cmd_wrapper: COMMAND: /sbin/ip link delete SQM_IFB_6e150 type ifb
cmd_wrapper: ip: SUCCESS: /sbin/ip link delete SQM_IFB_6e150 type ifb
fn_exists: function candidate name: ingress
fn_exists: TYPE_OUTPUT: ingress is a function
fn_exists: return value: 0
ingress
cmd_wrapper: tc: invocation silenced by request, FAILURE either expected or acceptable.
cmd_wrapper: COMMAND: /sbin/tc qdisc del dev eth0 handle ffff: ingress
cmd_wrapper: tc: FAILURE (2): /sbin/tc qdisc del dev eth0 handle ffff: ingress
cmd_wrapper: tc: LAST ERROR: Error: Invalid handle.
cmd_wrapper: COMMAND: /sbin/tc qdisc add dev eth0 handle ffff: ingress
cmd_wrapper: tc: SUCCESS: /sbin/tc qdisc add dev eth0 handle ffff: ingress
cmd_wrapper: tc: invocation silenced by request, FAILURE either expected or acceptable.
cmd_wrapper: COMMAND: /sbin/tc qdisc del dev ifb4eth0 root
cmd_wrapper: tc: FAILURE (2): /sbin/tc qdisc del dev ifb4eth0 root
cmd_wrapper: tc: LAST ERROR: Error: Cannot delete qdisc with handle of zero.
LLA: default link layer adjustment method for cake is cake
cake link layer adjustments:  overhead 44 mpu 0
cmd_wrapper: COMMAND: /sbin/tc qdisc add dev ifb4eth0 root cake bandwidth 765000kbit overhead 44 mpu 0 besteffort wash
cmd_wrapper: tc: SUCCESS: /sbin/tc qdisc add dev ifb4eth0 root cake bandwidth 765000kbit overhead 44 mpu 0 besteffort wash
cmd_wrapper: COMMAND: /sbin/ip link set dev ifb4eth0 up
cmd_wrapper: ip: SUCCESS: /sbin/ip link set dev ifb4eth0 up
cmd_wrapper: COMMAND: /sbin/tc filter add dev eth0 parent ffff: protocol all prio 10 u32 match u32 0 0 flowid 1:1 action mirred egress redirect dev ifb4eth0
cmd_wrapper: tc: SUCCESS: /sbin/tc filter add dev eth0 parent ffff: protocol all prio 10 u32 match u32 0 0 flowid 1:1 action mirred egress redirect dev ifb4eth0
sqm_start_default: ingress shaping activated
/var/run/sqm/eth0.start-sqm.log

WITH SQM TURNED ON

root@OpenWrt:~# speedtest-netperf.sh --host "netperf-eu.bufferbloat.net"
2023-04-27 10:20:48 Starting speedtest for 60 seconds per transfer session.
Measure speed to netperf-eu.bufferbloat.net (IPv4) while pinging gstatic.com.
Download and upload sessions are sequential, each with 5 simultaneous streams.
.............................................................
 Download: 705.19 Mbps
  Latency: [in msec, 61 pings, 0.00% packet loss]
      Min:   3.821
    10pct:   3.986
   Median:   4.116
      Avg:   4.166
    90pct:   4.337
      Max:   4.717
 CPU Load: [in % busy (avg +/- std dev) @ avg frequency, 57 samples]
     cpu0:  38.8 +/-  7.9  @ 1729 MHz
     cpu1:  45.8 +/-  8.4  @ 1658 MHz
     cpu2:  40.8 +/-  7.2  @ 1689 MHz
     cpu3:  63.3 +/-  0.0  @ 1637 MHz
 Overhead: [in % used of total CPU available]
  netperf:  32.2
.............................................................
   Upload:  79.14 Mbps
  Latency: [in msec, 61 pings, 0.00% packet loss]
      Min:   3.904
    10pct:   3.973
   Median:   4.086
      Avg:   4.101
    90pct:   4.231
      Max:   4.636
 CPU Load: [in % busy (avg +/- std dev) @ avg frequency, 58 samples]
     cpu0:   2.1 +/-  1.3  @  938 MHz
     cpu1:   2.5 +/-  1.4  @  857 MHz
     cpu2:   1.3 +/-  1.0  @  900 MHz
     cpu3:   5.9 +/-  2.2  @  838 MHz
 Overhead: [in % used of total CPU available]
  netperf:   0.9
root@OpenWrt:~# 

WITH SQM TURNED OFF

root@OpenWrt:~# speedtest-netperf.sh --host "netperf-eu.bufferbloat.net"
2023-04-27 10:48:39 Starting speedtest for 60 seconds per transfer session.
Measure speed to netperf-eu.bufferbloat.net (IPv4) while pinging gstatic.com.
Download and upload sessions are sequential, each with 5 simultaneous streams.
.............................................................
 Download: 833.79 Mbps
  Latency: [in msec, 61 pings, 0.00% packet loss]
      Min:   5.346
    10pct:   5.542
   Median:   6.020
      Avg:   6.136
    90pct:   6.391
      Max:   9.607
 CPU Load: [in % busy (avg +/- std dev) @ avg frequency, 58 samples]
     cpu0:  25.3 +/-  8.4  @ 1581 MHz
     cpu1:  64.1 +/-  5.3  @ 1542 MHz
     cpu2:  27.1 +/-  7.5  @ 1542 MHz
     cpu3:  20.2 +/-  7.8  @ 1540 MHz
 Overhead: [in % used of total CPU available]
  netperf:  24.9
..............................................................
   Upload: 101.40 Mbps
  Latency: [in msec, 61 pings, 0.00% packet loss]
      Min:   5.288
    10pct:   5.401
   Median:   5.915
      Avg:   6.173
    90pct:   6.918
      Max:  11.704
 CPU Load: [in % busy (avg +/- std dev) @ avg frequency, 59 samples]
     cpu0:   1.6 +/-  1.2  @  871 MHz
     cpu1:   3.0 +/-  1.7  @  826 MHz
     cpu2:   5.3 +/-  2.2  @  823 MHz
     cpu3:   3.1 +/-  1.4  @  805 MHz
 Overhead: [in % used of total CPU available]
  netperf:   1.0
root@OpenWrt:~# 

You have logging set to debug. Do the messages still come up when it is set to info?

I will try. Will masking FAILURES rid me of potential problems though?

Some commands are expected to fail under certain circumstances. Looks good to me.

1 Like

If you set logging to info (which is the default level) then it will still show errors and warnings, it won't mask them.

This is interesting as you should be receiving closer to ~940 Mbps. Even with sqm, cpu saturation is not indicated. It's either on the ISP side or your side.

Notice how all FAILURE report are precededd by a:

report? This indicates strongly that you can ignore these...

Based on these numbers and assuming GPON and MTU 1500 with no fancy encapsulations on your link you can expect at most:

765.000 * ((1500-20-20)/(1500 + 44)) = 723.38 Mbps
85.000 * ((1500-20-20)/(1500 + 44)) = 80.38 Mbps
EDIT: as @mindwolf observed TCP timestamps are in play
with TCP timestamps:
765.000 * ((1500-20-20-12)/(1500 + 44)) = 717.44 Mbps
85.000 * ((1500-20-20-12)/(1500 + 44)) = 79.71 Mbps


throughput, based on the sqm shaper... your netperf numbers indicate that you are doing reasonably well... no signs of CPU overload... The upload rate seems A-OK (100-100*79.14/79.71 = 0.72%-age points), the download falls a tad short although a mere 100-100*705.19/717.44 = 1.71`%-age points, which in my book is excellent when comparing theoretical to practical values...

However comparing to the NO SQM numbers it seems clear your ISP over-provisions your link considerably and you are likely to get away with setting cake to ~800/95.

However this is not going to help with the waveform test... maybe post a link to the result of such a test here?

Nope, these are no real failures anyway, this is a belts and suspenders thing, to avoid colliding with a potentially existing IFB/ingress redirection we pro-actively delete it, but if it does not exists this causes an error, it is simpler to just silence that expected error than check existence before attempts to delete...

BT/ofcom only guarantees 900 Mbps, and mentions 910 Mbps as average speed...

Timestamps are set by default in OpenWRT, which accounts for 12 bytes
net.ipv4.tcp_timestamps=1

1 Like

@moeller0 many thanks this is very useful

  • Understood on the FAILURES, no problem.
  • Am getting pretty close to what you say in real life
  • I'll try and get back with the 800/95
  • With SQM off I do see a max of 910/102Mbps
1 Like

If this is a robust and reliable result you see all the time you could try 9000.95 = 855 / 1000.95 = 95 Mbps... but honestly for the download you are deep in the diminishing returns territory already, and I doubt that setting the shaper to 850 or 750 would feel any different (sure you will be able to measure the difference, but for interactive internet use I would guess this would not make a noticeable difference).

Setup rpi4 router, 23.03.3, 800/96Mbps SQM, using speedtest.netperf.sh from the rpi4

root@OpenWrt:~# speedtest-netperf.sh --host "netperf-eu.bufferbloat.net"
2023-05-01 15:49:15 Starting speedtest for 60 seconds per transfer session.
Measure speed to netperf-eu.bufferbloat.net (IPv4) while pinging gstatic.com.
Download and upload sessions are sequential, each with 5 simultaneous streams.
.............................................................
 Download: 739.16 Mbps
  Latency: [in msec, 61 pings, 0.00% packet loss]
      Min:   5.615
    10pct:   5.768
   Median:   5.958
      Avg:   5.973
    90pct:   6.163
      Max:   6.566
 CPU Load: [in % busy (avg +/- std dev) @ avg frequency, 57 samples]
     cpu0:  54.1 +/-  3.4  @ 1763 MHz
     cpu1:  61.7 +/-  2.9  @ 1658 MHz
     cpu2:  35.1 +/-  7.9  @ 1736 MHz
     cpu3:  41.2 +/-  7.0  @ 1639 MHz
 Overhead: [in % used of total CPU available]
  netperf:  32.2
.............................................................
   Upload:  88.41 Mbps
  Latency: [in msec, 61 pings, 0.00% packet loss]
      Min:   5.717
    10pct:   5.735
   Median:   5.816
      Avg:   5.829
    90pct:   5.875
      Max:   6.592
 CPU Load: [in % busy (avg +/- std dev) @ avg frequency, 58 samples]
     cpu0:   1.3 +/-  1.2  @  955 MHz
     cpu1:   2.4 +/-  1.4  @  874 MHz
     cpu2:   2.5 +/-  1.5  @  894 MHz
     cpu3:   6.8 +/-  2.0  @  862 MHz
 Overhead: [in % used of total CPU available]
  netperf:   1.0
root@OpenWrt:~# 

Then using Waveform, from a Macbook Pro 13 M2, Gig Ethernet direct to rpi4 router via TPlink UE-300

Then using Waveform, from a Macbook Pro 13 M2, over WiFi to Belkin RT3200 dumb access point, 1200 phy, to the same rpi4 router via TPlink UE-300

The Macbook AND/OR the Waveform SW seems to introduce considerable latency. It cannot be the TPLINK USB dongles as the same speedtest.netperf.sh from the AP CLI is almost identical to the router CLI test.

Thoughts?

Let me guess, you used Safari? Try firefox inatead, for me Safari results in shoddy timing for this test...

Chrome. But I will try both others good point!

FF worse

Safari worst of all

I have noticed exactly this diminishing return after doing a 100 test. Thank you for reinforcing that. Can you say why that is?

And I'm interested in if the client latency thing is considered a problem by Dave Taht et all.

I see some commentary here about AQL latency on WiFi devices but nothing concrete. And remember Taht saying it was a festering problem with WiFi devices still but nothing about client SW.

Please can you clarify what you mean here. Are you saying add another 12 bytes to the adaptation for timestamps and if so why?

Currently I set it at 44 bytes to be safe.

As far as I know I have:

  • 12 bytes Ethernet
  • 8 bytes PPPoE

Should I add 20 bytes IP? Which would only give 40 bytes. I see no sign of VLANs on BT's Full Fibre service.

Even better at 855/95/44

And with no client bloat

root@OpenWrt:~# speedtest-netperf.sh --host "netperf-eu.bufferbloat.net"
2023-05-01 16:51:14 Starting speedtest for 60 seconds per transfer session.
Measure speed to netperf-eu.bufferbloat.net (IPv4) while pinging gstatic.com.
Download and upload sessions are sequential, each with 5 simultaneous streams.
............................................................
 Download: 792.17 Mbps
  Latency: [in msec, 61 pings, 0.00% packet loss]
      Min:   5.165
    10pct:   5.258
   Median:   5.473
      Avg:   5.501
    90pct:   5.802
      Max:   6.242
 CPU Load: [in % busy (avg +/- std dev) @ avg frequency, 57 samples]
     cpu0:  48.1 +/-  8.0  @ 1762 MHz
     cpu1:  67.5 +/-  1.6  @ 1665 MHz
     cpu2:  46.0 +/-  6.1  @ 1715 MHz
     cpu3:  50.0 +/-  6.1  @ 1655 MHz
 Overhead: [in % used of total CPU available]
  netperf:  37.9
.............................................................
   Upload:  88.63 Mbps
  Latency: [in msec, 61 pings, 0.00% packet loss]
      Min:   5.179
    10pct:   5.234
   Median:   5.309
      Avg:   5.346
    90pct:   5.446
      Max:   6.029
 CPU Load: [in % busy (avg +/- std dev) @ avg frequency, 58 samples]
     cpu0:   2.1 +/-  1.5  @  937 MHz
     cpu1:   3.0 +/-  1.6  @  893 MHz
     cpu2:   1.3 +/-  0.8  @  911 MHz
     cpu3:   6.5 +/-  2.4  @  888 MHz
 Overhead: [in % used of total CPU available]
  netperf:   1.0
root@OpenWrt:~# 

I note that these results are all IMHO OK, given that a browser really is not a great measurement environment.... (partially on purpose to make it harder to exploit timing related things like e.g. rowhammer and some side-channel cache timing attacks from within the browser).

It depends on whether we are talking about the same thing :wink: What I am talking about that interactive performance (or in modern parlance responsiveness under load) only improves with link capacity up to a certain point. The typical explanation is that interactive use-cases by necessity require back and forth between the local and remote side (and browsing already happens to be effectively an interactive use-case, you request something then read something then click a mostly unpredictable link to request the next thing to read and you are sensitive to the time between clicking and reading) and the amount of data transmitted in these back-and-forth events is typically not all that much. So after reaching a certain link capacity/throughput adding more throughput is not going to help anymore (as the amount of data per transaction is already transmitted fast enough) however the fixed delay between the end-points becomes more important. However that has a lower bound given by the network path distance and the respective speed of information in the used media, all you can do there is make sure that under load that path delay does not increase unduly, which is SQM's main functionality...
This is partly visible in:

e.g. figure 2b showing that measured page load time (as proxy for how long after clicking a link one can expect a readable page) decreases with throughput only up to ~20Mbps, after which further increases in capacity gain very little responsiveness.

Given that I would consider my self to be a small part of the "et. al." to @dtaht I can state, yes, I for one consider client latency/bloat a problem worth tackling :wink:

The thing is, that IMHO we need to work on all areas, but as long e.g. network queueing was really atrocious "fixing" the clients simply ran into the problem that local improvements did not really reflect in internet use-cases... now, not all networking is over the internet, but over the internet all latency problems overlap and it is typically only a few that dominate the experience, once these are improved though, other become visible and hence addressable.

The TCP timestamp option will add another 12 bytes to the TCP header so per packet there will be 12 bytes less for payload data... however IMHO these timestamps are worth these 12 bytes more overhead any old day...

Nope over GPON you likely have 23 byte plus 8 bytes PPPoE... but honestly I have no idea what your ISPS traffic shaper actually accounts for, but it is that number we likely would need to match in your sqm config...

No, luckily the Linux kernel knows about the IP overhead (including timestamps) so for SQM's overhead no need to add it, it really is only the overhead on top of IP that needs to be specified... 44 is not a bad default, after all slightly overestimating the per packet overhead typically has only a very modest cost in potential throughput, while underestimating it can result in a noticeable increase in latency under load.

1 Like