Could you please send me the output of tc -s qdisc show dev eth0?
Hi, output as requested:
root@OpenWrt:~# tc -s qdisc show dev eth0
qdisc mq 0: root
 Sent 58902550 bytes 610414 pkt (dropped 0, overlimits 0 requeues 0)
 backlog 0b 0p requeues 0
qdisc fq_codel 0: parent :8 limit 10240p flows 1024 quantum 1514 target 5.0ms interval 100
.0ms memory_limit 4Mb ecn
 Sent 0 bytes 0 pkt (dropped 0, overlimits 0 requeues 0)
 backlog 0b 0p requeues 0
  maxpacket 0 drop_overlimit 0 new_flow_count 0 ecn_mark 0
  new_flows_len 0 old_flows_len 0
qdisc fq_codel 0: parent :7 limit 10240p flows 1024 quantum 1514 target 5.0ms interval 100
.0ms memory_limit 4Mb ecn
 Sent 0 bytes 0 pkt (dropped 0, overlimits 0 requeues 0)
 backlog 0b 0p requeues 0
  maxpacket 0 drop_overlimit 0 new_flow_count 0 ecn_mark 0
  new_flows_len 0 old_flows_len 0
qdisc fq_codel 0: parent :6 limit 10240p flows 1024 quantum 1514 target 5.0ms interval 100
.0ms memory_limit 4Mb ecn
 Sent 0 bytes 0 pkt (dropped 0, overlimits 0 requeues 0)
 backlog 0b 0p requeues 0
  maxpacket 0 drop_overlimit 0 new_flow_count 0 ecn_mark 0
  new_flows_len 0 old_flows_len 0
qdisc fq_codel 0: parent :5 limit 10240p flows 1024 quantum 1514 target 5.0ms interval 100
.0ms memory_limit 4Mb ecn
 Sent 0 bytes 0 pkt (dropped 0, overlimits 0 requeues 0)
 backlog 0b 0p requeues 0
  maxpacket 0 drop_overlimit 0 new_flow_count 0 ecn_mark 0
  new_flows_len 0 old_flows_len 0
qdisc fq_codel 0: parent :4 limit 10240p flows 1024 quantum 1514 target 5.0ms interval 100
.0ms memory_limit 4Mb ecn
 Sent 0 bytes 0 pkt (dropped 0, overlimits 0 requeues 0)
 backlog 0b 0p requeues 0
  maxpacket 0 drop_overlimit 0 new_flow_count 0 ecn_mark 0
  new_flows_len 0 old_flows_len 0
qdisc fq_codel 0: parent :3 limit 10240p flows 1024 quantum 1514 target 5.0ms interval 100
.0ms memory_limit 4Mb ecn
 Sent 0 bytes 0 pkt (dropped 0, overlimits 0 requeues 0)
 backlog 0b 0p requeues 0
  maxpacket 0 drop_overlimit 0 new_flow_count 0 ecn_mark 0
  new_flows_len 0 old_flows_len 0
qdisc fq_codel 0: parent :2 limit 10240p flows 1024 quantum 1514 target 5.0ms interval 100
.0ms memory_limit 4Mb ecn
 Sent 0 bytes 0 pkt (dropped 0, overlimits 0 requeues 0)
 backlog 0b 0p requeues 0
  maxpacket 0 drop_overlimit 0 new_flow_count 0 ecn_mark 0
  new_flows_len 0 old_flows_len 0
qdisc fq_codel 0: parent :1 limit 10240p flows 1024 quantum 1514 target 5.0ms interval 100
.0ms memory_limit 4Mb ecn
 Sent 58902550 bytes 610414 pkt (dropped 0, overlimits 0 requeues 0)
 backlog 0b 0p requeues 0
  maxpacket 97 drop_overlimit 0 new_flow_count 3 ecn_mark 0
  new_flows_len 0 old_flows_len 0
P.S: Sorry for delayed response, I didn't receive an email which I normally get when somebody replies on the forum.
I forgot I am running SQM on eth1.2, I added it to the sqm.conf file for the chart but still no luck.
root@OpenWrt:~# tc -s qdisc show dev eth1.2
qdisc cake 800b: root refcnt 2 bandwidth 11780Kbit diffserv4 dual-srchost nat nowash no-ac
k-filter split-gso rtt 100.0ms noatm overhead 44
 Sent 435432 bytes 1872 pkt (dropped 0, overlimits 906 requeues 0)
 backlog 0b 0p requeues 0
 memory used: 34304b of 4Mb
 capacity estimate: 11780Kbit
 min/max network layer size:           28 /    1500
 min/max overhead-adjusted size:       72 /    1544
 average network hdr offset:           14

                   Bulk  Best Effort        Video        Voice
  thresh      736248bit    11780Kbit     5890Kbit     2945Kbit
  target         24.7ms        5.0ms        5.0ms        6.2ms
  interval      119.7ms      100.0ms      100.0ms      101.2ms
  pk_delay          0us        615us         33us          7us
  av_delay          0us         64us          1us          0us
  sp_delay          0us          2us          1us          0us
  backlog            0b           0b           0b           0b
  pkts                0         1794           56           22
  bytes               0       428889         5040         1503
  way_inds            0            0            0            0
  way_miss            0          111           56            3
  way_cols            0            0            0            0
  drops               0            0            0            0
  marks               0            0            0            0
  ack_drop            0            0            0            0
  sp_flows            0            1            0            0
  bk_flows            0            1            0            0
  un_flows            0            0            0            0
  max_len             0         1514           90          174
  quantum           300          359          300          300

qdisc ingress ffff: parent ffff:fff1 ----------------
 Sent 560871 bytes 4530 pkt (dropped 0, overlimits 0 requeues 0)
 backlog 0b 0p requeues 0
We got this resolved via DM. But, for the sake of community transparency, the takeaway is just to make sure that the eth... and ifb4eth... interface names in /etc/netdata/charts.d/sqm.conf match the interface names for your particular configuration. 
2 Likes
Thanks for the help. 
1 Like
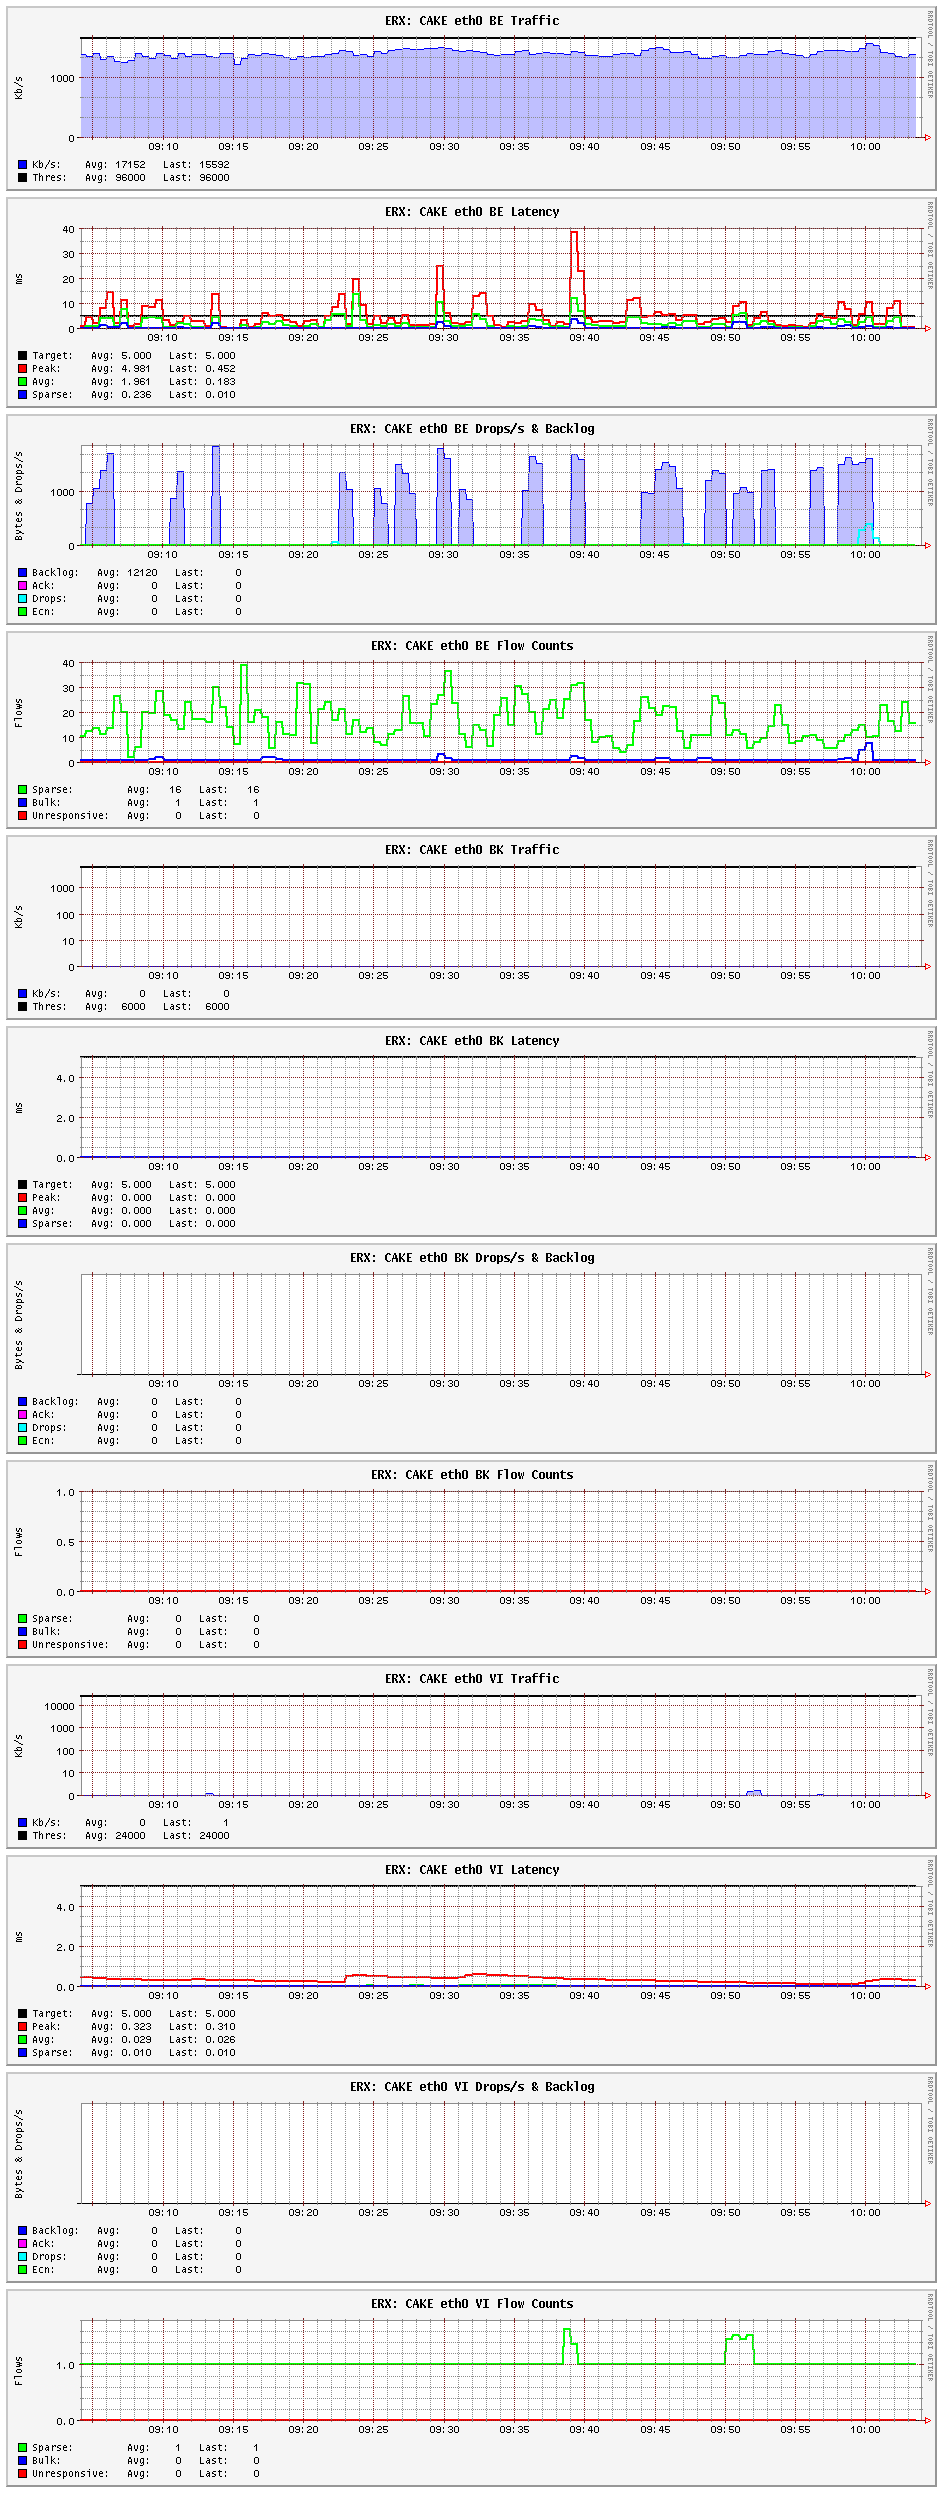
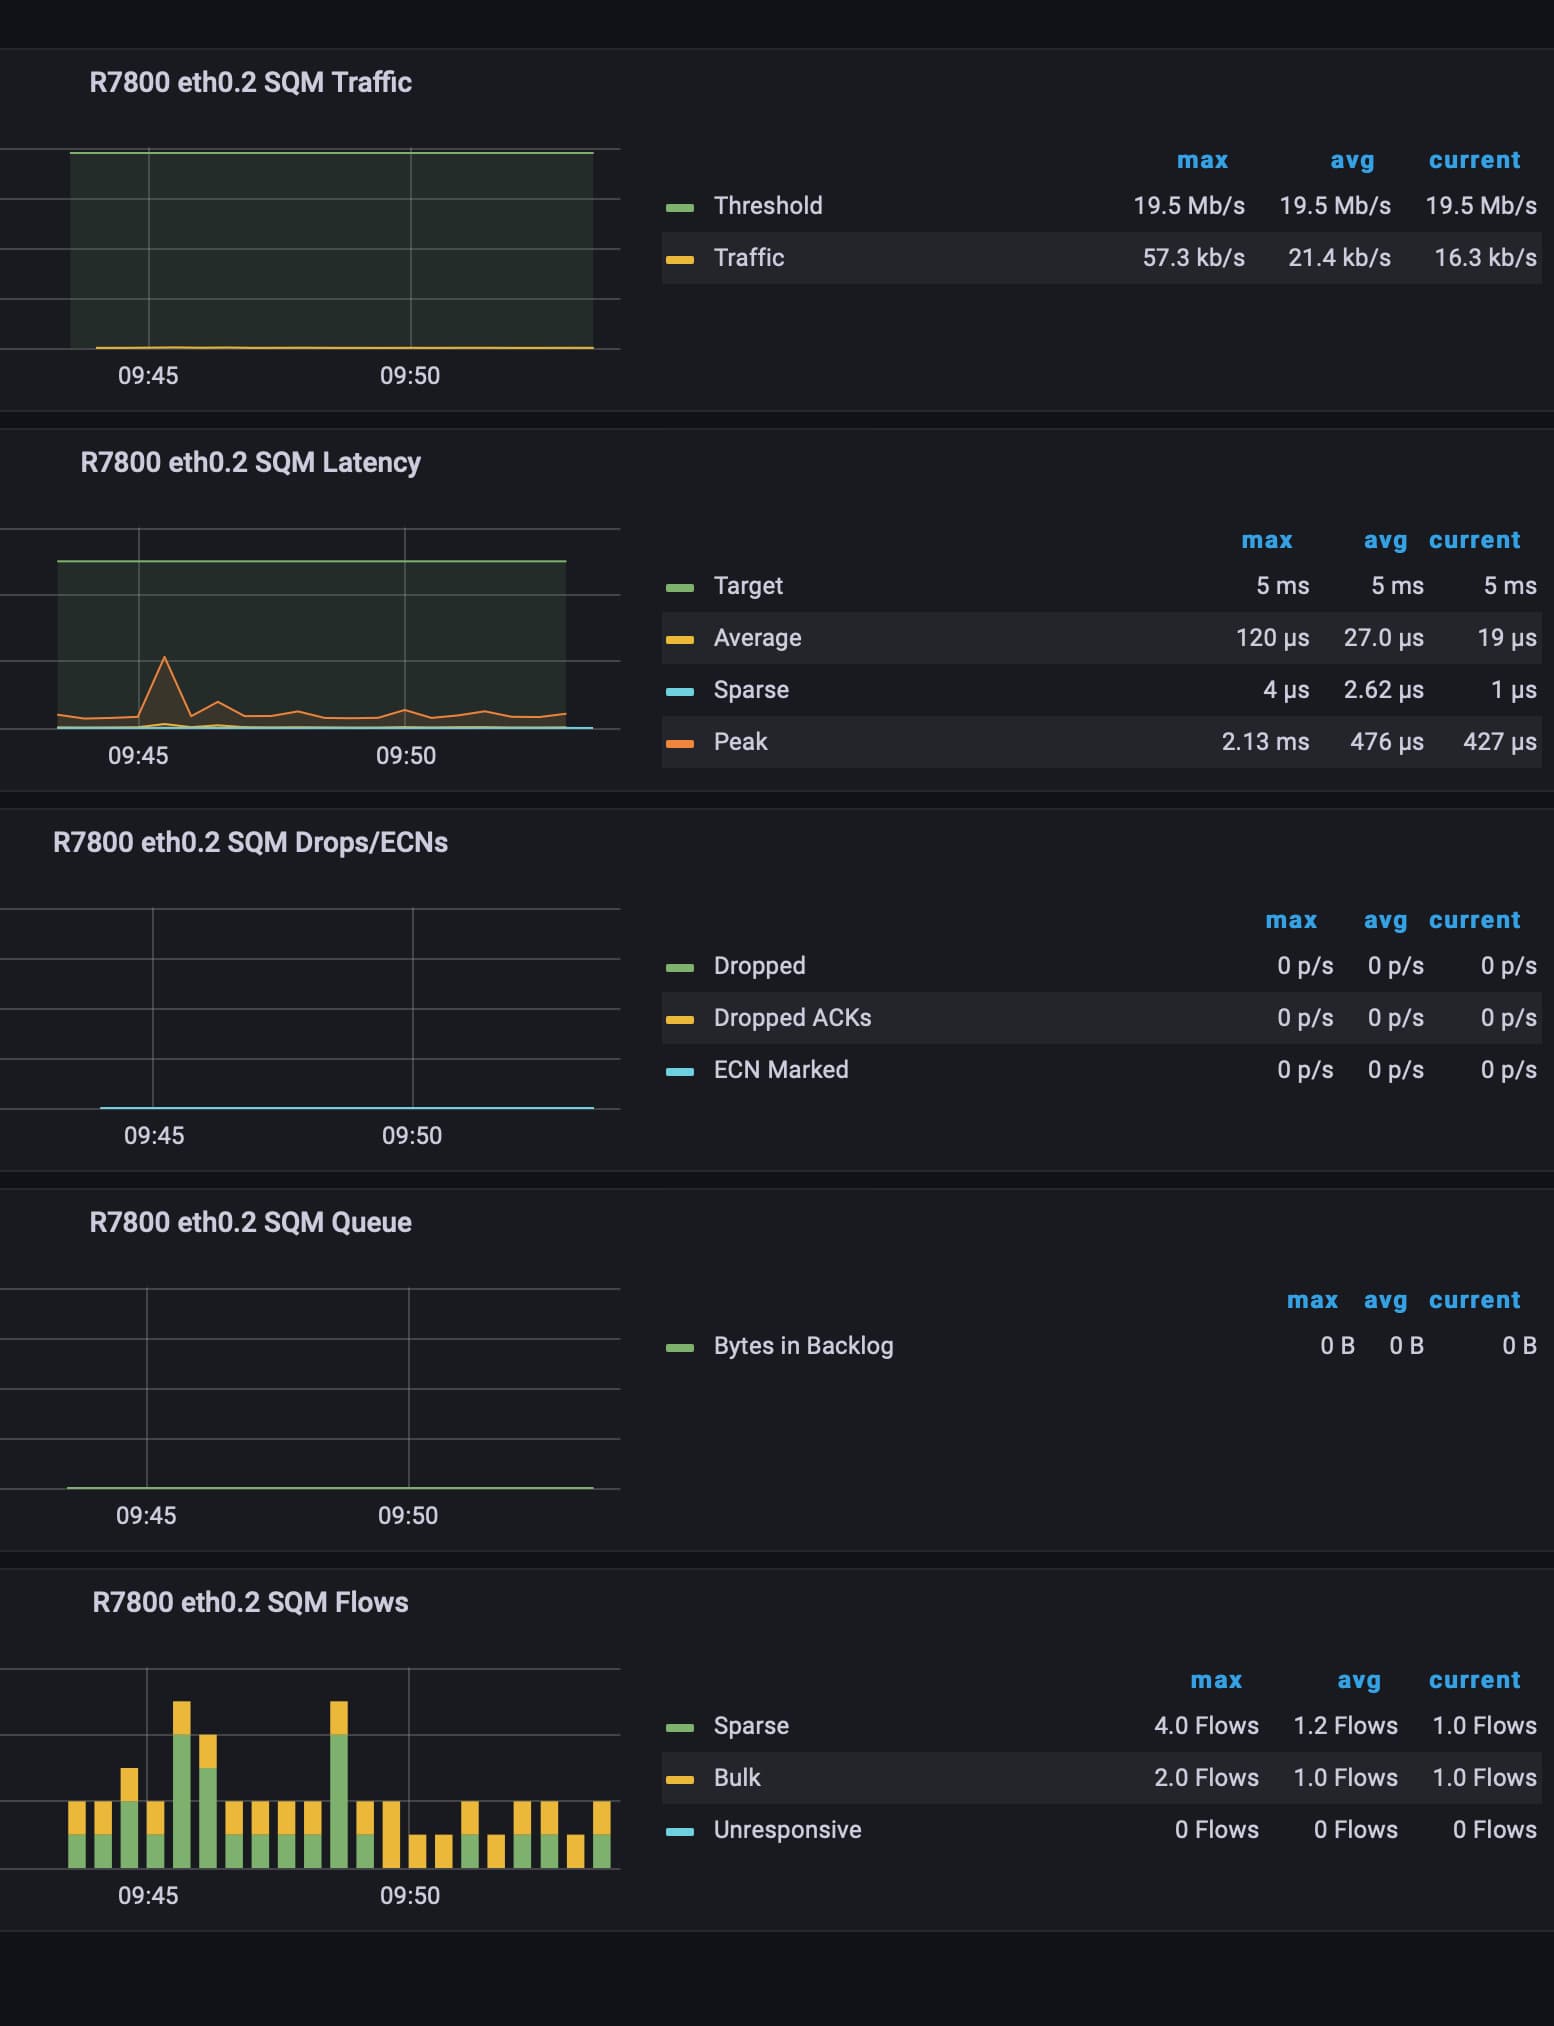
Hi @_FailSafe, I installed the script and it's working.
But I don't know what any of the graphs mean, can you explain? 
1 Like
I submitted a PR in the packages repo here, adding another collector in the prometheus-node-exporter-lua package for SQM (more specifically cake). It's roughly the same as the one written for collectd and it works for diffserv3 and diffserv4. I've created dashboards similar to @_FailSafe's above
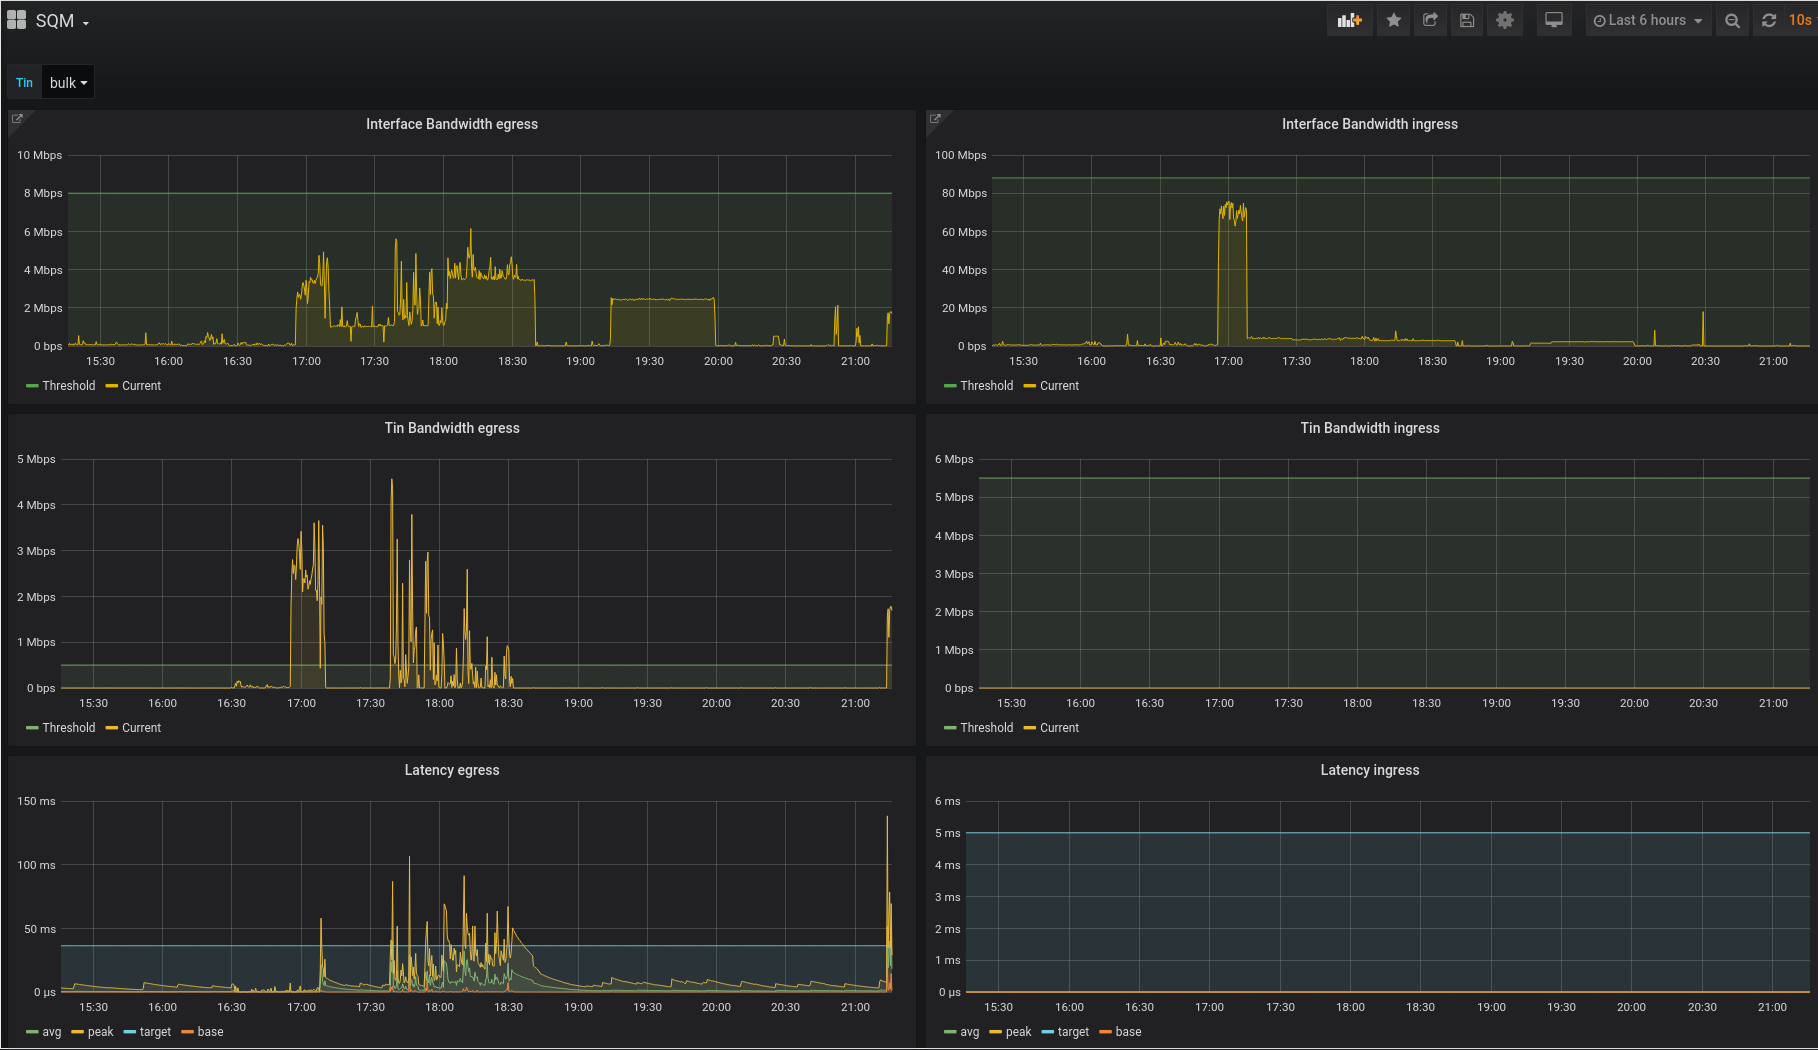
3 Likes
I don't know if I'm doing the right thing by replying here, by the way, this plugin doesn't work on my InfluxDB-Grafana setup.
I don't have Grafana data from SQM stats, using the SQM dashboard as default, all the queries are empty: Screenshot. All the other stats are working, just the SQM queries aren't there...
There's no "sqm_xyz" value in my DB, why ? I have the same graph on the LuCI interface.
Pictures explain better:
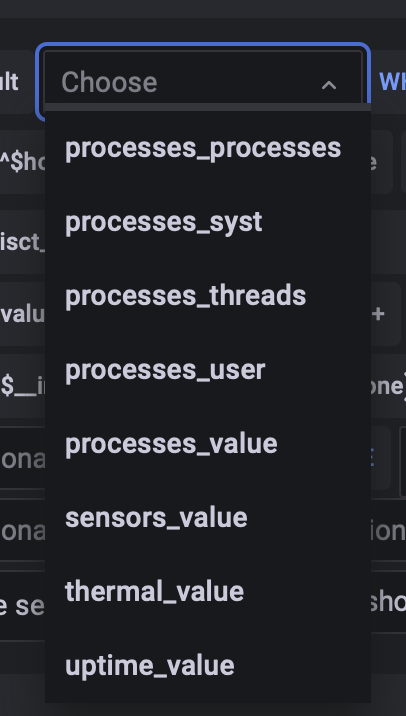
Thanks (if it's wrong to reply here, I'll create a new thread)
I've found my trouble, in your linked "tutorial" the InfluxDB database entries types.db doesn't have the SQM value.
Can someone who are using InfluxDB upload or paste here his /usr/local/share/collectd/types.db? Or just he SQM values.
Thanks a lot!
EDIT: damn, what a stupid! I just copied the db from my router in /usr/share/collectd/types.db to my InfluxDB server (same folder) and now it works perfectly ![]()
1 Like
Selfishly, I guess, I'd really like a good hires snapshot of that while under stress, like having a backlog and drops and marks... to use in some documentation elsewhere.
Sorry but I don't understand well what you mean (I'm not english native) or how I can help you. You can use the same setting I'm using and use Grafana to keep the backlog and re-use where you want.
I'm writing a post for my blog about my Grafana + Prometheus setup (also using the Grafana Cloud option to check your stat without expose your "LAN things" outside in the wild ![]() ), if you're interested I can send it to you when it will be online.
), if you're interested I can send it to you when it will be online.
Preview

2 Likes
Did you end up posting this anywhere?
Oh, yes, I wrote 3-4 articles in the meantime...
3 Likes
And you made hackernews today. https://giuliomagnifico.blog/networking/2023/01/05/home-network_v4.html Nobody noticed the SQM part. LOVE that you run openwrt on your switches, too!
6 Likes
Oh thanks, yes I saw on HN and I tried to reply to the comments (I spent lots of time in writing the post)! I'm not an expert but I'm glad to help with what I know.
3 Likes
Monitoring script (sqm_collectd.sh) does not work as I only have cake on ingress:
root@OpenWrt:/var/run/sqm# tc -s -j qdisc show dev br-lan
[{"kind":"noqueue","handle":"0:","root":true,"refcnt":2,"options":{},"bytes":0,"packets":0,"drops":0,"overlimits":0,"requeues":0,"backlog":0,"qlen":0},{"kind":"ingress","handle":"ffff:","parent":"ffff:fff1","options":{},"bytes":5450731,"packets":41699,"drops":0,"overlimits":0,"requeues":0,"backlog":0,"qlen":0}]
How can I modify the script to get cake stats from ingress side?
EDIT: it looks like cake is only applied when egress is non zero:
root@OpenWrt:/usr/libexec/collectd# tc -s -j qdisc show dev eth1
[{"kind":"cake","handle":"8018:","root":true,"refcnt":2,"options":{"bandwidth":3125000,"diffserv":"diffserv3","flowmode":"triple-isolate","nat":false,"wash":false,"ingress":false,"ack-filter":"disabled","split_gso":true,"rtt":100000,"raw":true,"overhead":0,"fwmark":"0"},"bytes":102621,"packets":953,"drops":0,"overlimits":10,"requeues":0,"backlog":0,"qlen":0,"memory_used":10048,"memory_limit":4194304,"capacity_estimate":3125000,"min_network_size":42,"max_network_size":1514,"min_adj_size":42,"max_adj_size":1514,"avg_hdr_offset":14,"tins":[{"threshold_rate":195312,"sent_bytes":0,"backlog_bytes":0,"target_us":11627,"interval_us":106627,"peak_delay_us":0,"avg_delay_us":0,"base_delay_us":0,"sent_packets":0,"way_indirect_hits":0,"way_misses":0,"way_collisions":0,"drops":0,"ecn_mark":0,"ack_drops":0,"sparse_flows":0,"bulk_flows":0,"unresponsive_flows":0,"max_pkt_len":0,"flow_quantum":300},{"threshold_rate":3125000,"sent_bytes":102579,"backlog_bytes":0,"target_us":5000,"interval_us":100000,"peak_delay_us":615,"avg_delay_us":81,"base_delay_us":33,"sent_packets":952,"way_indirect_hits":0,"way_misses":44,"way_collisions":0,"drops":0,"ecn_mark":0,"ack_drops":0,"sparse_flows":1,"bulk_flows":1,"unresponsive_flows":0,"max_pkt_len":6702,"flow_quantum":762},{"threshold_rate":781250,"sent_bytes":42,"backlog_bytes":0,"target_us":5000,"interval_us":100000,"peak_delay_us":7,"avg_delay_us":0,"base_delay_us":0,"sent_packets":1,"way_indirect_hits":0,"way_misses":1,"way_collisions":0,"drops":0,"ecn_mark":0,"ack_drops":0,"sparse_flows":1,"bulk_flows":0,"unresponsive_flows":0,"max_pkt_len":42,"flow_quantum":300}]}]
root@OpenWrt:/usr/libexec/collectd#
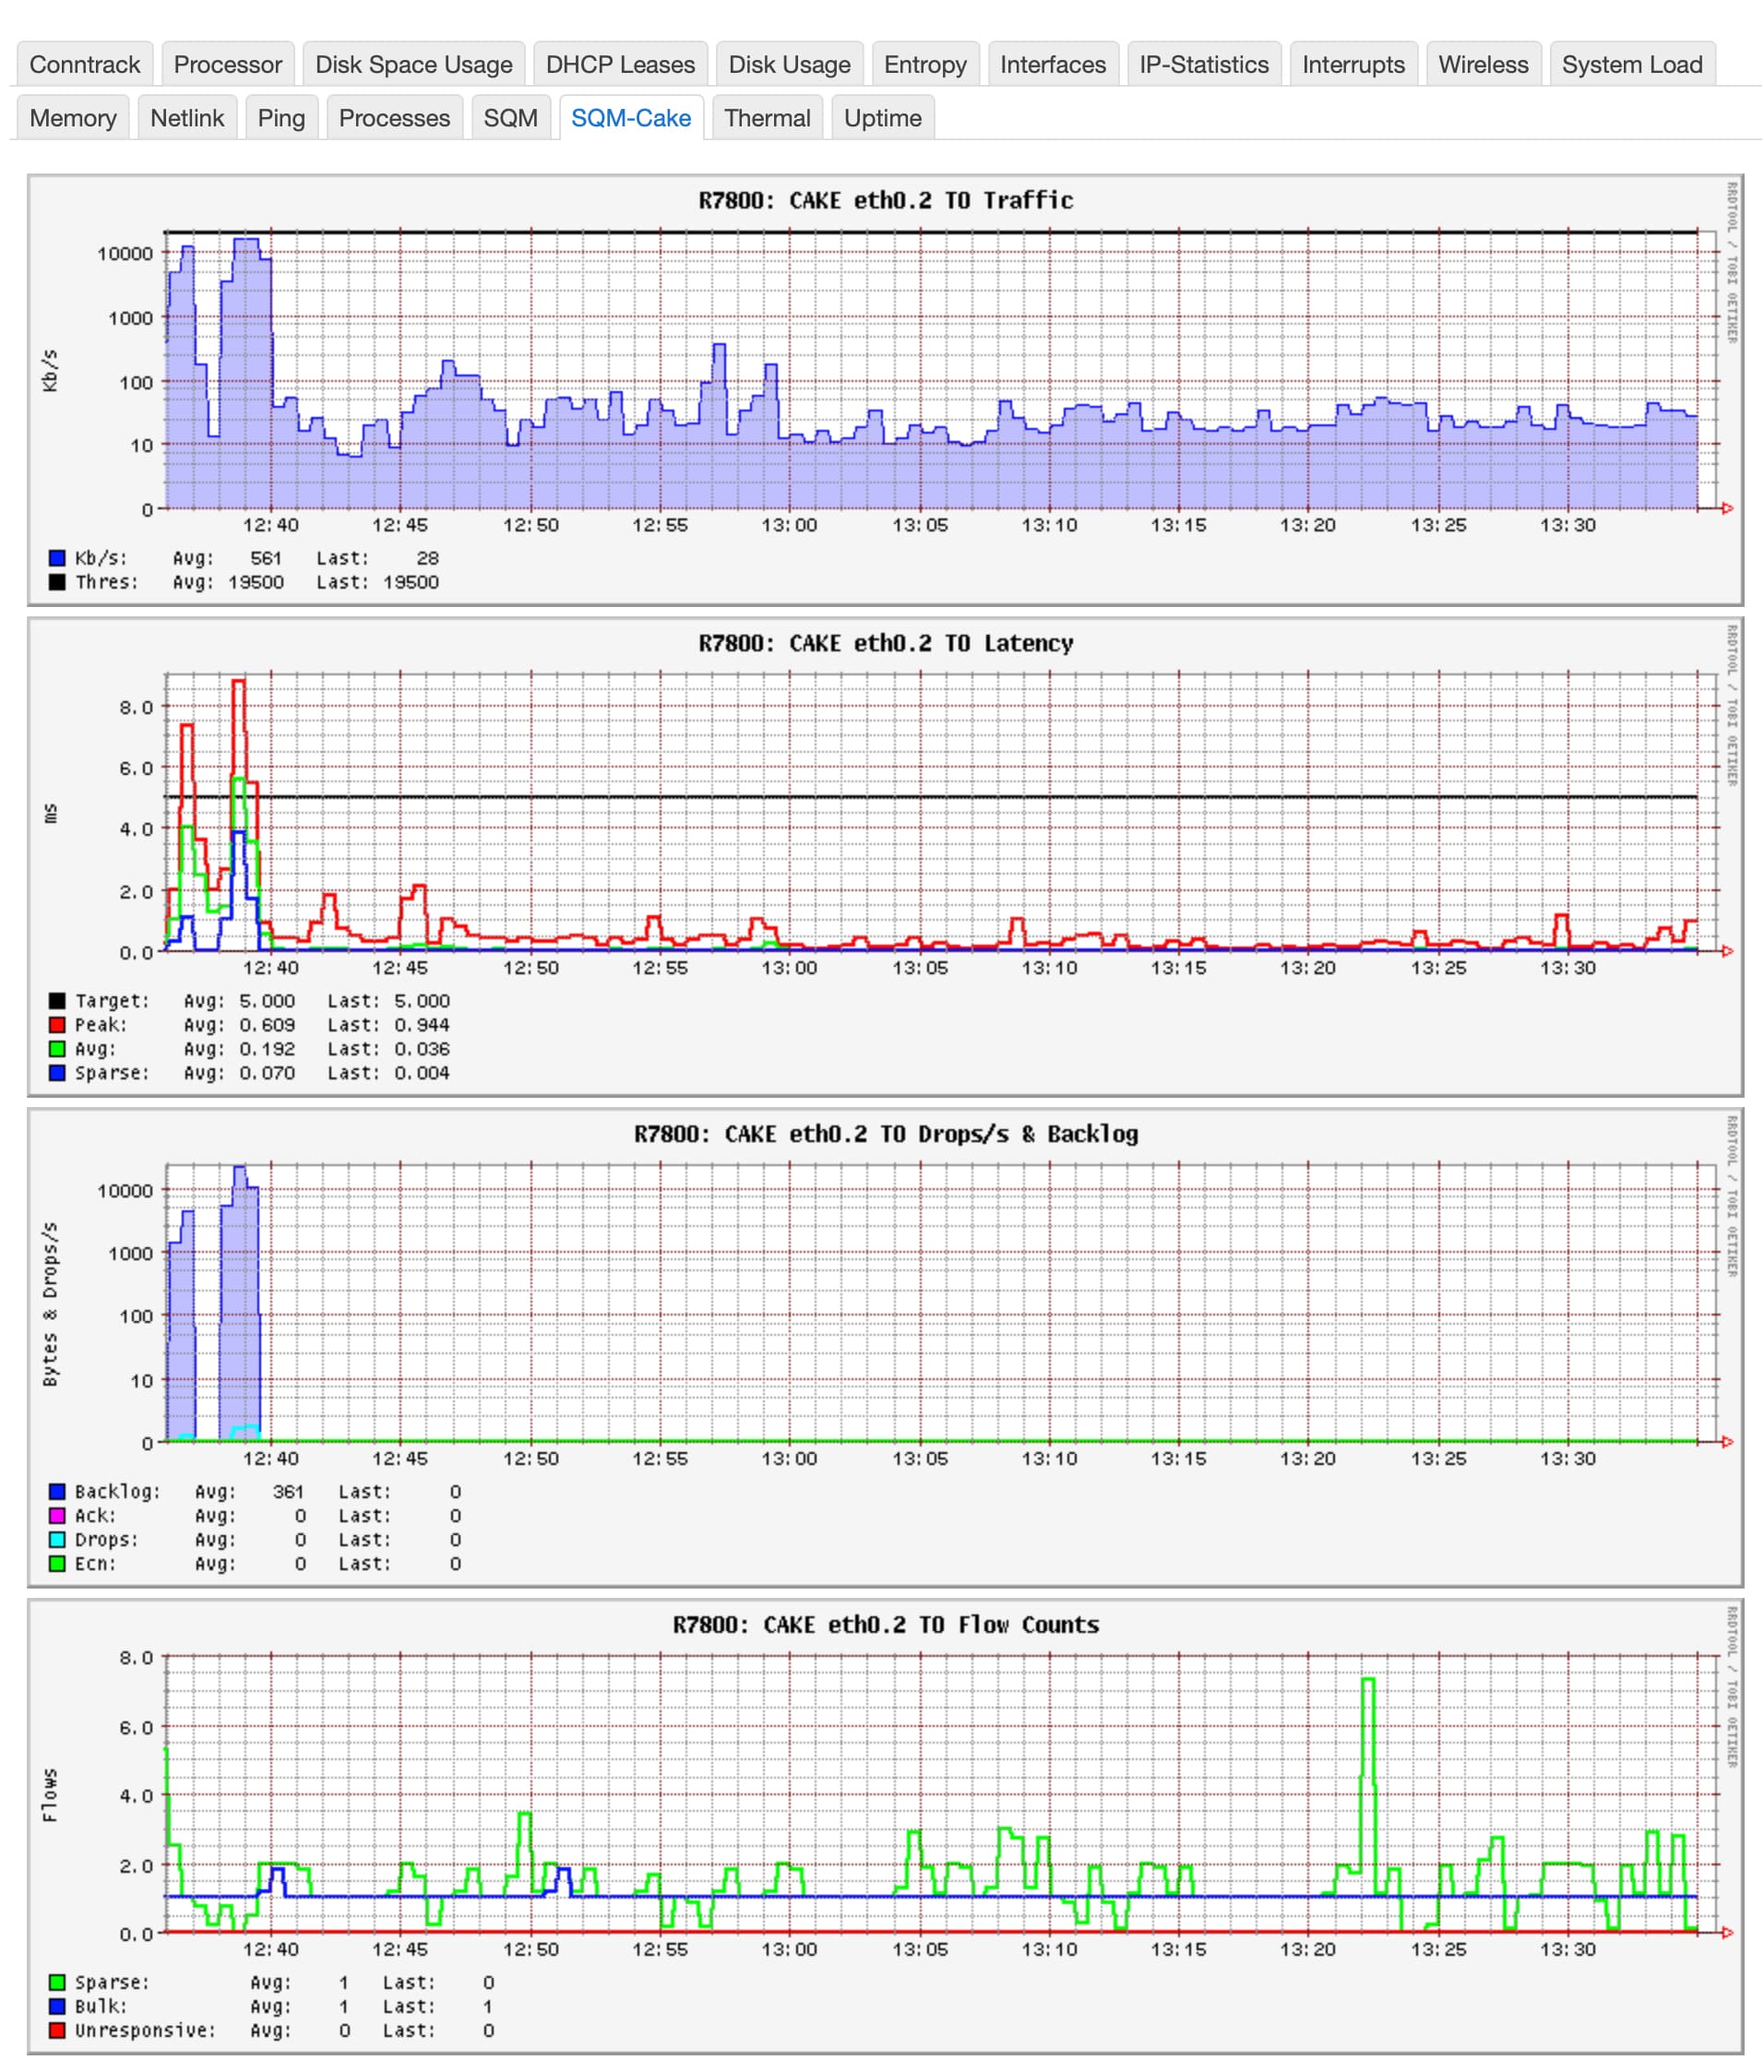
where are the luci collectd-mod-sqm graphs?
Firmware Version OpenWrt 23.05.0 r23497-6637af95aa / LuCI openwrt-23.05 branch git-23.292.78378-27fb6e5
Kernel Version 5.15.134
In the normal LuCI stats graph, but you need to configure the exec plugin, too.
(And make sure that it scrapes the correct interface, eth0.2 in my case)
See old example in
(Note that all references to software versions are outdated in the year 2020 post. The current versions are naturally ok.)
1 Like
Thanks!
had to also do:
service collectd stop
service luci_statistics stop
service luci_statistics start
service collectd start
1 Like