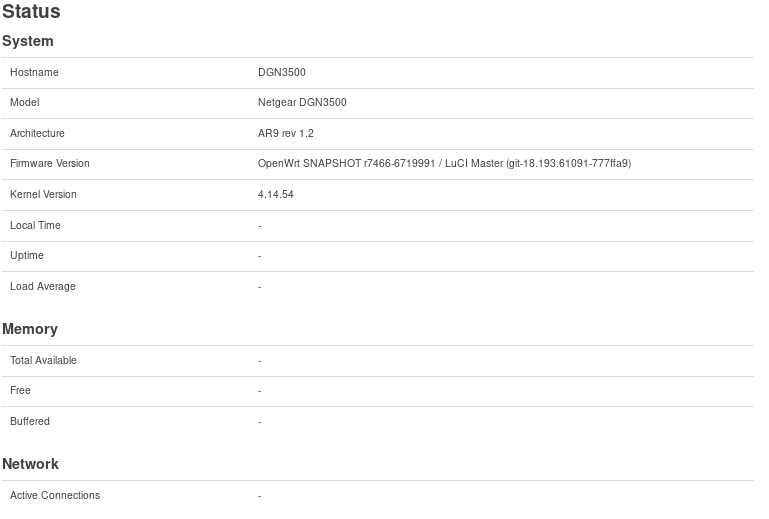
Please PM the exact contents of http://192.168.1.1/cgi-bin/luci/admin/status/overview?status=1
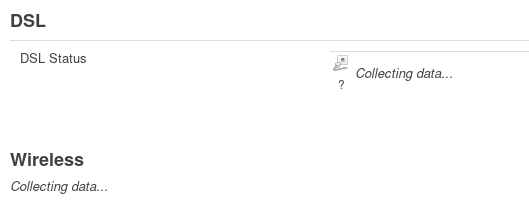
Also some fields are frozen at "collecting data"
Please open your browser console (F12), navigate to the network tab and look for errors. The output you've sent me looks okay.
Hi @jow,
This is the nework error I observed it keeps repeating.
TypeError: info is null[Learn More] overview:105:8
http://192.168.1.2/cgi-bin/luci/admin/status/overview:105:8
XHR/this.get/xhr.onreadystatechange
http://192.168.1.2/luci-static/resources/xhr.js:76:5
http://192.168.1.2/cgi-bin/luci/admin/status/overview:105:8 => var ifc = info.wan || {};
http://192.168.1.2/luci-static/resources/xhr.js:76:5 => callback(xhr, json, Date.now() - ts);
Can you edit /var/www/luci-static/resources/xhr.js on the device and add a change like below, then check the debug console again?
--- a/modules/luci-base/htdocs/luci-static/resources/xhr.js
+++ b/modules/luci-base/htdocs/luci-static/resources/xhr.js
@@ -69,9 +69,13 @@ XHR = function()
                                                json = JSON.parse(xhr.responseText);
                                        }
                                        catch(e) {
+                                               console.debug('Parsing JSON failed: ' + e);
                                                json = null;
                                        }
                                }
+                               else {
+                                       console.debug('Unexpected Content-Type: ' + xhr.getResponseHeader("Content-Type"));
+                               }

                                callback(xhr, json, Date.now() - ts);
                        }
Edit: don't forget to clear the browser cache afterwards
Unexpected Content-Type: null xhr.js:77:40
[Show/hide message details.] TypeError: info is null[Learn More] luci:105:8
http://192.168.1.2/cgi-bin/luci/:105:8
XHR/this.get/xhr.onreadystatechange
http://192.168.1.2/luci-static/resources/xhr.js:80:5
Seems the status requests are not properly made by the browser or prematurely cancelled or something. I have no idea why though
Thanks @jow
I tried a few different browsers all with the same issue.
Can you also add another console.debug(Date.now() - ts); statement? I wonder if the requestes are cancelled due to timeouts.
4999 xhr.js:77:9
Unexpected Content-Type: null
I see, so a timeout issue.
Can you run time /etc/init.d/dsl_control lucistat via SSH and report the resulting numbers?
# time /etc/init.d/dsl_control
 lucistat
local dsl={}
dsl.atuc_vendor_id="Infineon 113.185"
dsl.atuc_system_vendor_id="00,00,00,00,00,00,00,00"
dsl.chipset="Ifx-AR9"
dsl.firmware_version="4.4.4.0.0.1"
dsl.api_version="3.24.4.4"
dsl.xtse1=0x0
dsl.xtse2=0x0
dsl.xtse3=0x0
dsl.xtse4=0x0
dsl.xtse5=0x0
dsl.xtse6=0x1
dsl.xtse7=0x0
dsl.xtse8=0x0
dsl.xtse_s="0x0, 0x0, 0x0, 0x0, 0x0, 0x1, 0x0, 0x0"
dsl.annex_s="A"
dsl.line_mode_s="G.992.5 (ADSL2+)"
dsl.profile=nil
dsl.profile_s=""
dsl.line_state_num=0x801
dsl.line_state_detail="showtime_tc_sync"
dsl.line_state="UP"
dsl.errors_fec_near=20336
dsl.errors_fec_far=0
dsl.errors_es_near=18
dsl.errors_es_far=0
dsl.errors_ses_near=0
dsl.errors_ses_far=0
dsl.errors_loss_near=0
dsl.errors_loss_far=1
dsl.errors_uas_near=46
dsl.errors_uas_far=46
dsl.errors_hec_near=265
dsl.errors_hec_far=7
dsl.errors_crc_p_near=nil
dsl.errors_crc_p_far=nil
dsl.errors_crcp_p_near=nil
dsl.errors_crcp_p_far=nil
dsl.power_mode_num=0
dsl.power_mode_s="L0 - Synchronized"
dsl.latency_num_down="7.0 ms"
dsl.latency_num_up="1.25 ms"
dsl.latency_s_down="Interleave"
dsl.latency_s_up="Interleave"
dsl.data_rate_down=18859808
dsl.data_rate_up=1020958
dsl.data_rate_down_s="18.859 Mb"
dsl.data_rate_up_s="1.020 Mb"
dsl.line_attenuation_down="16.8"
dsl.line_attenuation_up="8.8"
dsl.noise_margin_down="6.0"
dsl.noise_margin_up="13.3"
dsl.signal_attenuation_down="15.9"
dsl.signal_attenuation_up="9.5"
dsl.actatp_down="16.3"
dsl.actatp_up="11.9"
dsl.max_data_rate_down=18852000
dsl.max_data_rate_up=1224000
dsl.max_data_rate_down_s="18.852 Mb"
dsl.max_data_rate_up_s="1.224 Mb"
dsl.line_uptime=5698
dsl.line_uptime_s="1h 34m 58s"
return dsl
real	0m 6.37s
user	0m 0.91s
sys	0m 1.44s
Also I doubled the timeout and it worked:
                if (!isNaN(timeout))
                        xhr.timeout = 2*timeout;
Load average with autorefresh OFF
$ uptime
00:55:49 up 1:49, load average: 0.54, 1.32, 1.24
Load average with autorefresh ON
$ uptime
01:00:34 up 1:53, load average: 2.83, 2.02, 1.52
Thank you so much for helping in tracking this down. I came to the same conclusion that we should increase the allowed timeout to something like 3 to 5 times the poll interval - the code already skips iteration if a request is still running so that should be fine.
As a bonus, we tracked the long delay down to the DSL status script, this is something I should look into separately.