[Solved] Consistent speed drops using OpenWrt router vs direct PPPoE connection

Update: seems like it is fixed in latest snapshots since February 2019.

Hello! Sadly I couldn't find the explanation of my problem on the forums or elsewhere so I have to make a new thread.

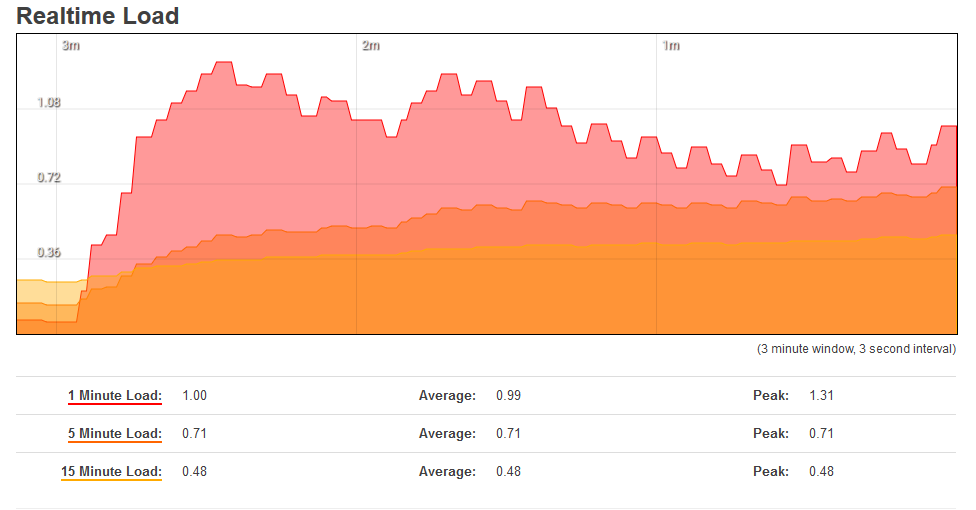
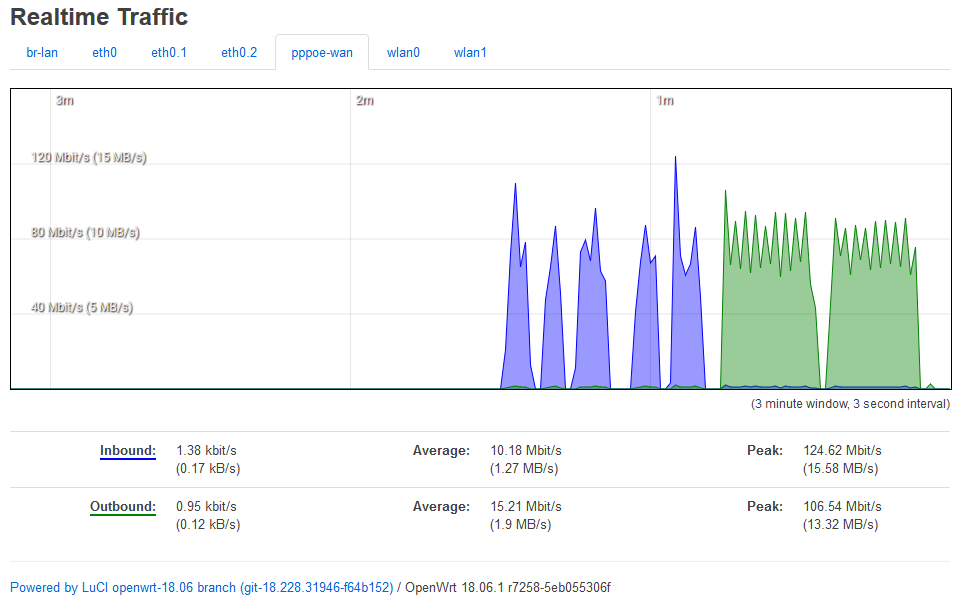
While testing new OpenWRT installation from PC using a wired connection to the router I notice huge dips (from 75 Mbps down to 700 Kbps) in download speed in constant intervals. It is 100% reproducible. I also saw it when using OpenWrtScripts' betterspeedtest.sh which proved that it is not a PC<->Router cable problem (I included a screenshot of luci network graph during this load).

These dips look absolutely the same with SQM enabled either at 10/10 Mbps or 65/65 Mbps.

When these dips occur there's also UDP packet loss that is immediately noticeable in VOIP applications etc.

I noticed that my router (MT7621) supports new "Hardware NAT offloading" and while this does seem to improve speed consistency the dips are still there.

I'm not quite sure what hardware does my ISP use in the building but all I get is an ethernet cable using PPPoE.

When plugging ISP ethernet directly into PC this problem does not occur.

OpenWrtScripts getstats.sh

dslreports tests

ethernet directly into pc:

openwrt router, sqm disabled:

openwrt router, sqm enabled 65/65 Mbps:

openwrt router, sqm disabled, NAT hardware offloading

LuCI network graph under load

$ cat /etc/config/network
config interface 'loopback'
        option ifname 'lo'
        option proto 'static'
        option ipaddr '127.0.0.1'
        option netmask '255.0.0.0'

config globals 'globals'
        option ula_prefix 'fd11:2537:623e::/48'

config interface 'lan'
        option type 'bridge'
        option ifname 'eth0.1'
        option proto 'static'
        option ipaddr '192.168.1.1'
        option netmask '255.255.255.0'
        option ip6assign '60'

config device 'lan_dev'
        option name 'eth0.1'
        option macaddr '40:31:3c:03:a8:dc'

config interface 'wan'
        option ifname 'eth0.2'
        option proto 'pppoe'
        option username '***'
        option password '***'
        option pppd_options 'mtu 1492'

config interface 'wan6'
        option ifname 'eth0.2'
        option proto 'dhcpv6'

config switch
        option name 'switch0'
        option reset '1'
        option enable_vlan '1'

config switch_vlan
        option device 'switch0'
        option vlan '1'
        option ports '2 3 6t'

config switch_vlan
        option device 'switch0'
        option vlan '2'
        option ports '1 6t'

Thanks in an advance for any help. Please tell me if I can provide any additional information to help troubleshoot this.

Try disabling all wifi radios in the router, I have seen effects of periodic wifi overload on wired connections in the past. This assumes that your router does wifi and is not a solution, just a diagnostic test....

DIsabled wifi using wifi down command.

ifconfig after wifi down
root@OpenWrt:~# ifconfig
br-lan    Link encap:Ethernet  HWaddr 40:31:3C:03:A8:DC
          inet addr:192.168.1.1  Bcast:192.168.1.255  Mask:255.255.255.0
          inet6 addr: fd11:2537:623e::1/60 Scope:Global
          inet6 addr: fe80::4231:3cff:fe03:a8dc/64 Scope:Link
          UP BROADCAST RUNNING MULTICAST  MTU:1500  Metric:1
          RX packets:350542 errors:0 dropped:0 overruns:0 frame:0
          TX packets:1042083 errors:0 dropped:0 overruns:0 carrier:0
          collisions:0 txqueuelen:1000
          RX bytes:71006222 (67.7 MiB)  TX bytes:1269030388 (1.1 GiB)

eth0      Link encap:Ethernet  HWaddr 40:31:3C:03:A8:DB
          inet6 addr: fe80::4231:3cff:fe03:a8db/64 Scope:Link
          UP BROADCAST RUNNING MULTICAST  MTU:1500  Metric:1
          RX packets:3611462 errors:0 dropped:5 overruns:0 frame:0
          TX packets:3070981 errors:0 dropped:0 overruns:0 carrier:0
          collisions:0 txqueuelen:1000
          RX bytes:3396333715 (3.1 GiB)  TX bytes:2464601108 (2.2 GiB)
          Interrupt:20

eth0.1    Link encap:Ethernet  HWaddr 40:31:3C:03:A8:DC
          UP BROADCAST RUNNING MULTICAST  MTU:1500  Metric:1
          RX packets:225432 errors:0 dropped:14 overruns:0 frame:0
          TX packets:376971 errors:0 dropped:0 overruns:0 carrier:0
          collisions:0 txqueuelen:1000
          RX bytes:60794121 (57.9 MiB)  TX bytes:311294993 (296.8 MiB)

eth0.2    Link encap:Ethernet  HWaddr 40:31:3C:03:A8:DB
          inet6 addr: fe80::4231:3cff:fe03:a8db/64 Scope:Link
          UP BROADCAST RUNNING MULTICAST  MTU:1500  Metric:1
          RX packets:1029038 errors:0 dropped:48 overruns:0 frame:0
          TX packets:348984 errors:0 dropped:0 overruns:0 carrier:0
          collisions:0 txqueuelen:1000
          RX bytes:1251023500 (1.1 GiB)  TX bytes:75205041 (71.7 MiB)

lo        Link encap:Local Loopback
          inet addr:127.0.0.1  Mask:255.0.0.0
          inet6 addr: ::1/128 Scope:Host
          UP LOOPBACK RUNNING  MTU:65536  Metric:1
          RX packets:24600 errors:0 dropped:0 overruns:0 frame:0
          TX packets:24600 errors:0 dropped:0 overruns:0 carrier:0
          collisions:0 txqueuelen:1000
          RX bytes:2479298 (2.3 MiB)  TX bytes:2479298 (2.3 MiB)

pppoe-wan Link encap:Point-to-Point Protocol
          inet addr:***  P-t-P:***  Mask:255.255.255.255
          UP POINTOPOINT RUNNING NOARP MULTICAST  MTU:1492  Metric:1
          RX packets:986493 errors:0 dropped:0 overruns:0 frame:0
          TX packets:319801 errors:0 dropped:0 overruns:0 carrier:0
          collisions:0 txqueuelen:3
          RX bytes:1241173395 (1.1 GiB)  TX bytes:67259665 (64.1 MiB)

The results look the same. I have recorded a video of a speedtest with top -d 1 by the side, doesn't look like router is under any load.

This speedtest was 60s duration download and upload. Other settings are matched with your recommended settings for dslreports.

(Cannot embed bbcode speedtest because dslreports stopped responding to me in the middle of writing this).

Thanks for the video, it is quite interesting to see that when ever the bandwidth tanks, sirq goes to 0. I am sure that is diagnostic of something although I am not sure yet what this is diagnostic about. I do wonder though how CPU frequency & temperature develop during the speedtest (by the way, nifty trick to record video of the speedtest and top -d 1 output next to each other).

The router is Xiaomi Mi WiFi R3G. I didn't see any other owner of this router complain about this problem.

Regarding temperatures it seems that MT7621 doesn't have a CPU temperature sensor?

Regarding CPU frequency it seems that in the official build that I installed the CPU frequency scaling is not installed so there's no /sys/devices/system/cpu/cpu0/cpufreq/ directory. I guess that means it always operates at max frequency?

$ cat /proc/cpuinfo
system type             : MediaTek MT7621 ver:1 eco:3
machine                 : Xiaomi Mi Router 3G
processor               : 0
cpu model               : MIPS 1004Kc V2.15
BogoMIPS                : 584.90
wait instruction        : yes
microsecond timers      : yes
tlb_entries             : 32
extra interrupt vector  : yes
hardware watchpoint     : yes, count: 4, address/irw mask: [0x0ffc, 0x0ffc, 0x0ffb, 0x0ffb]
isa                     : mips1 mips2 mips32r1 mips32r2
ASEs implemented        : mips16 dsp mt
shadow register sets    : 1
kscratch registers      : 0
package                 : 0
core                    : 0
VPE                     : 0
VCED exceptions         : not available
VCEI exceptions         : not available

processor               : 1
cpu model               : MIPS 1004Kc V2.15
BogoMIPS                : 584.90
wait instruction        : yes
microsecond timers      : yes
tlb_entries             : 32
extra interrupt vector  : yes
hardware watchpoint     : yes, count: 4, address/irw mask: [0x0ffc, 0x0ffc, 0x0ffb, 0x0ffb]
isa                     : mips1 mips2 mips32r1 mips32r2
ASEs implemented        : mips16 dsp mt
shadow register sets    : 1
kscratch registers      : 0
package                 : 0
core                    : 0
VPE                     : 1
VCED exceptions         : not available
VCEI exceptions         : not available

processor               : 2
cpu model               : MIPS 1004Kc V2.15
BogoMIPS                : 584.90
wait instruction        : yes
microsecond timers      : yes
tlb_entries             : 32
extra interrupt vector  : yes
hardware watchpoint     : yes, count: 4, address/irw mask: [0x0ffc, 0x0ffc, 0x0ffb, 0x0ffb]
isa                     : mips1 mips2 mips32r1 mips32r2
ASEs implemented        : mips16 dsp mt
shadow register sets    : 1
kscratch registers      : 0
package                 : 0
core                    : 1
VPE                     : 0
VCED exceptions         : not available
VCEI exceptions         : not available

processor               : 3
cpu model               : MIPS 1004Kc V2.15
BogoMIPS                : 584.90
wait instruction        : yes
microsecond timers      : yes
tlb_entries             : 32
extra interrupt vector  : yes
hardware watchpoint     : yes, count: 4, address/irw mask: [0x0ffc, 0x0ffc, 0x0ffb, 0x0ffb]
isa                     : mips1 mips2 mips32r1 mips32r2
ASEs implemented        : mips16 dsp mt
shadow register sets    : 1
kscratch registers      : 0
package                 : 0
core                    : 1
VPE                     : 1
VCED exceptions         : not available
VCEI exceptions         : not available
Load avg graph

image

I'm not yet familiar with debugging MIPS architecture on Linux so would really appreciate any pointers on how I should proceed.

Mmmh, I had assumed a multicore arm, but at least you have a quad-core, so there might still be issues there. Quadcore also means, that in top idle 75% indicates that potentially a full core is saturated. There was one post here where some one took heroic measures to get his router instrumented and could show CPU stalls short enough to not show up noticeably in top (with the 1 second refresh rate) but did affect the bandwidth. I have no real clue how this instrumentation was done though.

Actually, the reason for the bandwidth drops is quite simple, I just didn't notice it.

This is the kernel log:

Sun Oct 14 17:20:28 2018 kern.info kernel: [  411.190779] mtk_soc_eth 1e100000.ethernet eth0: port 1 link down
Sun Oct 14 17:20:31 2018 kern.info kernel: [  413.596005] mtk_soc_eth 1e100000.ethernet eth0: port 1 link up
Sun Oct 14 17:20:42 2018 kern.info kernel: [  424.864408] mtk_soc_eth 1e100000.ethernet eth0: port 1 link down
Sun Oct 14 17:20:44 2018 kern.info kernel: [  427.330693] mtk_soc_eth 1e100000.ethernet eth0: port 1 link up
Sun Oct 14 17:20:52 2018 kern.info kernel: [  435.123194] mtk_soc_eth 1e100000.ethernet eth0: port 1 link down
Sun Oct 14 17:20:56 2018 kern.info kernel: [  438.895475] mtk_soc_eth 1e100000.ethernet eth0: port 1 link up
Sun Oct 14 17:21:02 2018 kern.info kernel: [  444.620327] mtk_soc_eth 1e100000.ethernet eth0: port 1 link down
Sun Oct 14 17:21:04 2018 kern.info kernel: [  447.125296] mtk_soc_eth 1e100000.ethernet eth0: port 1 link up
Sun Oct 14 17:21:12 2018 kern.info kernel: [  454.637540] mtk_soc_eth 1e100000.ethernet eth0: port 1 link down
Sun Oct 14 17:21:14 2018 kern.info kernel: [  457.080104] mtk_soc_eth 1e100000.ethernet eth0: port 1 link up
Sun Oct 14 17:21:31 2018 kern.info kernel: [  474.152008] mtk_soc_eth 1e100000.ethernet eth0: port 1 link down
Sun Oct 14 17:21:35 2018 kern.info kernel: [  477.894892] mtk_soc_eth 1e100000.ethernet eth0: port 1 link up

So for some reason link gets restarted and in this moment speed drops.

Now, what I don't understand is this. It says eth0.1 link goes down and up, which according to wiki is vlan1 (eth0.1) LAN ports (1 & 2). So I thought sure, maybe the cable between the router and PC is bad, but then I tried running speedtest directly from the router and the result is the same - speed drops, eth0.1 gets restarted, which are LAN ports. How does that affect WAN performance? Or I guess it affects the whole physical device eth0?

And by the way I still tried 2 new patch-cords just in case and it didn't fix the problem.

Relevant bug report: https://bugs.openwrt.org/index.php?do=details&task_id=1449

It is saying that eth0 is going up and down, that will take eth0.1 and eth0.2 with it, as they are virtual and rely on eth0 as their hardware. Sounds like driver issue or hardware issue

Yeah, it's not correlated to LAN ports because running speedtest from WLAN results in the same.

I am not sure whether your router does not send everything, including the WAN traffic via the switch. Looking at the interfaces I would guess that there is one interface, eth0 that is connected to the switch and it is the vlan tag that defines whether traffic is routed to the switch port labeled wan or to the other ones.
A number of router's share this unfortunate mis-design, some at least have two independent connections from the CPU to the switch, but still routing WAN via a switch always brings in unnecessary complications for a (home-)router.

So I concur with @dlakelan.

Honestly looks like a combination of a hardware and driver failure because out of a lot of owners of this device I only found like 5-8 people complaining about this exact problem on forums. Maybe some edge case is not accounted for in the openwrt driver compared to a proprietary one.

Is there any way I can help with this? I can find my way around a debugger but I wouldn't know where to start digging. The dmesg is quite vague (link down, link up).

Have a look at:
http://lists.infradead.org/pipermail/openwrt-devel/2018-October/014272.html
especially the description of patch 6 in that patch set:
"Patch 6 works around an issue where the ethernet devices would lock up
due to a sofirq busy loop. I'll admit that I don't full understand the
issue, or why it should affect this driver and not the out-of-tree
version. But I wonder of this is really the issue seen by a number of
people reporting lockups and driver resets with MT7621?"

Maybe this is related to your issue?

This looks promising and I would love to try it out, but I wasn't sure how to properly modify target/linux/ramips/dts/MIR3G.dts like the author did for another device in Patch 9 so the mainline driver could actually be used for my device as well.