Hi,
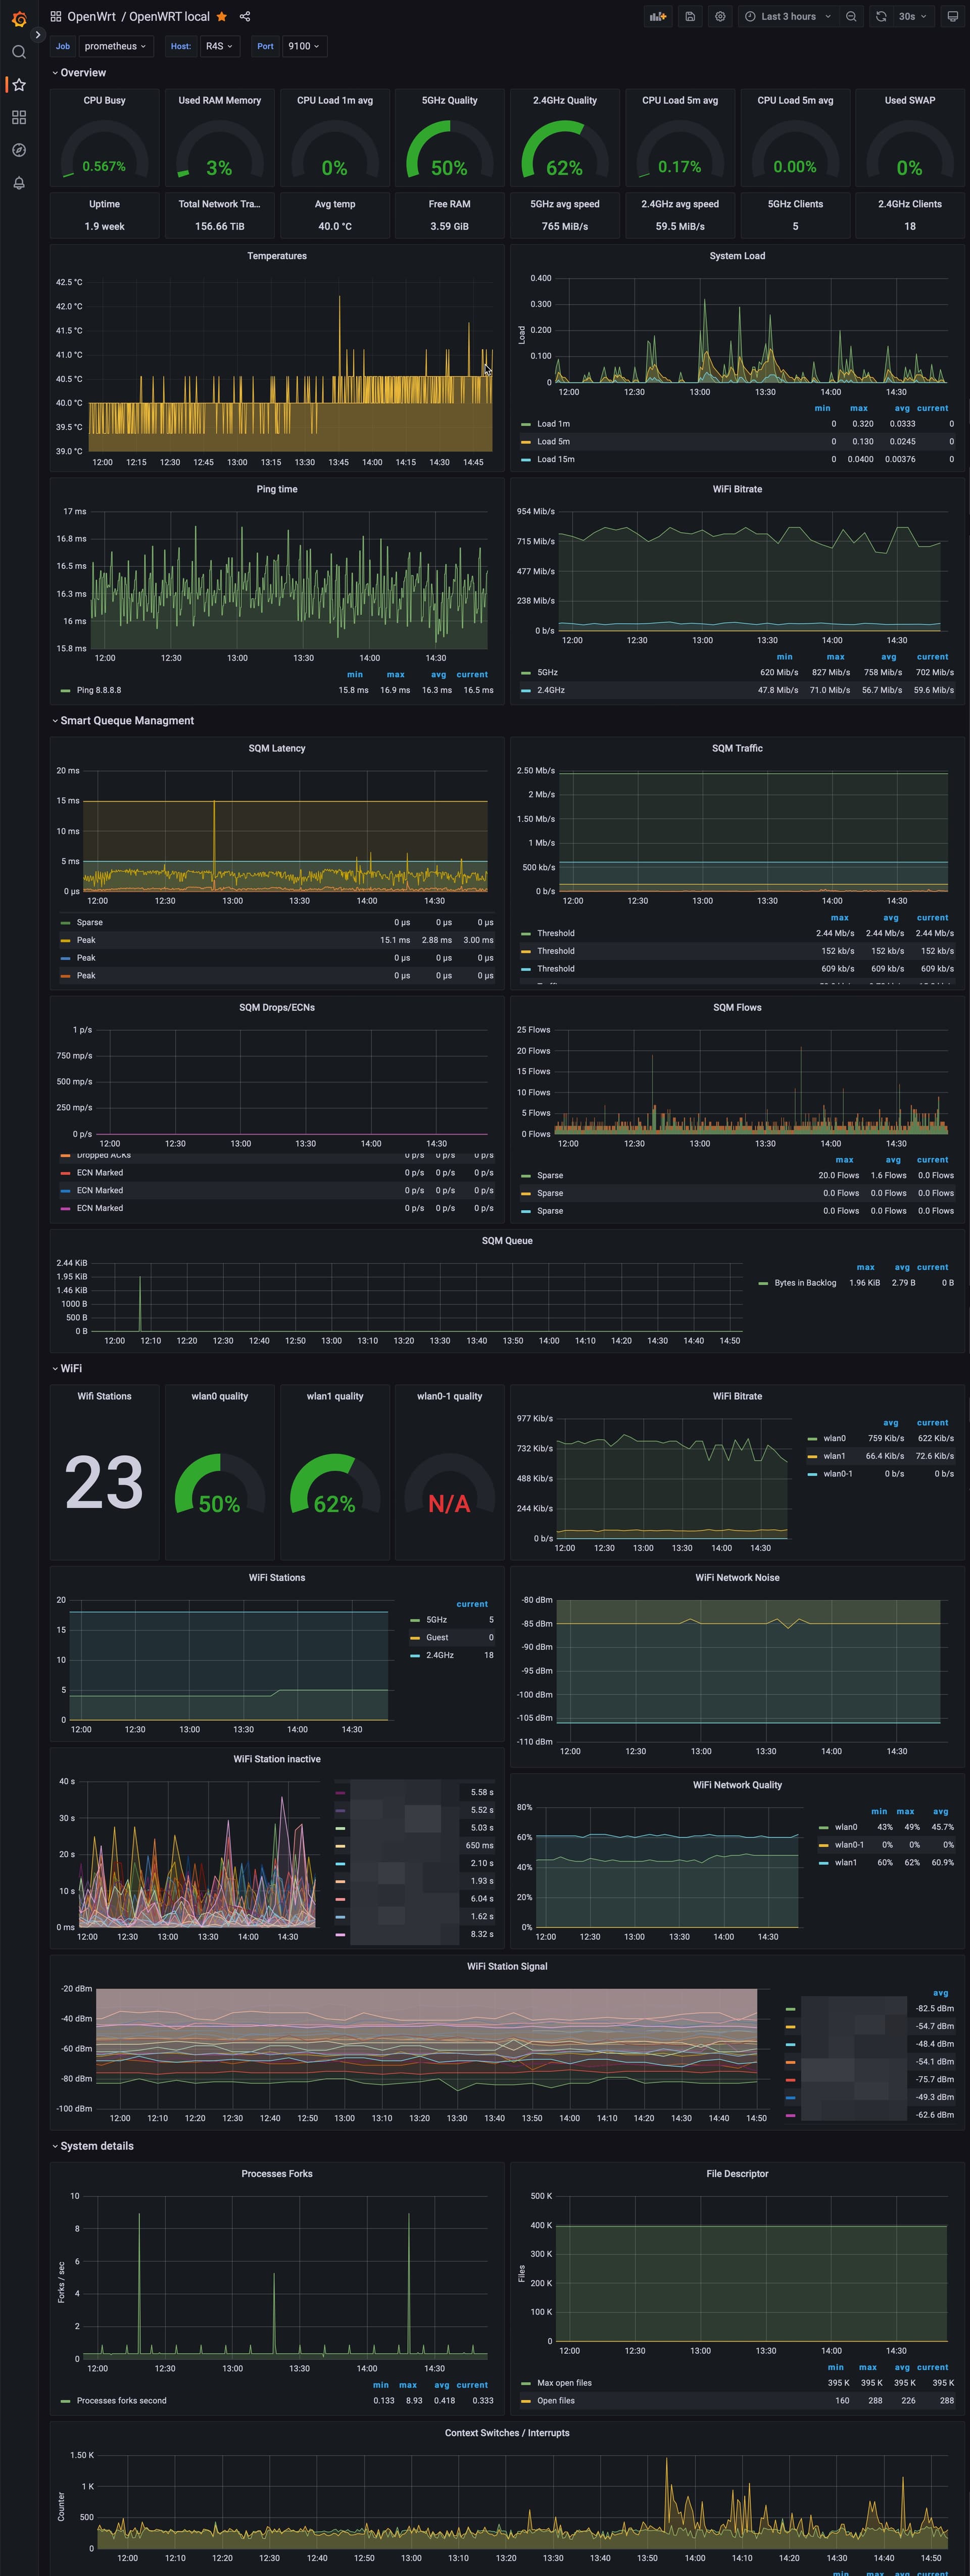
I’m using a router and an AP with both OpenWrt and collectd that sends the data to a RaspberryPI where there’s a Grafana server that makes some nice and useful stats (my setup is here). But… with the free version of Grafana is not possible to send daily/weekly/scheduled reports. Only with the enterprise plan is possible.
So I have to find out another way, there’re some external plugins that can do it but they’re outdated and I don’t want to install another thing that when I update something it stops working.
Another way is to use an online service but they’re expensive.
So, someone have a suggestion for another way to get daily/scheduled reports from OpenWrt to my email?
Eheh yes I know but as you said the format is not legible. Indeed I was asking if there’s a tool to send the reports in a pdf format or a readable way. Not only the crude logs via cron.
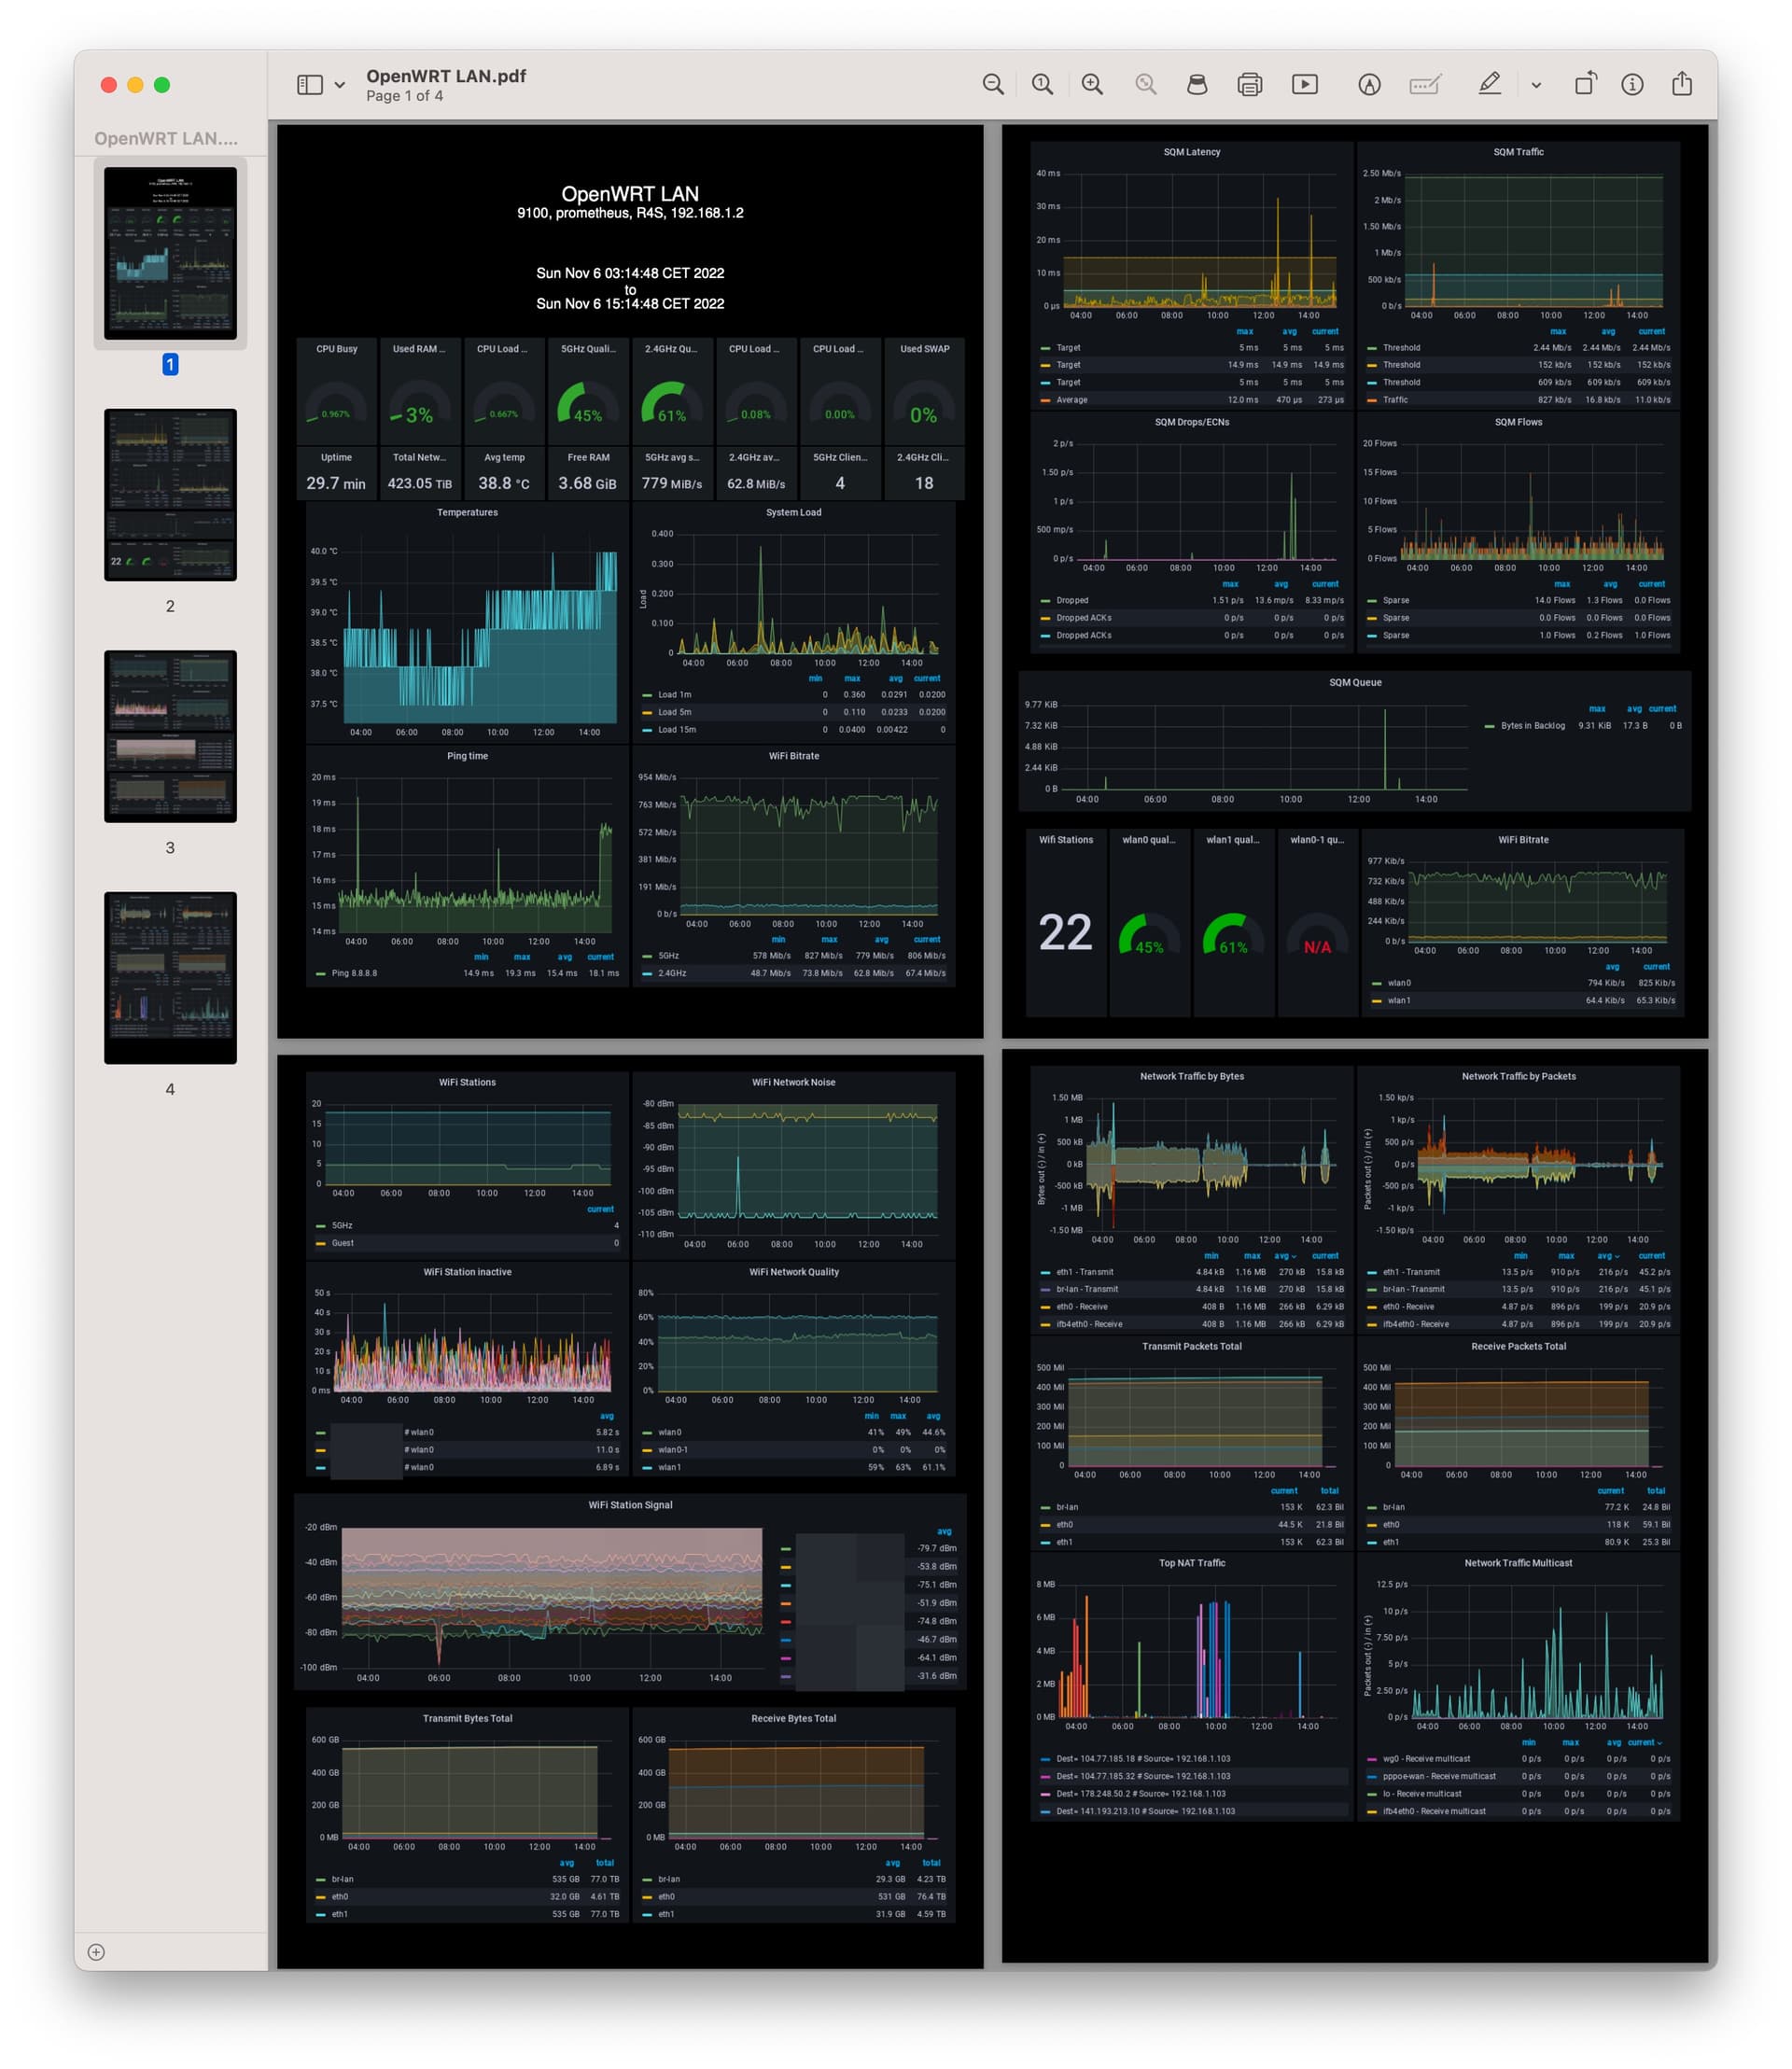
I need the PDF to be created, I need "something" in a readable format, these are my stats from Grafana, I need this data also in a text format, but readable, not the RAW queries from collectd:
Ehi @frollic I tried both but I failed because Grafana needs a plug ‘Grafana-image-render’ that is not compiled for ARM, so I’m having some troubles to generate the graphs.
There isn’t anything that can generate the report from OpenWrt?
I mean, something that can take a screenshot (or generate a pdf) from the luci stats page and send it via email.
In order to send it is not the issue using cron, but I don’t know how to generate the images.
Maybe I can make the luci page available without login and then install something/a tool in another RaspberryPI that can make a screenshot of a page inside my LAN?
I will write a blog post with all the details but in the end I used the Izak Marius’ Reporter https://github.com/IzakMarais/reporter and I had to recompile for ARM the Grafana-image-render plug-in.