Gotcha. Let me have a play about with it later (currently making dinner!). Thanks again.
1 Like
you can give this one a whirl... it's hackorrific, but will setup a few dynamic ipsets for you...
curl -L https://raw.githubusercontent.com/wulfy23/rpi4/master/utilities/ctinfo_4layercake_rpi4.qos > /usr/lib/sqm/ctinfo_4layercake_rpi4.qos
1 Like
Yo... this build is cool!! I just checked the progress on this project for the first time since last summer and now I wish I had followed the progress here more closely.
Awesome stuff, thanks!
1 Like
Continuing the discussion from Rpi4 < $(community_build):
Hi guys,
Since past couple versions I run into the same problem - my ethernet wan stops working after a couple days. I tried setting up watchcat since reboot fixes it (or even a service restart) but it does not trigger for some reason.
n Jan 17 10:29:34 2021 kern.warn kernel: [110991.688813] ------------[ cut here ]------------
Sun Jan 17 10:29:34 2021 kern.info kernel: [110991.693541] NETDEV WATCHDOG: eth1 (ax88179_178a): transmit queue 0 timed out
Sun Jan 17 10:29:34 2021 kern.warn kernel: [110991.700744] WARNING: CPU: 2 PID: 0 at net/sched/sch_generic.c:448 dev_watchdog+0x2b8/0x2c0
Sun Jan 17 10:29:35 2021 kern.warn kernel: [110991.709093] Modules linked in: qcserial pppoe ppp_async option l2tp_ppp cdc_mbim brcmfmac usb_wwan sr9700 rndis_host qmi_wwan pppox ppp_generic iscsi_tcp ipt_REJECT huawei_cdc_ncm ftdi_sio dm9601 cfg80211 cdc_ncm cdc_ether ax88179_178a xt_time xt_tcpudp xt_tcpmss xt_statistic xt_state xt_recent xt_quota2 xt_quota xt_pkttype xt_owner xt_nat xt_multiport xt_mark xt_mac xt_limit xt_length xt_hl xt_helper xt_hashlimit xt_geoip xt_ecn xt_dscp xt_conntrack xt_connmark xt_connlimit xt_connbytes xt_comment xt_addrtype xt_TCPMSS xt_REDIRECT xt_MASQUERADE xt_LOG xt_HL xt_FLOWOFFLOAD xt_DSCP xt_CT xt_CLASSIFY wireguard usbserial usbnet usbhid ums_usbat ums_sddr55 ums_sddr09 ums_karma ums_jumpshot ums_isd200 ums_freecom ums_datafab ums_cypress ums_alauda slhc sch_cake r8152 pegasus nf_reject_ipv4 nf_log_ipv4 nf_flow_table_hw nf_flow_table nf_conntrack_rtcache nf_conntrack_netlink nf_conncount macvlan libiscsi_tcp libiscsi iptable_raw iptable_nat iptable_mangle iptable_filter ipt_ECN ip6table_raw
Sun Jan 17 10:29:35 2021 kern.warn kernel: [110991.709153]  ip_tables hid_generic exfat crc_ccitt compat cdc_wdm brcmutil fuse sch_teql sch_sfq sch_red sch_prio sch_pie sch_multiq sch_gred sch_fq sch_dsmark sch_codel em_text em_nbyte em_meta em_cmp act_simple act_police act_pedit act_ipt act_gact act_csum libcrc32c act_ctinfo sch_tbf sch_ingress sch_htb sch_hfsc em_u32 cls_u32 cls_tcindex cls_route cls_matchall cls_fw cls_flow cls_basic act_skbedit act_mirred snd_bcm2835(C) hid evdev usb_f_ecm u_ether libcomposite ledtrig_usbport ledtrig_oneshot ledtrig_heartbeat ledtrig_gpio cryptodev xt_set ip_set_list_set ip_set_hash_netportnet ip_set_hash_netport ip_set_hash_netnet ip_set_hash_netiface ip_set_hash_net ip_set_hash_mac ip_set_hash_ipportnet ip_set_hash_ipportip ip_set_hash_ipport ip_set_hash_ipmark ip_set_hash_ip ip_set_bitmap_port ip_set_bitmap_ipmac ip_set_bitmap_ip ip_set nfnetlink ip6table_nat nf_nat nf_conntrack nf_defrag_ipv6 nf_defrag_ipv4 ip6t_NPT ip6t_rt ip6t_mh ip6t_ipv6header ip6t_hbh ip6t_frag ip6t_eui64 ip6t_ah
Sun Jan 17 10:29:35 2021 kern.warn kernel: [110991.796454]  nf_log_ipv6 nf_log_common ip6table_mangle ip6table_filter ip6_tables ip6t_REJECT x_tables nf_reject_ipv6 ip6_gre ip_gre gre ifb dummy sit l2tp_netlink l2tp_core udp_tunnel ip6_udp_tunnel ipip ip6_tunnel tunnel6 tunnel4 ip_tunnel veth tun snd_rawmidi snd_seq_device snd_pcm_oss snd_pcm_dmaengine snd_pcm snd_timer snd_mixer_oss snd_hwdep snd_compress snd soundcore nls_utf8 crypto_user algif_skcipher algif_rng algif_hash algif_aead af_alg sha1_generic md5 ghash_generic gf128mul gcm des_generic libdes cmac ccm authenc crypto_acompress vfat fat nls_iso8859_1 nls_cp437 dwc2 uhci_hcd ohci_platform ohci_hcd ledtrig_transient fsl_mph_dr_of ehci_platform ehci_fsl ehci_hcd gpio_button_hotplug udc_core
Sun Jan 17 10:29:35 2021 kern.warn kernel: [110991.945723] CPU: 2 PID: 0 Comm: swapper/2 Tainted: G         C        5.4.85 #0
Sun Jan 17 10:29:35 2021 kern.warn kernel: [110991.953117] Hardware name: Raspberry Pi 4 Model B Rev 1.1 (DT)
Sun Jan 17 10:29:35 2021 kern.warn kernel: [110991.959035] pstate: 40400005 (nZcv daif +PAN -UAO)
Sun Jan 17 10:29:35 2021 kern.warn kernel: [110991.963913] pc : dev_watchdog+0x2b8/0x2c0
Sun Jan 17 10:29:35 2021 kern.warn kernel: [110991.968006] lr : dev_watchdog+0x2b8/0x2c0
Sun Jan 17 10:29:35 2021 kern.warn kernel: [110991.972097] sp : ffffffc010013da0
Sun Jan 17 10:29:35 2021 kern.warn kernel: [110991.975492] x29: ffffffc010013da0 x28: 00000000000000e0
Sun Jan 17 10:29:35 2021 kern.warn kernel: [110991.980890] x27: 0000000000000140 x26: 00000000ffffffff
Sun Jan 17 10:29:35 2021 kern.warn kernel: [110991.986286] x25: 0000000000000000 x24: 0000000000000000
Sun Jan 17 10:29:35 2021 kern.warn kernel: [110991.991682] x23: 0000000000000001 x22: ffffff807a0b9000
Sun Jan 17 10:29:35 2021 kern.warn kernel: [110991.997078] x21: ffffff807a0b9480 x20: ffffffc0109c6000
Sun Jan 17 10:29:35 2021 kern.warn kernel: [110992.002473] x19: 0000000000000000 x18: 0000000000000000
Sun Jan 17 10:29:35 2021 kern.warn kernel: [110992.007868] x17: 0000000000000000 x16: 0000000000000000
Sun Jan 17 10:29:35 2021 kern.warn kernel: [110992.013263] x15: 0000000000000000 x14: 07740775076f0720
Sun Jan 17 10:29:35 2021 kern.warn kernel: [110992.018658] x13: 07640765076d0769 x12: 0774072007300720
Sun Jan 17 10:29:35 2021 kern.warn kernel: [110992.024053] x11: 0765077507650775 x10: 0771072007740769
Sun Jan 17 10:29:35 2021 kern.warn kernel: [110992.029448] x9 : 076d0773076e0761 x8 : 077207740720073a
Sun Jan 17 10:29:35 2021 kern.warn kernel: [110992.034844] x7 : 0729076107380737 x6 : 0000000000000001
Sun Jan 17 10:29:35 2021 kern.warn kernel: [110992.040239] x5 : 0000000000000000 x4 : 0000000000000000
Sun Jan 17 10:29:35 2021 kern.warn kernel: [110992.045634] x3 : 0000000000000000 x2 : ffffff807fbc2258
Sun Jan 17 10:29:35 2021 kern.warn kernel: [110992.051029] x1 : ffffffc06f20c000 x0 : 0000000000000040
Sun Jan 17 10:29:35 2021 kern.warn kernel: [110992.056424] Call trace:
Sun Jan 17 10:29:35 2021 kern.warn kernel: [110992.058956]  dev_watchdog+0x2b8/0x2c0
Sun Jan 17 10:29:35 2021 kern.warn kernel: [110992.062704]  call_timer_fn.isra.34+0x20/0x78
Sun Jan 17 10:29:35 2021 kern.warn kernel: [110992.067057]  run_timer_softirq+0x1e8/0x478
Sun Jan 17 10:29:35 2021 kern.warn kernel: [110992.071236]  __do_softirq+0x11c/0x250
Sun Jan 17 10:29:35 2021 kern.warn kernel: [110992.074983]  irq_exit+0x9c/0xb8
Sun Jan 17 10:29:35 2021 kern.warn kernel: [110992.078207]  __handle_domain_irq+0x64/0xb8
Sun Jan 17 10:29:35 2021 kern.warn kernel: [110992.082385]  gic_handle_irq+0x5c/0xb8
Sun Jan 17 10:29:35 2021 kern.warn kernel: [110992.086130]  el1_irq+0xf0/0x1c0
Sun Jan 17 10:29:35 2021 kern.warn kernel: [110992.089354]  arch_cpu_idle+0x10/0x18
Sun Jan 17 10:29:35 2021 kern.warn kernel: [110992.093015]  do_idle+0x1e4/0x258
Sun Jan 17 10:29:35 2021 kern.warn kernel: [110992.096326]  cpu_startup_entry+0x24/0x78
Sun Jan 17 10:29:35 2021 kern.warn kernel: [110992.100333]  secondary_start_kernel+0x148/0x158
Sun Jan 17 10:29:35 2021 kern.warn kernel: [110992.104947] ---[ end trace bd5fb4000b24a6b4 ]---
Any idea what could cause this ? I have this issue since last couple versions (the very first were running fine)
1 Like
can you be more specific about;
- build version numbers?
- describe any setup config that is non-standard... i.e. network settings, extra installed programs, custom config.txt options if any... etc. etc.
- list firmware version
1 Like
the issue is present since: -25063-2.3.637-2-r15199
Current firmware: OpenWrt SNAPSHOT r15323-7ba2f5c96f / LuCI Master git-20.339.75073-e54708a
I have SQM on that network adapter enabled + AdGuard Home installed and serving as DHCP( but this setup is from beginning and on the earliest versions (l think November) I hadn't have those types of issues.
Update: I've also enabled PacketSteering in Global network options(forgot to mention that)
1 Like
as not many are having this issue and based on the text above... i'm guessing this is specific to the nic / power...
some options...
- run this command if you have it to exclude power issues
rpi-throttlewatch.sh -P
- try an alternate NIC
- uninstall /disable stuff one at a time until there is pretty much bare network config / services ( definately disable packet steering especially if irqbalance is running )
- keep an eye on logs / add more verbosity to services and daemons / periodically check htop-proc-free etc. etc.
- try the 'std' build variant on a separate sdcard
you may be the only person running adguard-home on this build too... not that I would expect there to be issues... but you never know...
1 Like
Thanks!
I have an additional USB NIC TP-Link UE-300 will test that one (r8152)
I dont seem to have rpi-throttlewatch.sh 
Did disable the Packet steering - is there anything I can check to make sure IRQBalance is running? SQM can be demanding sometimes (I have almost 500mbps to steer)
1 Like
LUCI>SYSTEM>Startup ... it has not created any issues for me either on or off with UE300 but i'm not sure about with other nics/drivers...
as far as I can tell it does a little to the onboard nic only anyway... but it's a big cantidate to turn off for a while if testing the software side...
having said that... i really think this is more of an asix driver / hw crash / traffic volume thing ( power too I suppose ) ... so i'm not sure much on the software side will be involved ( irq stuff, sqm... )
why only recentlly?... probably increased sqm demand / load... or kernel / core update glitch...?
Thank you @anon50098793 - this is working great. Definitely feeling some qualitative improvements in latency when in starting streaming.
qdisc noqueue 0: dev lo root refcnt 2
 Sent 0 bytes 0 pkt (dropped 0, overlimits 0 requeues 0)
 backlog 0b 0p requeues 0
qdisc mq 0: dev eth0 root
 Sent 2229188954 bytes 1759229 pkt (dropped 0, overlimits 0 requeues 26)
 backlog 0b 0p requeues 26
qdisc fq_codel 0: dev eth0 parent :5 limit 10240p flows 1024 quantum 1514 target 5ms interval 100ms memory_limit 4Mb ecn drop_batch 64
 Sent 414752873 bytes 342425 pkt (dropped 0, overlimits 0 requeues 5)
 backlog 0b 0p requeues 5
  maxpacket 1514 drop_overlimit 0 new_flow_count 4 ecn_mark 0
  new_flows_len 0 old_flows_len 0
qdisc fq_codel 0: dev eth0 parent :4 limit 10240p flows 1024 quantum 1514 target 5ms interval 100ms memory_limit 4Mb ecn drop_batch 64
 Sent 421012426 bytes 348034 pkt (dropped 0, overlimits 0 requeues 13)
 backlog 0b 0p requeues 13
  maxpacket 1514 drop_overlimit 0 new_flow_count 298 ecn_mark 0
  new_flows_len 0 old_flows_len 0
qdisc fq_codel 0: dev eth0 parent :3 limit 10240p flows 1024 quantum 1514 target 5ms interval 100ms memory_limit 4Mb ecn drop_batch 64
 Sent 523713048 bytes 386254 pkt (dropped 0, overlimits 0 requeues 2)
 backlog 0b 0p requeues 2
  maxpacket 1514 drop_overlimit 0 new_flow_count 49 ecn_mark 0
  new_flows_len 0 old_flows_len 0
qdisc fq_codel 0: dev eth0 parent :2 limit 10240p flows 1024 quantum 1514 target 5ms interval 100ms memory_limit 4Mb ecn drop_batch 64
 Sent 403642217 bytes 319714 pkt (dropped 0, overlimits 0 requeues 2)
 backlog 0b 0p requeues 2
  maxpacket 1514 drop_overlimit 0 new_flow_count 37 ecn_mark 0
  new_flows_len 0 old_flows_len 0
qdisc fq_codel 0: dev eth0 parent :1 limit 10240p flows 1024 quantum 1514 target 5ms interval 100ms memory_limit 4Mb ecn drop_batch 64
 Sent 466068390 bytes 362802 pkt (dropped 0, overlimits 0 requeues 4)
 backlog 0b 0p requeues 4
  maxpacket 512 drop_overlimit 0 new_flow_count 3 ecn_mark 0
  new_flows_len 0 old_flows_len 0
qdisc cake 8010: dev eth1 root refcnt 2 bandwidth 22Mbit diffserv8 triple-isolate nonat nowash no-ack-filter split-gso rtt 100ms noatm overhead 22
 Sent 205647881 bytes 724198 pkt (dropped 111, overlimits 939194 requeues 23)
 backlog 0b 0p requeues 23
 memory used: 451328b of 4Mb
 capacity estimate: 22Mbit
 min/max network layer size:           28 /    1500
 min/max overhead-adjusted size:       50 /    1522
 average network hdr offset:           14

                  Tin 0        Tin 1        Tin 2        Tin 3        Tin 4        Tin 5        Tin 6        Tin 7
  thresh         22Mbit    19250Kbit    16843Kbit    14738Kbit    12895Kbit    11283Kbit     9873Kbit     8639Kbit
  target            5ms          5ms          5ms          5ms          5ms          5ms          5ms          5ms
  interval        100ms        100ms        100ms        100ms        100ms        100ms        100ms        100ms
  pk_delay          0us        939us        684us       1.32ms       3.45ms          0us       6.59ms        102us
  av_delay          0us         98us         60us         81us        476us          0us        941us         11us
  sp_delay          0us          6us          4us         15us          4us          0us          4us          4us
  backlog            0b           0b           0b           0b           0b           0b           0b           0b
  pkts                0       166539        46064           47        76931            0       422192        12536
  bytes               0     12546111      4987281        45699     17855982            0    168915220      1432427
  way_inds            0            0         3238            0          788            0         5205          317
  way_miss            0          238         4749            6         1367            0         5223         3127
  way_cols            0            0            0            0            0            0            0            0
  drops               0            1            1            0           16            0           93            0
  marks               0            0            0            0            0            0            1            0
  ack_drop            0            0            0            0            0            0            0            0
  sp_flows            0            1            2            1            1            0            1            0
  bk_flows            0            0            0            0            1            0            0            0
  un_flows            0            0            0            0            0            0            0            0
  max_len             0         2235         7570         4242        16324            0        15140         1406
  quantum           671          587          514          449          393          344          301          300

qdisc ingress ffff: dev eth1 parent ffff:fff1 ----------------
 Sent 2097923574 bytes 1860252 pkt (dropped 0, overlimits 0 requeues 0)
 backlog 0b 0p requeues 0
qdisc noqueue 0: dev br-lan root refcnt 2
 Sent 0 bytes 0 pkt (dropped 0, overlimits 0 requeues 0)
 backlog 0b 0p requeues 0
qdisc cake 8011: dev ifb4eth1 root refcnt 2 bandwidth 210Mbit diffserv8 triple-isolate nonat wash no-ack-filter split-gso rtt 100ms noatm overhead 22
 Sent 2160745652 bytes 1859410 pkt (dropped 842, overlimits 1446913 requeues 0)
 backlog 0b 0p requeues 0
 memory used: 1443398b of 10500000b
 capacity estimate: 210Mbit
 min/max network layer size:           46 /    1500
 min/max overhead-adjusted size:       68 /    1522
 average network hdr offset:           14

                  Tin 0        Tin 1        Tin 2        Tin 3        Tin 4        Tin 5        Tin 6        Tin 7
  thresh        210Mbit   183750Kbit   160781Kbit   140683Kbit   123098Kbit   107710Kbit    94247Kbit    82466Kbit
  target            5ms          5ms          5ms          5ms          5ms          5ms          5ms          5ms
  interval        100ms        100ms        100ms        100ms        100ms        100ms        100ms        100ms
  pk_delay          3us         50us         78us         20us         31us          4us        202us         10us
  av_delay          0us         10us          7us          0us          5us          0us         69us          2us
  sp_delay          0us          2us          2us          0us          2us          0us          3us          1us
  backlog            0b           0b           0b           0b           0b           0b           0b           0b
  pkts                3       487331        49036           27       159715            8       981267       182865
  bytes             444    717216760     16664105         3659    166047300          900   1250668848     11411610
  way_inds            0            0         2728            0          635            0         6831       159610
  way_miss            3         1102         4207            7         1346            3         5226         1927
  way_cols            0            0            0            0            0            0            0            0
  drops               0          114            0            0            6            0          722            0
  marks               0            0            0            0            0            0            0            0
  ack_drop            0            0            0            0            0            0            0            0
  sp_flows            0            1            3            1            2            1            3            1
  bk_flows            0            0            0            0            0            0            0            0
  un_flows            0            0            0            0            0            0            0            0
  max_len           148        19682         5253         1755        14840          145        62412         1387
Somewhere in this process I've managed to break speedtest-netperf.sh to get some real data around this - I guess I'll look at why this broke next!
2021-01-17 13:11:25 Starting speedtest for 60 seconds per transfer session.
Measure speed to netperf.bufferbloat.net (IPv4) while pinging gstatic.com.
Download and upload sessions are sequential, each with 5 simultaneous streams.
.
WARNING: netperf returned errors. Results may be inaccurate!

 Download:   0.00 Mbps
  Latency: [in msec, 1 pings, 0.00% packet loss]
      Min:  20.926
    10pct:   0.000
   Median:   0.000
      Avg:  20.926
    90pct:   0.000
      Max:  20.926
 CPU Load: [in % busy (avg +/- std dev), 0 samples]
 Overhead: [in % used of total CPU available]
  netperf:   0.0
.
WARNING: netperf returned errors. Results may be inaccurate!

   Upload:   0.00 Mbps
  Latency: [in msec, 1 pings, 0.00% packet loss]
      Min:  29.889
    10pct:   0.000
   Median:   0.000
      Avg:  29.889
    90pct:   0.000
      Max:  29.889
 CPU Load: [in % busy (avg +/- std dev), 0 samples]
 Overhead: [in % used of total CPU available]
  netperf:   0.0
1 Like
that's been intermittent for me for 3+months... so I don't think it's anything at your end...
just fixed speedtest-ookla ... you have to removed the disabled line;
### /usr/sbin/speedtest-ookla #-> #echo "currently broken @ r15467"; exit 0
speedtest-ookla
speedtest-ookla stats
speedtest-ookla stats leavesqm
1 Like
The problem is most likely behind the keyboard, but I can't seem to find the line you mentioned in /usr/sbin/speedtest-ookla on build 2.3.656-15 (although the echo on line 165 did make me laugh)
Just checked the git repo and it looks like the updated version in /utilities is a binary - Was hoping I could see what's changed.
(Edit - changed link to utilities folder to prevent binary spam)
1 Like
edited and uploaded so you can pull it down ( it's a wrapper that pulls down and runs the binary you mentioned )
curl -L https://raw.githubusercontent.com/wulfy23/rpi4/master/utilities/speedtest-ookla-wrapper > /usr/sbin/speedtest-ookla
if your script was missing that line than it is good to go anyway... as just the binary was updated/fixed...
1 Like
Great. Thank you again @anon50098793.
In the current build, speedtest-ookla.real seems it's a copy of the speedtest-ookla wrapper. Once I'd renamed speedtest-ookla.real the wrapper downloaded the binary - I did have to manually run the binary first to accept the license, otherwise the script held in an infinite licensing loop.
Working now, thought I'd mention it if helpful for the next release.
1 Like
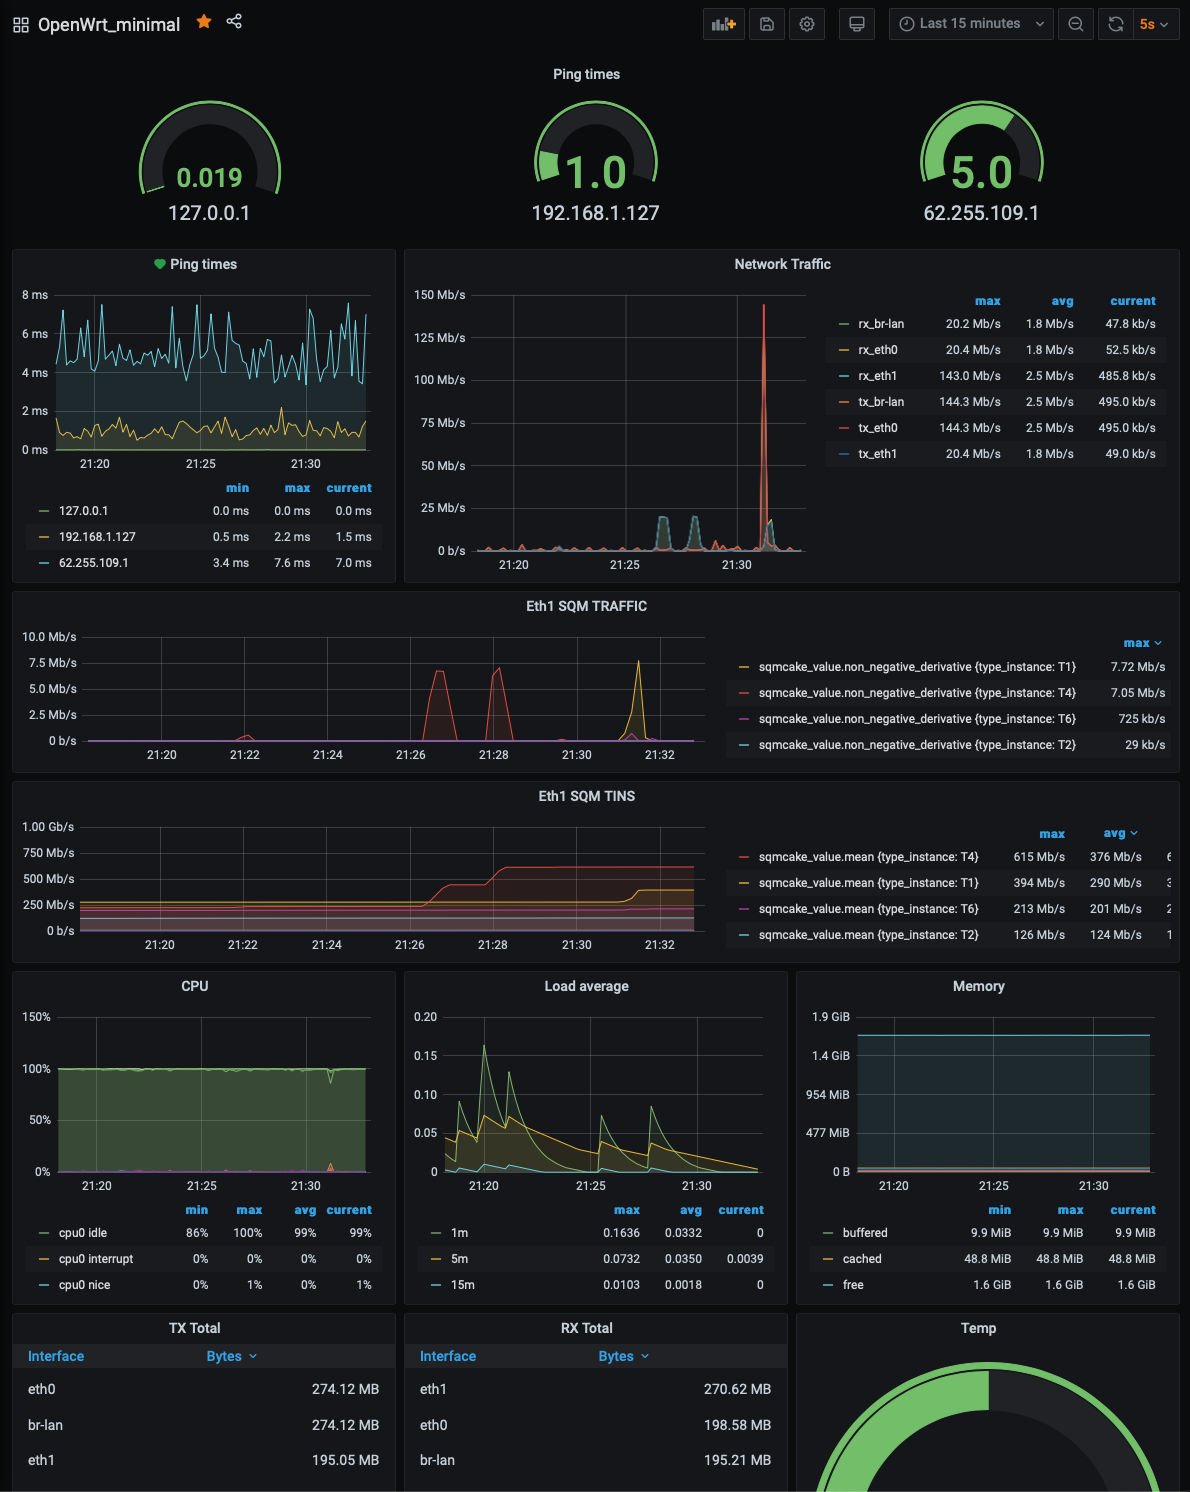
This was a fun little weekend hack project. Got @anon50098793 's ctinfo_4layercake_rpi4.qos shaper set up and collectd working with influxDB & Grafana.
Really appreciate all the work that went into this build!
2 Likes
how can i get this?
why i am getting this error when accessing pi4 page?

I was trying to access real time graph and connections when this happened.
so many connections

To be efficient, you should set up Grafana & InfluxDB on another machine somewhere (I run them on an old Pi3B+ using docker, with an NFS connection to my NAS for storage)
You can enable the Network plugin under Luci -> Statistics -> Setup -> Output Plugins -> Network: You'll need to add the IP & port of your influxDB server.
Don't forget to enable the collectd service inside InfluxDB config!
In Grafana you'll need to add the InfluxDB datasource and database, then you can import this JSON into a new Dashboard to get the same as I have above.
The only additional package I added was collectd-mod-ping which can be installed through opkg
Edit - Once you've done this you can disable RRDTool in Output Plugins if you like to save a few cycles on your Pi4.
2 Likes
until other build users experience something similar... all you can do is start fresh with a new factory image ( or use official image ) and do not restore any configs/backups.
your connection count is likely not build related and several examples have been given as to the cause and how to identify causes within this thread....
1 Like
after reboot it is working fine
1 Like