I cannot find any way to get realtime statistics (bandwidth uses) per host/mac from openwrt router with a nice presentation (grafana).
I can find:
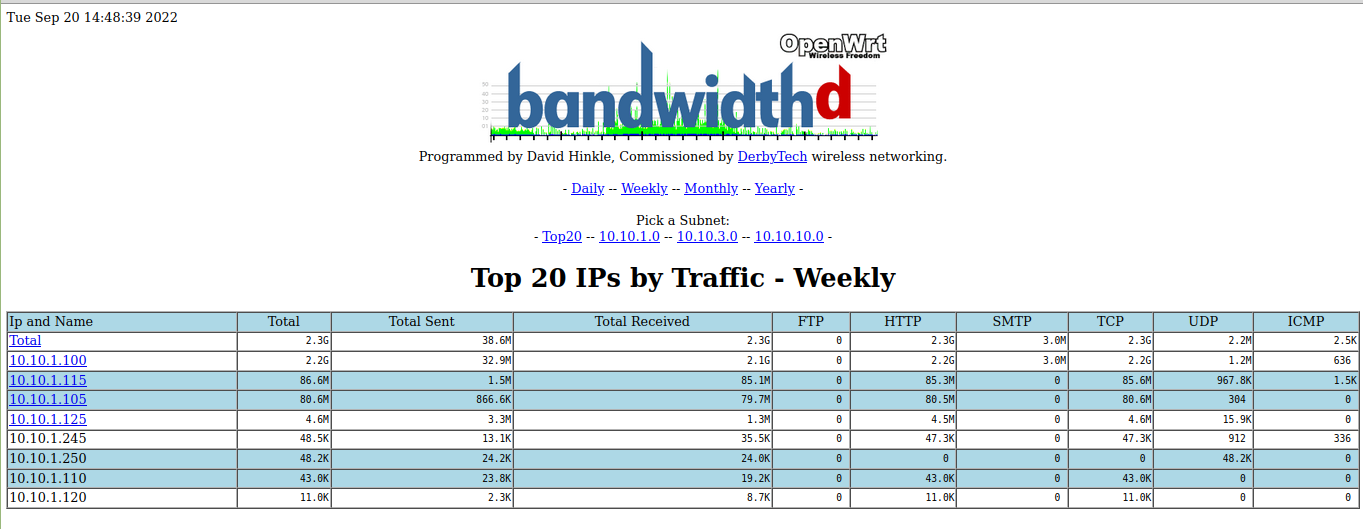
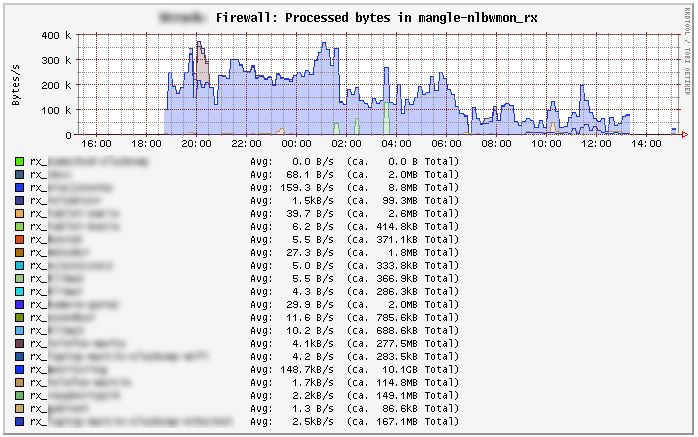
old looking stats from luci packages, that show something statics with graphics from 90s
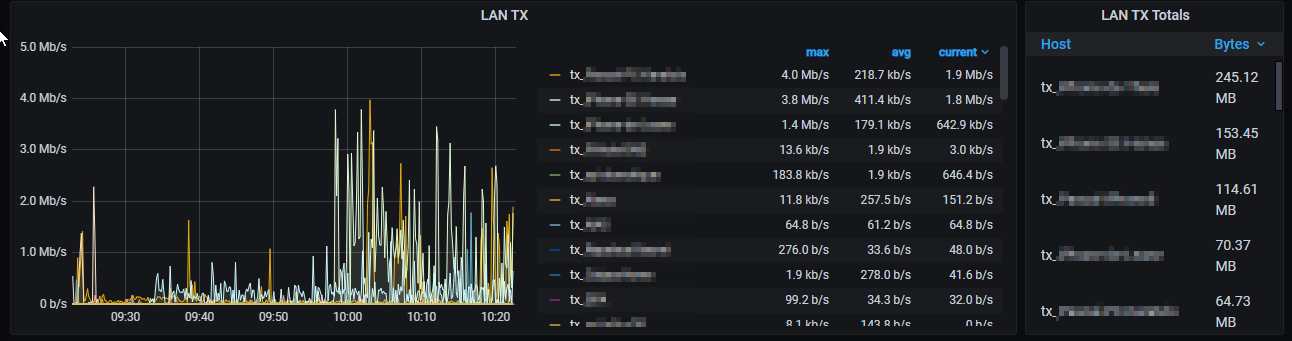
some prometheus/collectd/softflowd export probes and grafana display but without traffic per host (just general traffic)
I used iptmon in the past but not only it was sort of hack, it is no more compatible with 22.x firmware…
I cannot believe that all those probes (snmp/collectd/softflowd/prometheus/…) cannot export detailed statistics per host (?) neither that no one is interested by getting such statistics from its network (e.g. to see who is f*cking eating all the bandwidth)…
I also use softflowd that I export Netflow data to PRTG on an old desktop win box. I use it because I'm familiar with it from a previous job, but there are other users here using grafana for similar purposes.
I am interested in something like this as well. I would like to record every connection/flow in my small network with modest traffic rates used only by me and be able to track and report every connection short term with increasing aggregation as time passes. Using a flow exporter (softflowd) on my hexacore arm OpenWrt 22.03 router, a flow collector and a flow analyzer on a server should work.
Perhaps you are looking for an OpenWrt how-to guide to set up all three components. Since flow records are fairly standardized and the exporter and collectors have focused functionality, they should be fairly straightforward to setup in a generic form. I hope the analyzers we might choose have clear instructions to work with the collector and may drive product selection for the collector. A quick look at internet search results shows some blogs etc. which may ease the overall process.
yeah softflowd seems definitively a good option...but then which tool to use with it?
I have tried ntopng (thanks to netflow2ng) but it is IMHO a pure IT admin tool... I don't need such level of detail and, on the other side, I don't have (easy) access to basic stuff like traffic per devices on my network...
So still looking around and open to comments!
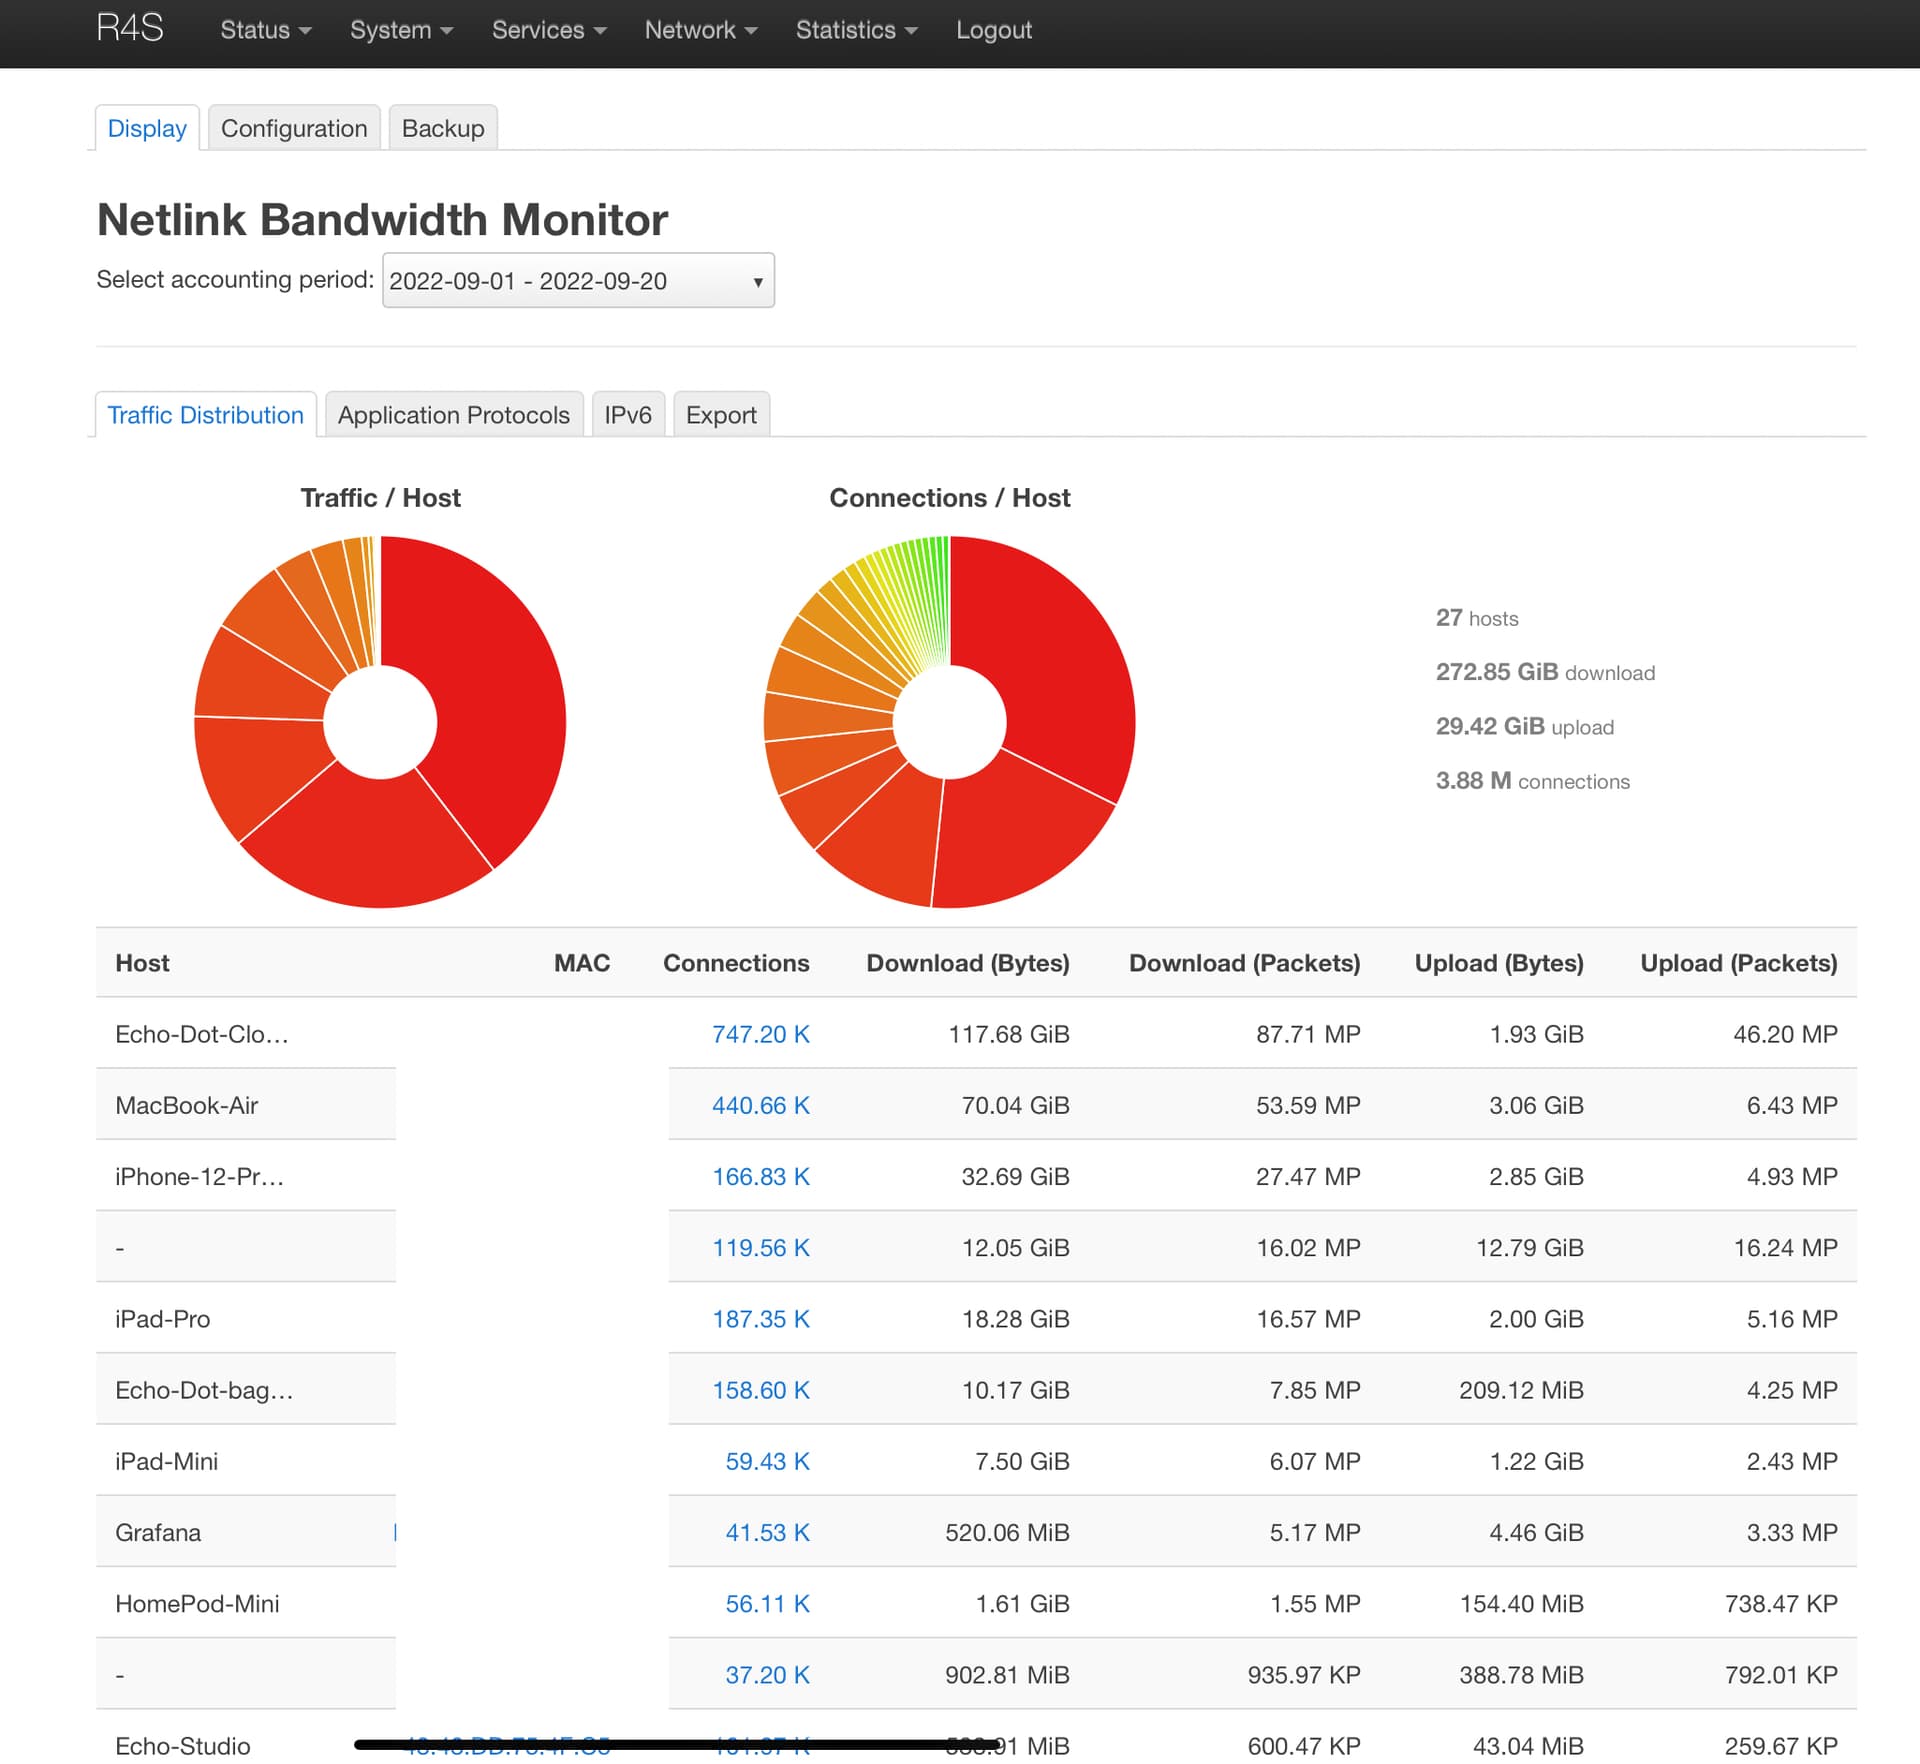
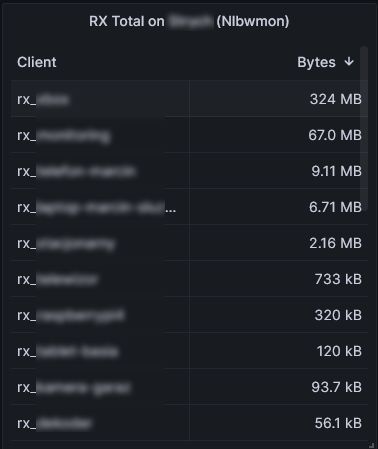
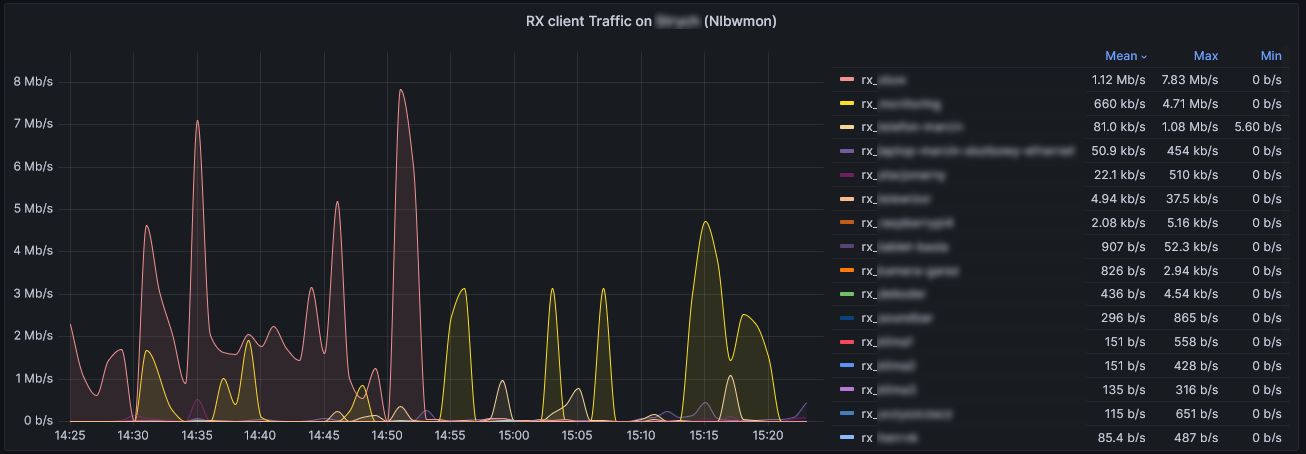
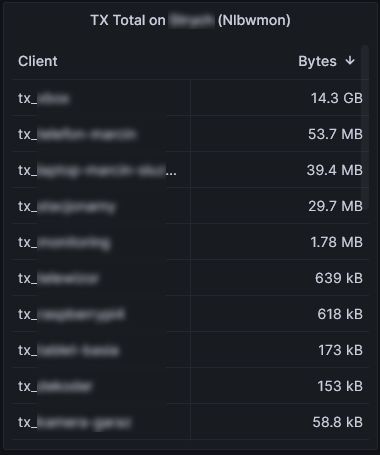
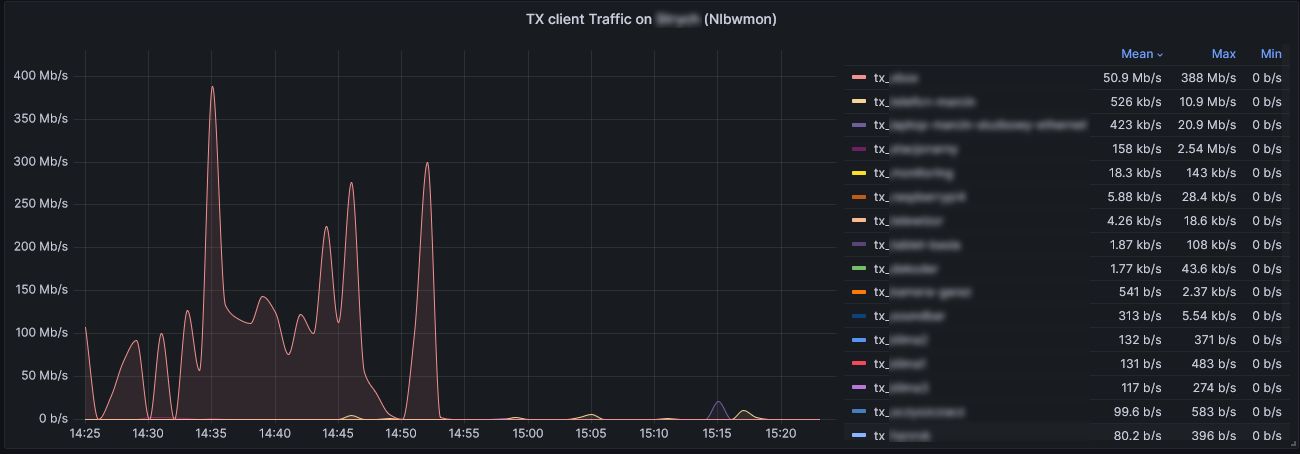
Please take a look at my script to export Nlbwmon statistics to Collectd: https://github.com/mstojek/nlbw2collectd. With this script you should be able to get similar or exactly the same statistics as with iptmon (for iptmon full compability some changes in the script are needed, see documentation).
I was also looking for a similar thing and closest I found luci-app-nft-qos
You don't have to use QoS part. Status > Realtime Graphs > Rate is what I needed.