I was streaming video last night and got curious how much bandwidth I was using.
I looked at the Realtime Load screen and the left side values do not have any unit associated with them. While streaming I am seeing numbers in the 1.1 range.
Can someone please help me understand what this is telling me? I am not finding a reference to this window's content.
FWIW, the stream is generating peaks of about 5 Mbits every 4-5 seconds on the Traffic screen.
"System Load" is not network traffic, it's best described as - the current queue of processes being handled by the CPU. On most embedded CPU's, the processor can handle a load of 1 to 4, so be mindful of that when comparing to desktop CPU loads.
You should check Realtime Traffic or Realtime Connections to get the information you were looking for.
To get a running total since boot (or Interface up), go the the Interfaces page and see how much the WAN interface has used. If you don't have LuCI installed, type ifconfig - it will also show the traffic used on all interfaces.
I concur, slightly. The semantics are in how load and utilization percentage are calculated.
There's a difference between full processor utilization (percentage of time system is not in Idle) and full load (how many processes are running at x sample times). Nonetheless, I agree - a load of 1.0 on a single core means the system is full-load (though, the process may not be utilizing the CPU 100%).
With a single video stream running I see a load of .88-1.1, with a second stream I see loads the go as high as 1.30 on what I believe is a single core 500Mhz AMD Geode LX-800. What inferences can I make from this for my device?
On the traffic screen, for the WAN interface, I see peaks around 5 Mbit/s for a single stream and 8.2 for two streams. The graph show spikes for data about every 4-5 seconds. The Average is all over the place, but around 500 Kbits/s - 3.5 Mbits/s. Not clear what the numbers are next to the Inbound and Outbound text strings.
I think it's the average inbound number that I am looking for, but please continue....
When I run LuCI, it causes my CPU load to jump to ~1.2...when logged out, I go back to ~0.04...Also, when LuCI is running (and Auto Refreshing), the CPU utilization is at ~30%, when logged out - ~1.25%.
I also use softflowd and snmpd to gather statistics from the router, so I don't always have to run LuCI to get this data.
I think it's just LuCI drawing graphics and pulling the usage statistics real-time.
@RangerZ - I've been monitoring LEDE performance for an unrelated issue. On Android, I found "JuiceSSH" with the "Performance Monitor" plug-in to be a handy way of putting live LEDE performance numbers at my fingertips.
I pulled those from an old configdiff, and may have pulled incomplete/wrong defines, been a while since I made things work, Here is all the busybox TTY/top configs from a current configdiff:
I am just trying to understand the load behaviour on my otherwise rock-solid Linksys WRT1900ACS running OpenWrt 18.06.1.
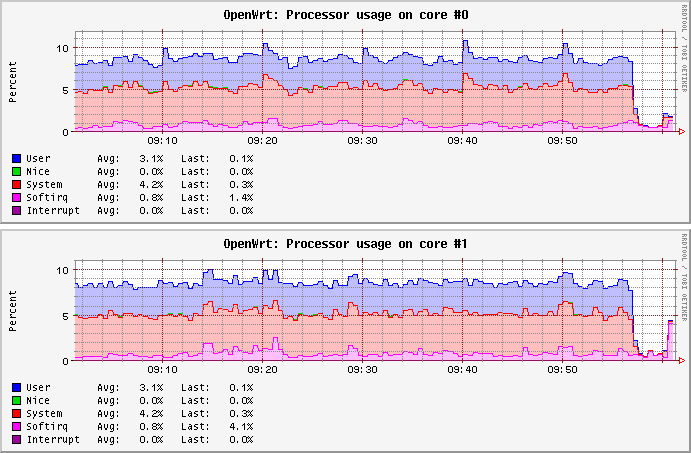
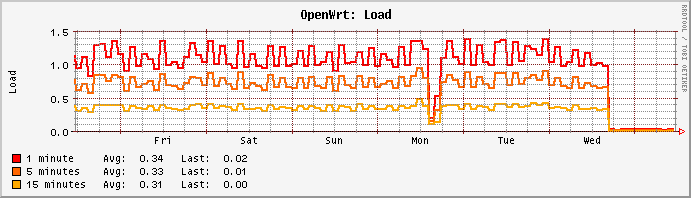
Once every 50 minutes I see a strong increase in the load:
While the CPU stays fairly low at the same time:
This behaviour seems to repeat itself 24/7:
Any clues?
Excuse me for not starting a new topic.
I've no idea what is running on my machine. I am running OpenWRT 18.06.1. with SQM QoS piece-of-cake and the statistics package.
But the good news is that since this morning the spikes are gone:
It seems leaving the Luci browser open with auto refresh on caused these spikes in load. Is this normal behaviour?
"Every 50 minutes" does not sounds like any normal refresh cycle.
you had system load spikes, but no spikes in the CPU usage. Some I/O related bottleneck at some download/upload item, USB stick write task, or something like that? You copy something to a slow memory device every 50 minutes?
WRT1900AC is rather high-powered device, so having a rather steady 7-9% CPU load requires that you have some rather heavy tasks ongoing all the time. A high-speed torrent upload/download? or something like that.
Ps. Cake has recently been showed to use rather high CPU amounts with high-speed traffic, so it may not be quite that optimal for high speeds (as it maybe calculated too much). But even with that, there is not really anything to explain the 50 minutes interval. (you might test the old simple.qos with fd_codel instead of cake, if you still see the spikes.)
In that case, please try to also test the current master version of sqm-scripts from https://github.com/tohojo/sqm-scripts (see README.md for pointers how to do that). And have a look into /usr/lib/sqm/defaults.sh and try to put larger values into SHAPER_QUANTUM_DUR_US; this variable is used to size HTB/TBF's burst-buffer so that emptying it at the configured shaper-rate will take SHAPER_QUANTUM_DUR_US number of microseconds (assuming the buffer is full). Please note that the higher this value the burstier SQM is going to behave with noticeable effects on latency-under-load (aka bufferbloat). But please try and report back any observations like success or failure as a new issue at https://github.com/tohojo/sqm-scripts/issues