Hi,
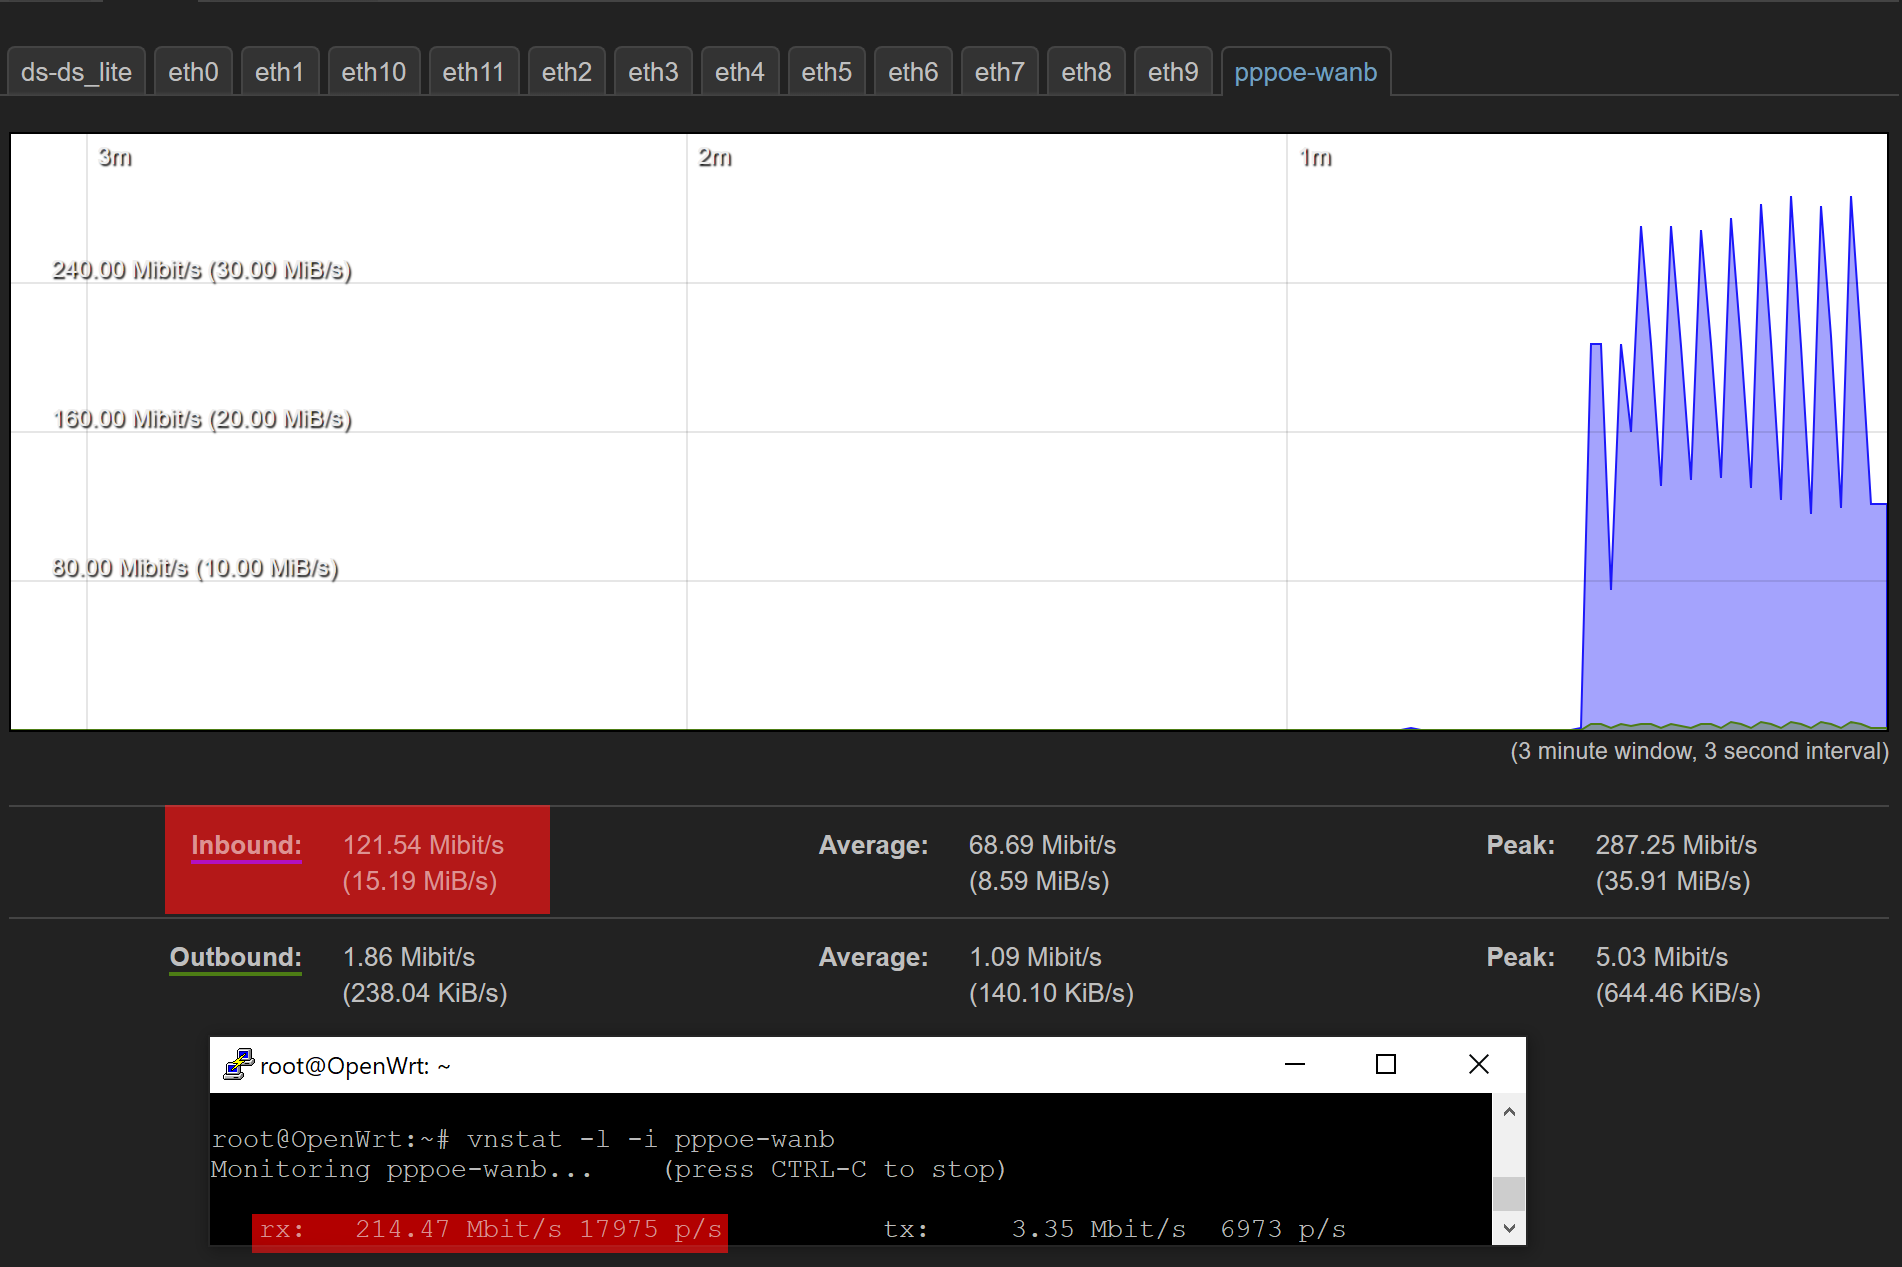
I get wrong reading in the realtime graphs of OpenWRT. The OpenWRT reading is wrong by nearly 100 mbps at 200 mbps thoughput and 400 mbps at 1 gbps throughput, so quite significant.
Does somebody else see this behaviour too?
What makes you think that OpenWRT matches the real throughput?
I mean everything disagrees with it. Windows, vnstat on OpenWRT itself and my Modem say 200+ mbps. Only the webinterface tells 130 Mibit/s and I'm aware that the Webinterface does sho Mibit/s but even then it doesn't line up even close.
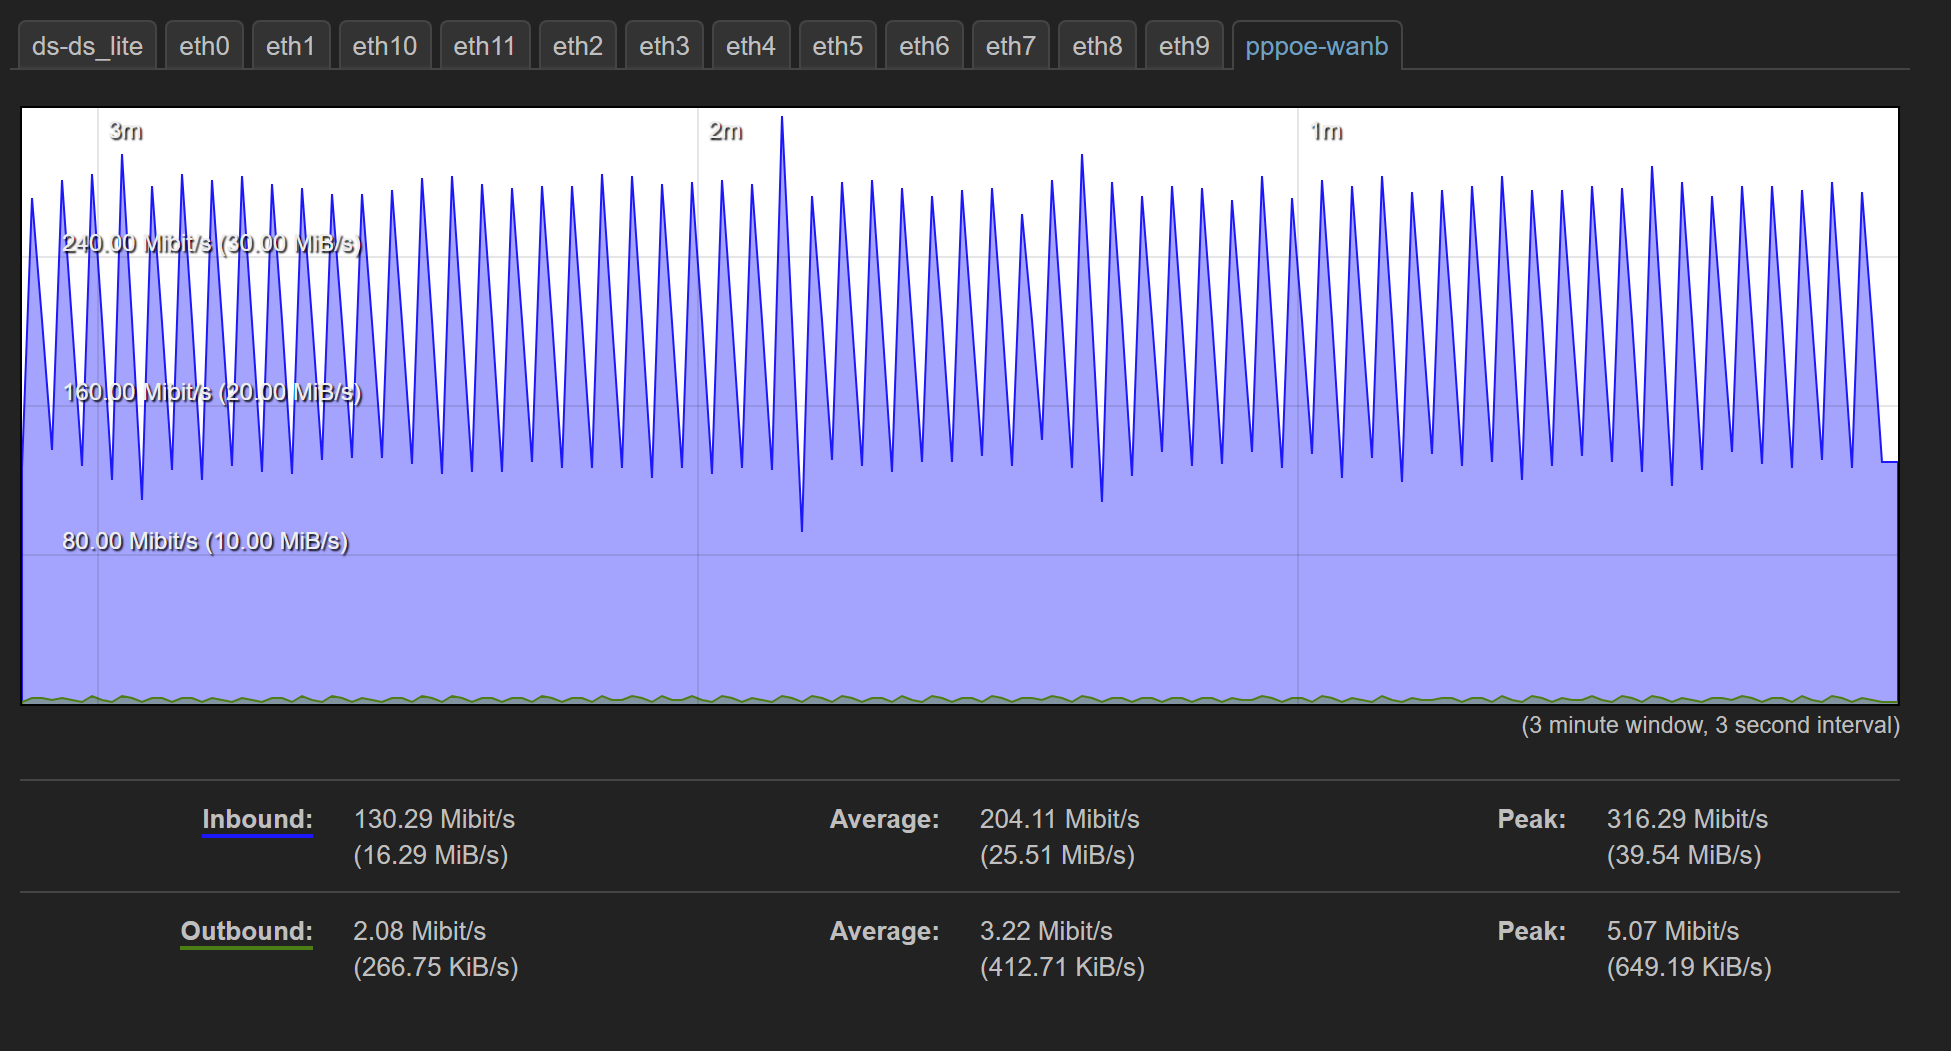
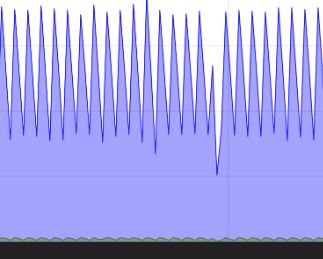
What do you mean? It says right there "Peak: 316.29 Mibit/s" -- that is more than 132Mibit/s. I am just as confused as the other person, since those values look just like they're supposed to.
Ok so lets try again.
The raw connection speed is 224995Kbps. But you have to reduce PPPoE overhead.
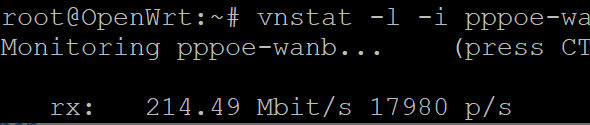
Windows shows 214 Mbit/s
vnstat on OpenWRT shows 214 Mbit/s
only the OpenWRT webinterface shows a much lower value
It is about the Inbound value which shows strange values which don't line up. Average and peak are close enough to be right but the Inbound value is completly wrong.
You are paying way too much attention to the intermittent inbound-value. The spikiness of the graph and the value shown for the inbound speed is an aliasing artifact due to the interval the various values are sampled -- it's not wrong, OpenWRT just shows the very intermittent value whereas e.g. Windows averages things over a couple of samples.
Basically, this thread boils down to OP wanting the graph sampling more frequently and averaging a few samples in sequence and showing that as the inbound value.
I haven't looked at Luci's code, but I believe it uses the rather inefficient XHR-requests to retrieve the values. To update the values more frequently, it probably should be reworked to use Websockets instead, thereby lessening the load on both ends.
I'm not sure how that is relevant at all. There is a constant download with 214 mbit/s over minutes but the inbound value shows never over minutes there a value which is higher than 130 mbit/s. The math to make this work would have to be so bad screwed up that the total bits downloaded over x seconds are divided by the wrong x. So in this case the time over which got measured would not line up with the time divided by.
Like I said, it's aliasing caused by the frequency and timing of the samples used. I haven't looked exactly how the graphing works (and I'm not interested enough to bother, either), but imagine the system taking two samples, but the timing between those two samples and the frequency how often the samples are taken don't line up with buffering and whatnot: one sample will show different values than the other, and the graphing system just happens to end up using the smaller one. If you were to average the two samples, however, they'd show the value you're expecting.
So, it's not technically wrong, it just can be a bit misleading if you do not average things out a little in your mind.
Then I do not understand for what to have that value at all if it is wrong all the time. It hasn't shown a single right value about half a hour now so I do not understand it's purpose.
This is a known paradox of taking running and real-time samples...something similar pops its head up in quantum physics too.
I don't see that...and you'd have to ignore the OpenWrt graph in Post No. 1 to come to that opinion. Maybe you can explain why you're making arbitrary statements...or why you think the OpenWrt graph shows what you describe.
I see your download hit 303 Mbps sometimes...and dips to ~130.