Not sure if someone tried using any free/open source tool to visualize the netifyd data realtime or just for analytics
I did. Took me a few days to figure it out and get it working. Hope it helps you.
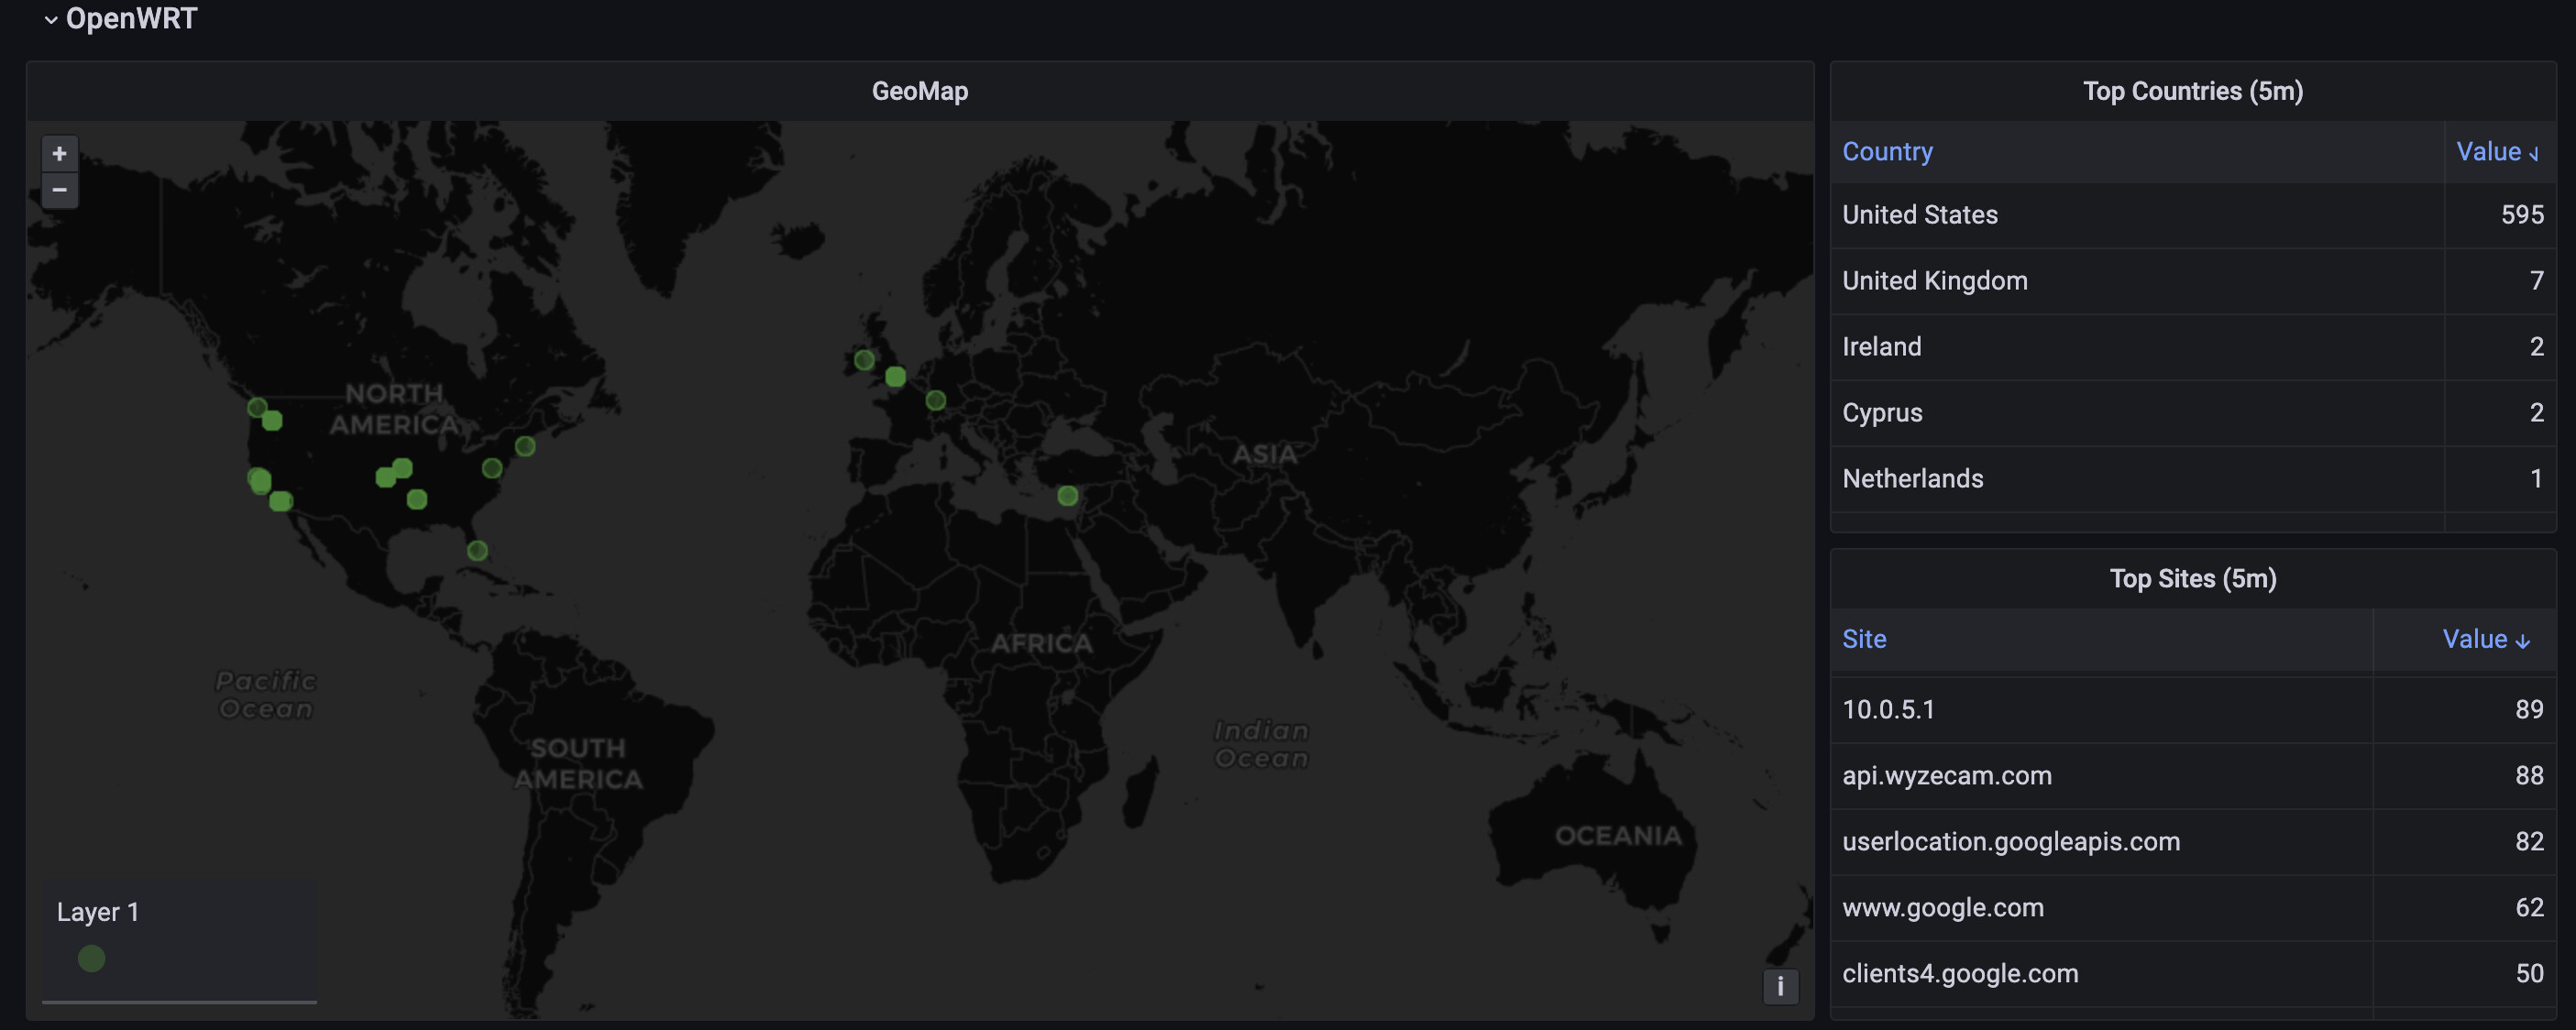
Dumped it into grafana via Loki. Also have geoip map.
Here is how I got it to work::
The Netify-log.sh script runs on your Linux machine, (just a nc output to file).
Promtail will pick up the file and pass the data into the "middleware" which will add geoip, then forward to loki, grafana is used for dashboard.
See screenshots below: The Traffic panel is the Netify logs from Loki.
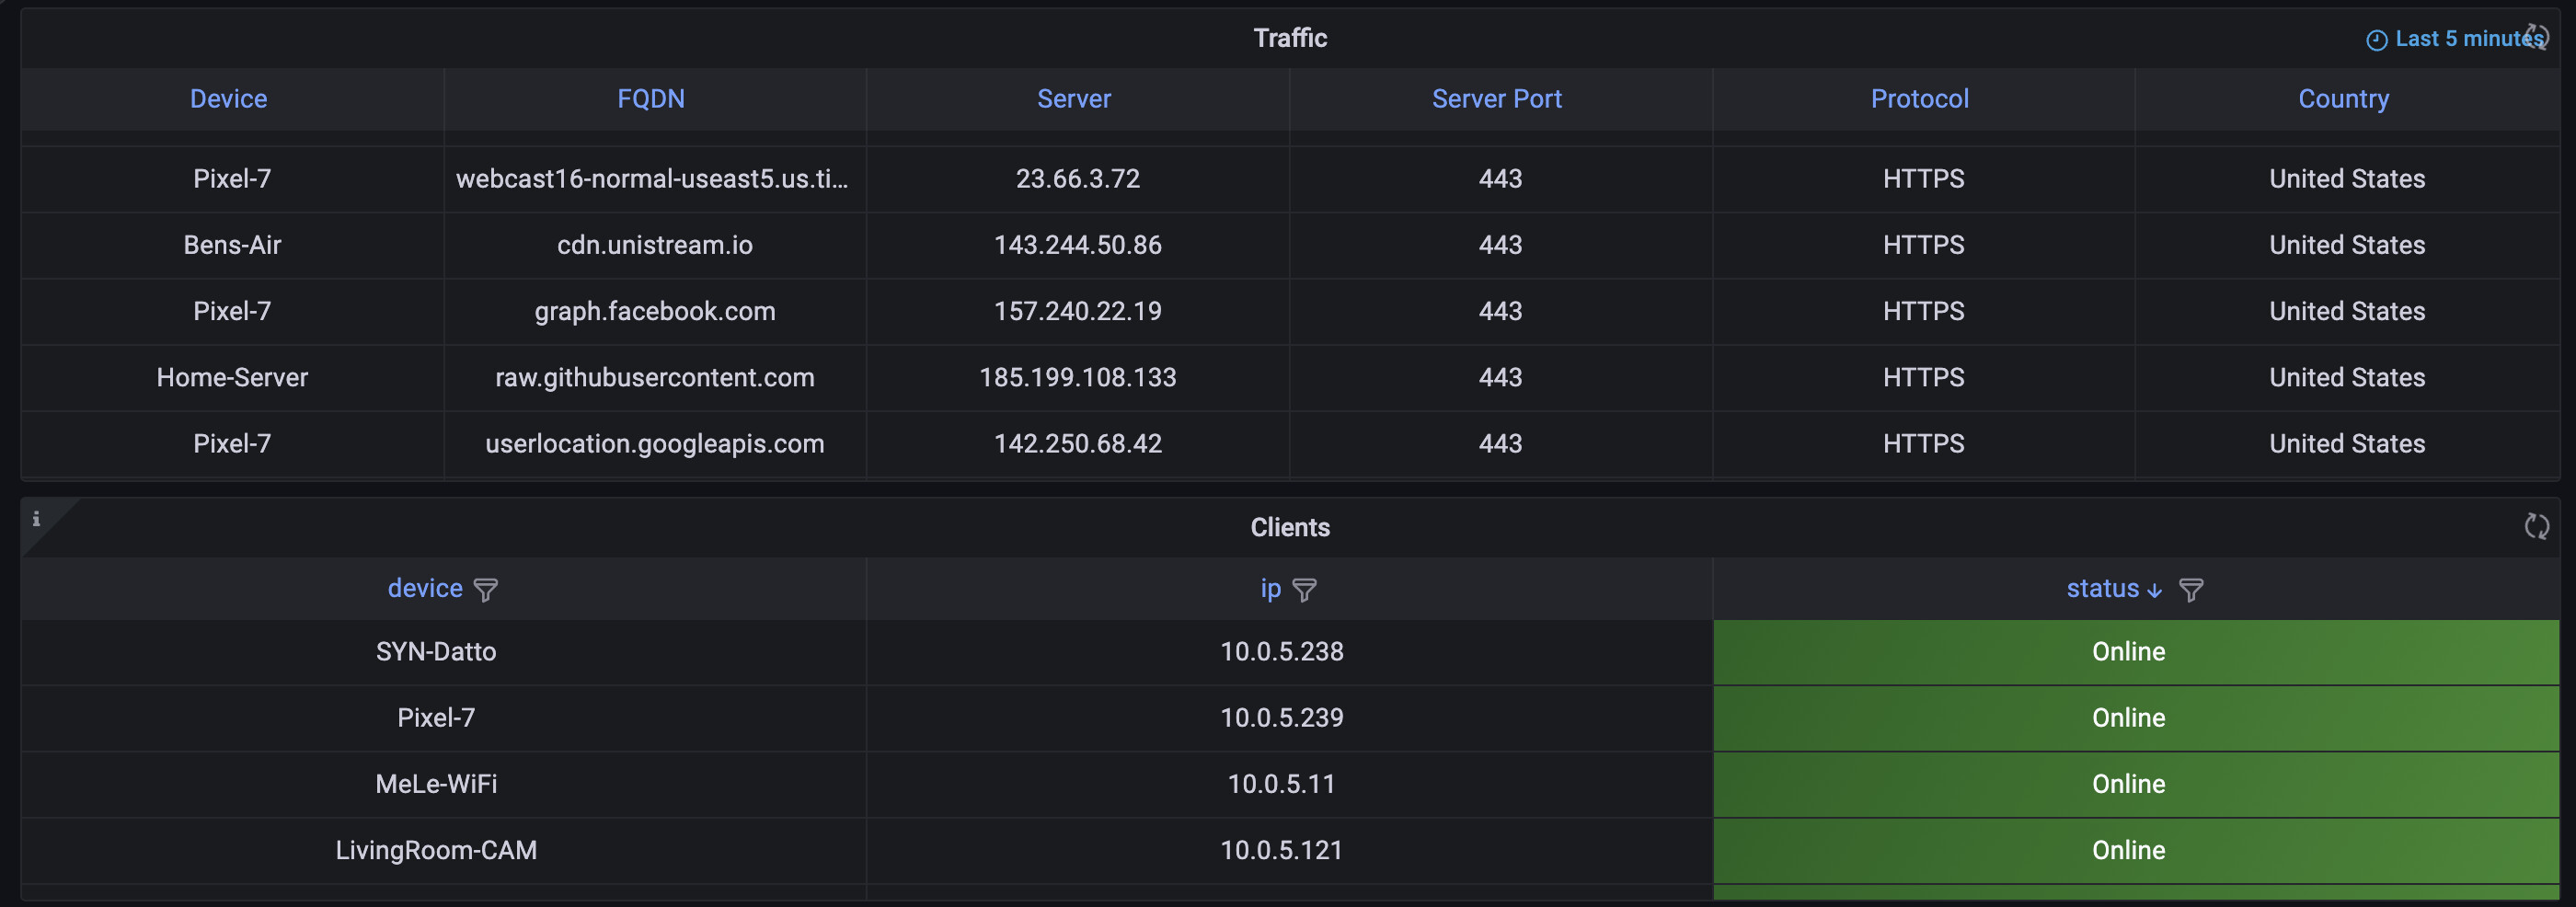
.
this never worked for me. I tested on Debian. I am not an expert, so the due to the amount of errors I encountered, I had to give up on this dashboard
If you need help, give me a ping. It's pretty easy. Setup your router by running the shell script.
Setup up your docker and run the shell file.
Please update your router IP in the shell scripts.
Then import the dashboard board and make your connections.
If you want hostname to IP mapping, update the python script.
That's really it.