Thank you Stefan, I've added the fix to the code and pushed revision 28 to my repo.
@ghoffman -- please confirm the patch submitted by @slh works and let me know so I can submit PR to the OpenWrt repo.
Thank you Stefan, I've added the fix to the code and pushed revision 28 to my repo.
@ghoffman -- please confirm the patch submitted by @slh works and let me know so I can submit PR to the OpenWrt repo.
@stangri - your patch worked. !!!!
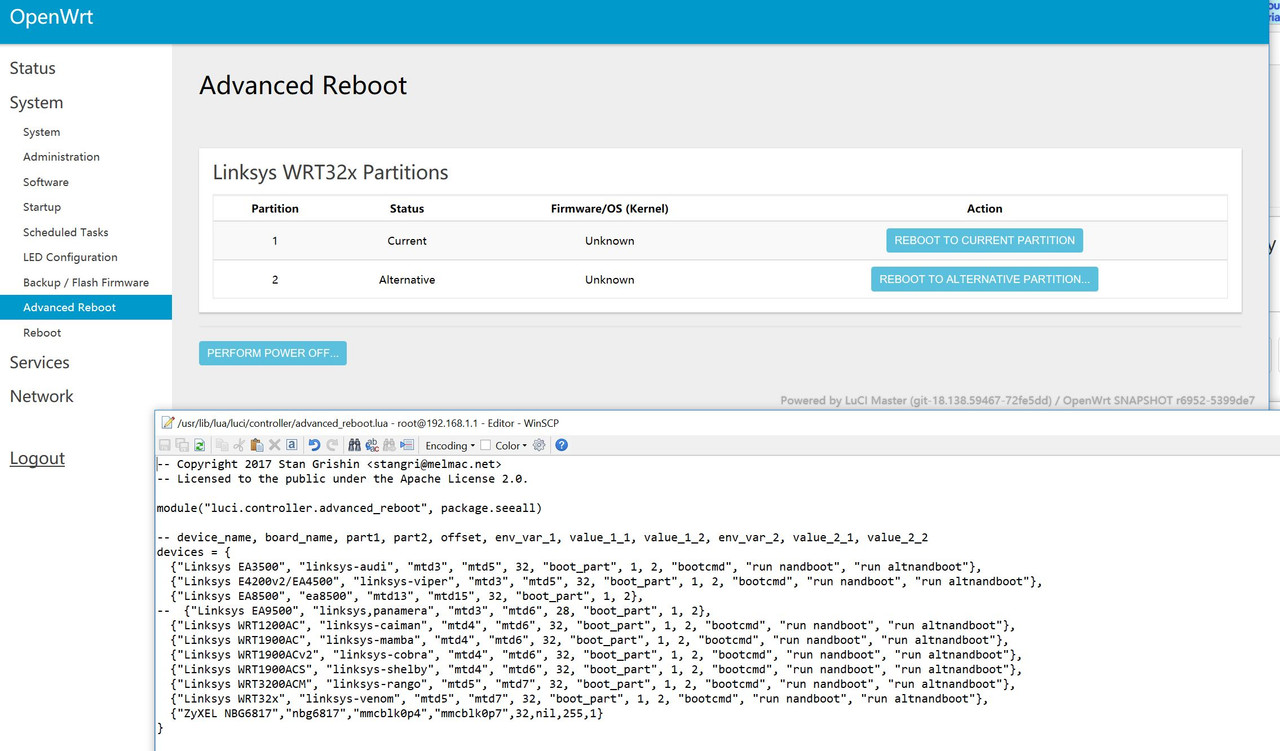
i downloaded your file from
after loading it into the appropriate path on my wrt32xb and rebooting, i luci's advanced_reboot is showing two parttitions.
thansk you!!
Stan – your patch works. Thankk you!!
Hi I tried the fix on a snapshot build no davidc502 builds,it works partially it do not display the kernel version, on my case lede in in part 1 and original in part 2
Used the same method (WinSCP) as @m4r with the same result.
Maybe Firmware/OS (Kernel) version will be displayed after a reboot cycle?
As soon as I get my USB NAS (Samba) working and then a backup, I'll give it a try.
Thank you for the quick fix!
yes, i can confirm - the kernel content is not identified. thank you.
The offset of 32 is not correct for zImage firmware. The patch is not right.
Somebody with WRT32X please analyse the needed offset (of an mtdblock), where the Linux version is written. (how many characters need to be skipped) @stangri needs that info for updating the app.
See e.g. discussion about the work done for the other routers, starting at:
Or alternatively you may try "hexdump -C /dev/mtd5"
@antonsamoziv Can you please change the topic to something more meaningful, in order to better reflect what is being discussed here?
i've looked at wrt32x dumps of mtd5 and mtd7 saved from factory firmware and after booting into davidc lede.
there is no free-text linux version string.
check out the ..factory.img files:
for wrt3200acm: ascii "ARM linux ......" at offset 32
for wrt32x: hex with nothing decipherable
So, been running htop for 2 days now, today I look at it and memory usage is at 270MB whereas the past day it was 170MB, however nothing in the list, or in ps avxf shows anything using that much memory: See https://pastebin.com/K2zzif1R
Right now it's increasing by 1MB every few minutes or so as far as I can see at a short glance, so it will run out of memory within a few hours, but I have no idea why
What does free output?
root@LEDE-3200ACM:~# free
total used free shared buffers cached
Mem: 510920 313076 197844 1196 6488 19132
-/+ buffers/cache: 287456 223464
Swap: 0 0 0
277M/499M now
edit: 1:35PM (290/499M used)
root@LEDE-3200ACM:~# free
total used free shared buffers cached
Mem: 510920 325952 184968 1196 6488 19136
-/+ buffers/cache: 300328 210592
Swap: 0 0 0
So it's memory usage going up, but no processes actually reflect this memory usage for some reason
From watch /proc/meminfo, looks like Slab, SUnreclaim, and seem to go up consistently, and Active, Active(anon), AnonPages, Mapped, Commited_AS went up a bit at first and seemed to stabilize over the hour I was watching for, so...kernel leak?
Can you try this command to see what might be using memory?
ps -e -o pid,vsz,comm= | sort -n -k 2
root@LEDE-3200ACM:~# ps -e -o pid,vsz,comm= | sort -n -k 2
  PID    VSZ
    1   1328 procd
    2      0 kthreadd
    4      0 kworker/0:0H
    6      0 mm_percpu_wq
    7      0 ksoftirqd/0
    8      0 rcu_sched
    9      0 rcu_bh
   10      0 migration/0
   11      0 cpuhp/0
   12      0 cpuhp/1
   13      0 migration/1
   14      0 ksoftirqd/1
   16      0 kworker/1:0H
  209      0 oom_reaper
  210      0 writeback
  211      0 crypto
  213      0 kblockd
  215      0 ata_sff
  247      0 watchdogd
  281      0 kswapd0
  350      0 pencrypt
  352      0 pdecrypt
  450      0 scsi_eh_0
  451      0 scsi_tmf_0
  454      0 scsi_eh_1
  455      0 scsi_tmf_1
  618      0 irq/43-mmc0
  651      0 irq/39-f1090000
  652      0 irq/40-f1090000
  674      0 ipv6_addrconf
  676      0 dsa_ordered
  714      0 ubi_bgt0d
  721      0 kworker/1:1H
  722      0 kworker/0:1H
  726      0 irq/47-gpio-key
  727      0 irq/48-gpio-key
  836      0 ubifs_bgt0_1
  848      0 ubi_bgt1d
  853      0 ubifs_bgt1_0
 1031    988 ubusd
 1032    676 askfirst
 1100      0 bond0
 1489      0 cryptodev_queue
 1495      0 cfg80211
 1965      0 btmrvl_main_ser
 1966      0 kworker/u5:0
 1975      0 kworker/u5:2
 2011      0 krfcommd
 2362   1004 logd
 2379   1332 rpcd
 2389   1520 haveged
 2470   1448 netifd
 2571   1220 odhcpd
 2619    816 dropbear
 4153   1616 hostapd
 4268   1688 dnscrypt-proxy
 4675   1620 hostapd
 5021   3408 uhttpd
 5153   2576 smbd
 5154   2620 nmbd
 5413   3464 collectd
 5848   1064 sh
 5878   1068 ntpd
18225      0 kworker/0:1
19287    880 dropbear
19288   1064 ash
19481      0 kworker/1:2
21336      0 kworker/0:2
21814      0 kworker/1:0
22931      0 kworker/u4:0
23284      0 kworker/u4:1
23574   1064 sleep
23663      0 kworker/u4:2
23842   1460 ps
23843   1064 sort
and /proc/meminfo is at
root@LEDE-3200ACM:~# cat /proc/meminfo
MemTotal:         510920 kB
MemFree:          144496 kB
MemAvailable:     135136 kB
Buffers:            6488 kB
Cached:            19220 kB
SwapCached:            0 kB
Active:            22280 kB
Inactive:           6808 kB
Active(anon):       4320 kB
Inactive(anon):      256 kB
Active(file):      17960 kB
Inactive(file):     6552 kB
Unevictable:           4 kB
Mlocked:               4 kB
HighTotal:             0 kB
HighFree:              0 kB
LowTotal:         510920 kB
LowFree:          144496 kB
SwapTotal:             0 kB
SwapFree:              0 kB
Dirty:                 0 kB
Writeback:             0 kB
AnonPages:          3408 kB
Mapped:             5884 kB
Shmem:              1196 kB
Slab:             169496 kB
SReclaimable:       5916 kB
SUnreclaim:       163580 kB
KernelStack:         664 kB
PageTables:          348 kB
NFS_Unstable:          0 kB
Bounce:                0 kB
WritebackTmp:          0 kB
CommitLimit:      255460 kB
Committed_AS:       8980 kB
VmallocTotal:     507904 kB
VmallocUsed:           0 kB
VmallocChunk:          0 kB
Notable from meminfo compared to an hour ago is Slab was at 167764, SUnreclaim was at 161860, and MemAvailable was at 155344, but I can't even find 20MB worth of additional memory usage in /proc/meminfo's break down?
Usual suspect on rango is mwlwifi.
lsmod doesn't indicate that any module's memory size has changed in the past hour though? unless lsmod doesn't show the current amount of memory allocated for the module and I misunderstood the size column
I don’t believe you can use a simple offset for zImage.
For reference, another hour later:
MemTotal:         510920 kB
MemFree:          102180 kB
MemAvailable:      92824 kB
Buffers:            6488 kB
Cached:            19220 kB
SwapCached:            0 kB
Active:            23080 kB
Inactive:           6808 kB
Active(anon):       5120 kB
Inactive(anon):      256 kB
Active(file):      17960 kB
Inactive(file):     6552 kB
Unevictable:           4 kB
Mlocked:               4 kB
HighTotal:             0 kB
HighFree:              0 kB
LowTotal:         510920 kB
LowFree:          102180 kB
SwapTotal:             0 kB
SwapFree:              0 kB
Dirty:                 0 kB
Writeback:             0 kB
AnonPages:          4220 kB
Mapped:             6128 kB
Shmem:              1196 kB
Slab:             173324 kB
SReclaimable:       5924 kB
SUnreclaim:       167400 kB
KernelStack:         672 kB
PageTables:          348 kB
NFS_Unstable:          0 kB
Bounce:                0 kB
WritebackTmp:          0 kB
CommitLimit:      255460 kB
Committed_AS:      10052 kB
VmallocTotal:     507904 kB
VmallocUsed:           0 kB
VmallocChunk:          0 kB
root@LEDE-3200ACM:~# ps -e -o pid,vsz,comm= | sort -n -k 2
  PID    VSZ
    1   1328 procd
    2      0 kthreadd
    4      0 kworker/0:0H
    6      0 mm_percpu_wq
    7      0 ksoftirqd/0
    8      0 rcu_sched
    9      0 rcu_bh
   10      0 migration/0
   11      0 cpuhp/0
   12      0 cpuhp/1
   13      0 migration/1
   14      0 ksoftirqd/1
   16      0 kworker/1:0H
  209      0 oom_reaper
  210      0 writeback
  211      0 crypto
  213      0 kblockd
  215      0 ata_sff
  247      0 watchdogd
  281      0 kswapd0
  350      0 pencrypt
  352      0 pdecrypt
  450      0 scsi_eh_0
  451      0 scsi_tmf_0
  454      0 scsi_eh_1
  455      0 scsi_tmf_1
  618      0 irq/43-mmc0
  651      0 irq/39-f1090000
  652      0 irq/40-f1090000
  674      0 ipv6_addrconf
  676      0 dsa_ordered
  714      0 ubi_bgt0d
  721      0 kworker/1:1H
  722      0 kworker/0:1H
  726      0 irq/47-gpio-key
  727      0 irq/48-gpio-key
  836      0 ubifs_bgt0_1
  848      0 ubi_bgt1d
  853      0 ubifs_bgt1_0
 1031    988 ubusd
 1032    676 askfirst
 1100      0 bond0
 1489      0 cryptodev_queue
 1495      0 cfg80211
 1965      0 btmrvl_main_ser
 1966      0 kworker/u5:0
 1975      0 kworker/u5:2
 2011      0 krfcommd
 2362   1004 logd
 2379   1332 rpcd
 2389   1520 haveged
 2470   1448 netifd
 2571   1220 odhcpd
 2619    816 dropbear
 4153   1616 hostapd
 4268   1688 dnscrypt-proxy
 4675   1620 hostapd
 5021   3408 uhttpd
 5153   2576 smbd
 5154   2620 nmbd
 5413   3464 collectd
 5848   1064 sh
 5878   1068 ntpd
18225      0 kworker/0:1
19287    880 dropbear
19288   1068 ash
19481      0 kworker/1:2
21336      0 kworker/0:2
27994      0 kworker/1:1
29583      0 kworker/u4:0
30213   1064 sleep
30246      0 kworker/u4:2
30811      0 kworker/u4:1
30844   1460 ps
30845   1064 sort