Measure network traffic per host via prometheus

I want to build a Grafana dashboard that shows the network traffic per host connected to my Linksys WRT1900AC router which is running OpenWRT release 19.07.3.

I have installed the following packages:

  • prometheus-node-exporter-lua
  • prometheus-node-exporter-lua-nat_traffic
  • prometheus-node-exporter-lua-netstat
  • prometheus-node-exporter-lua-openwrt
  • prometheus-node-exporter-lua-wifi
  • prometheus-node-exporter-lua-wifi_stations

... and imported the following Grafana dashboard: https://grafana.com/grafana/dashboards/11147

Now I want to add a custom panel which shows the transmit and received kbps per host. For the hosts connected via WIFI, I can use the metrics shown in the sample below and filter by the various MAC addresses.

wifi_station_transmit_kilobits_per_second{mac="E0:DB:10:38:DB:5F",ifname="wlan0"} 26000
wifi_station_receive_kilobits_per_second{mac="E0:DB:10:38:DB:5F",ifname="wlan0"} 48000
wifi_station_transmit_packets_total{mac="E0:DB:10:38:DB:5F",ifname="wlan0"} 177322
wifi_station_receive_packets_total{mac="E0:DB:10:38:DB:5F",ifname="wlan0"} 62329

However I cannot find similar metrics per MAC address for hosts that are connected via LAN.

What do you recommend?

Hey, Sorry I'm not gonna be much use. But more would like to know how you get the data into Prometheus? I installed all the lua packages, but don't know where to make the changes on prometheus to expose the metrics in grafana. All I see in grafana are the metrics internal to prometheus.

Thanks in advance!

Hello,

First I would recommend to check that the node exporter is correctly installed on your openwrt router, and that it is listening on port 9100. As an example, if your router IP address is 192.168.2.50, use a browser on the host where Prometheus is installed and type this url:

http://192.168.2.50:9100/metrics

That should return a list of metrics.

Next step is to add the openwrt exporter to the section static_configs in the prometheus.yml config file. Assuming same IP address, you need to add:

    static_configs:
    - targets: ['localhost:9090']
    - targets: ['192.168.2.50:9100']

Finally, restart the prometheus service.

sudo systemctl restart prometheus

Hope this helps.

Thanks. Mine is@ 10.0.1.1, so i did try http://10.0.1.1:9100 and got a refused to connect.

So that I'm sure is where my issue lies.

When you say add to the prometheus.yml config file, is that a yml file on the opnwrt? or do you have a centralized prometheus in your network that is accepting endpoint inputs from multiple targets? Seems like the former. But I haven't been able to get the multiple targets thing to work. I have two ubuntu vms spun up and had to install prometheus on each, then add separate data sources and use http://ip address:9090 for each data source in grafana. BTW, if you couldn't tell, I'm on like my second day using prometheus/grafana. So thanks for your suggestion above.

I think you have same binding issue to local host 127.0.0.1 that I had earlier.

Checkout the solution in this post Cannot open a port on router

Hi @jsammut ,

I would like to have the same metrics, too. Did you have any solution at last?

Thx

Iptmon scripts + collectd package + influxdb1.8 + grafana works great.

collectd can push data to InfluxDB, which can in turn be used as a data source for Grafana dashboards.

Here is an example of my setup in grafana. Hostnames are auto populated
::

1 Like

Did you ever figure this out @jsammut ?

Per host bandwidth is something I want, but I can't seem to find a way to do it.
The iptmon approach above doesn't seem to work with my master builds without some extra config and even then it's not consistent with other bandwidth monitoring I have.

I want to get per host and into prometheus if possible but I'm open to other databases that would allow me to query data used by month as well which is another problem i'm running into.

Hi @pewter77 I did not figure this out yet. Would be interested if you find a solution to it.

I ended up going with netlink monitor, forget the actual thing.
Mine is an x86 with an ssd so I also save it into a 3rd permanent partition.

Maybe i'll upload it into prometheus, but I'm not exactly happy with it since it's not very granular but as time goes on I'll be glad to have it while I look for solutions since I would probably drop that granular data anyway and only really want it for the last month or two.

@pewter77 I finally managed to complete this task.

I used @Beniamin suggestion - that is iptmon. However since I had already a prometheus instance running, I avoided another influxdb instance by using a collectd exporter for prometheus.

It works great.

1 Like

Can you post a quick how-to?

On OpenWRT (on the router):

  1. install iptmon, checking the dependencies https://github.com/oofnikj/iptmon
  2. add a new conf file/etc.collectd/conf.d/send-to-exporter.conf (name not important). In this file include the ip and port of the receiver. In my case the receiver is my raspberry pi. The file contains the following:

On the raspberry pi:

  1. install grafana and prometheus
  2. install the collectd exporter https://github.com/prometheus/collectd_exporter
2 Likes

Thank you.
Can you share your dashboard?
I was able to get export or going but I'm having a hard time getting the data right in grafana. I'm more familiar with influxdb.

Did you mean to write "getting the data right in prometheus."?

I did not spend enough time yet on a decent dashboard, but I will share the work done so far in the json file below. Hope this helps.

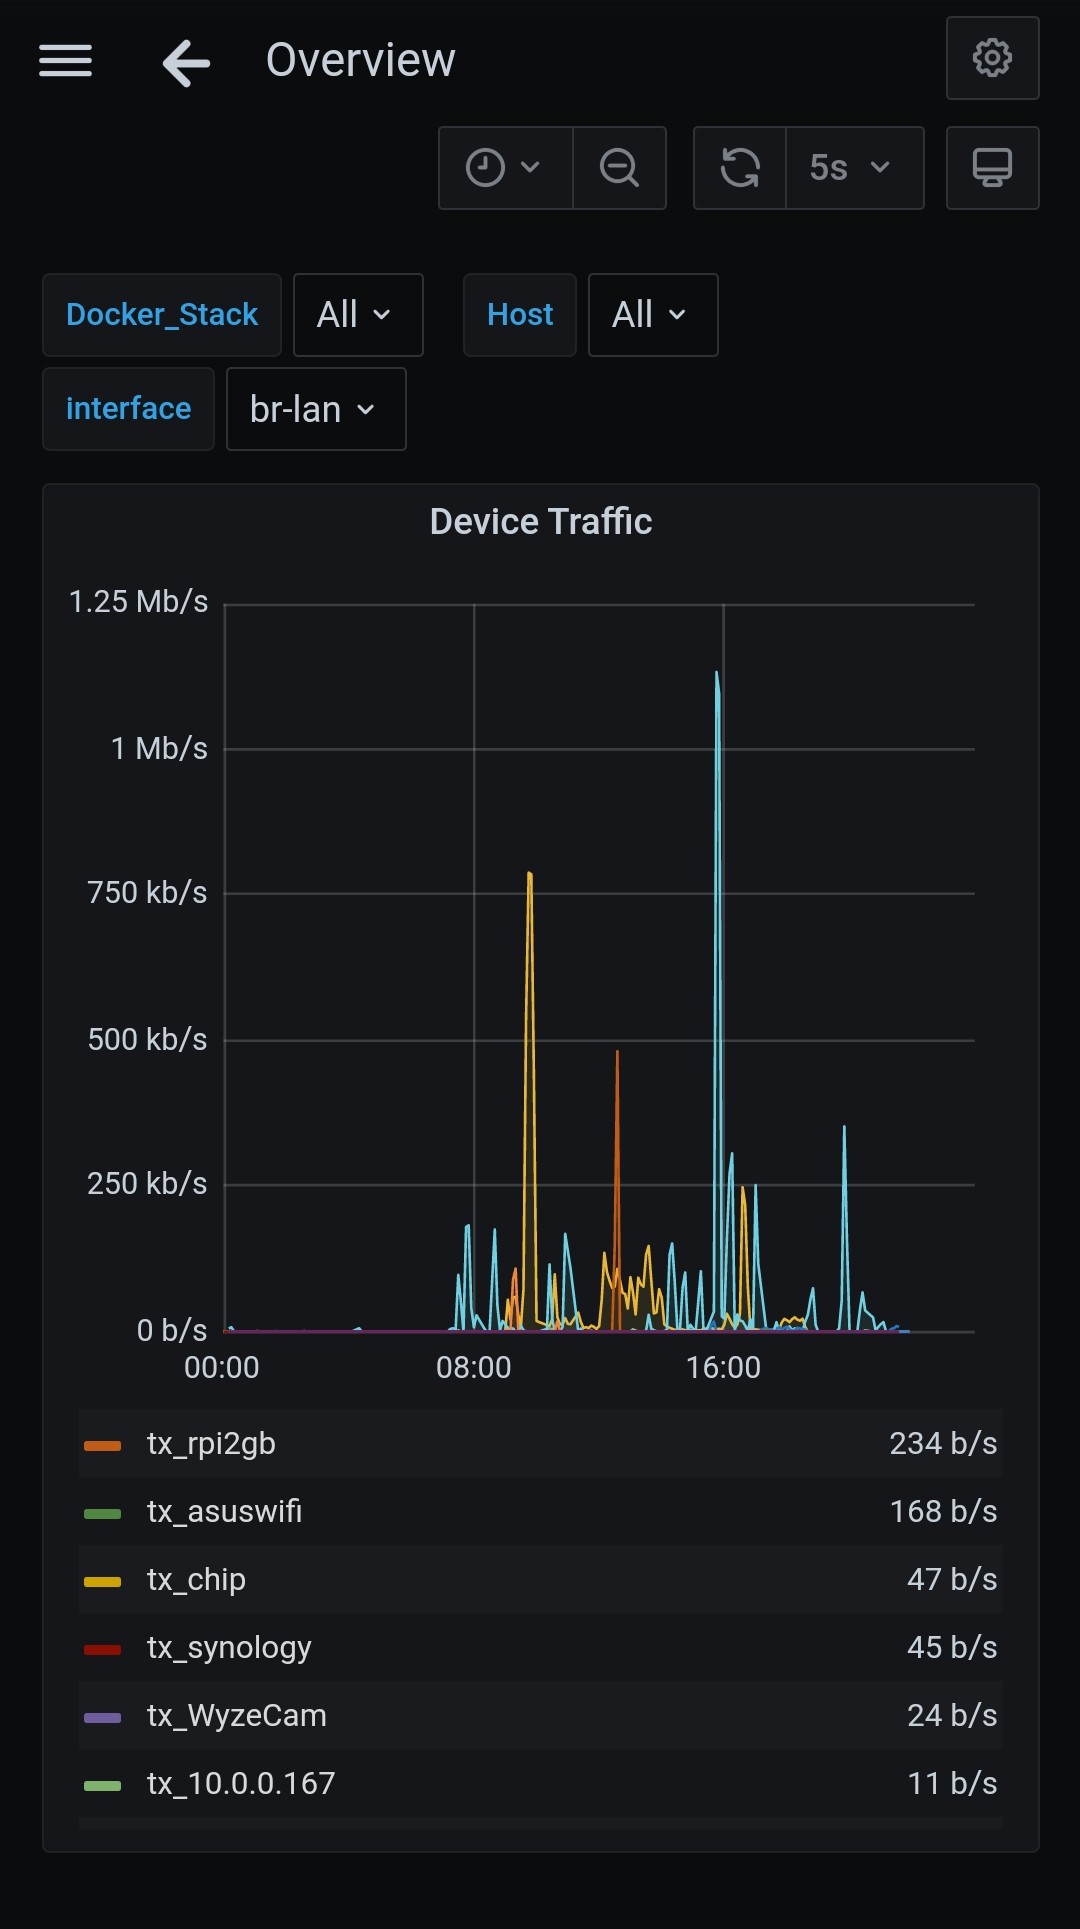
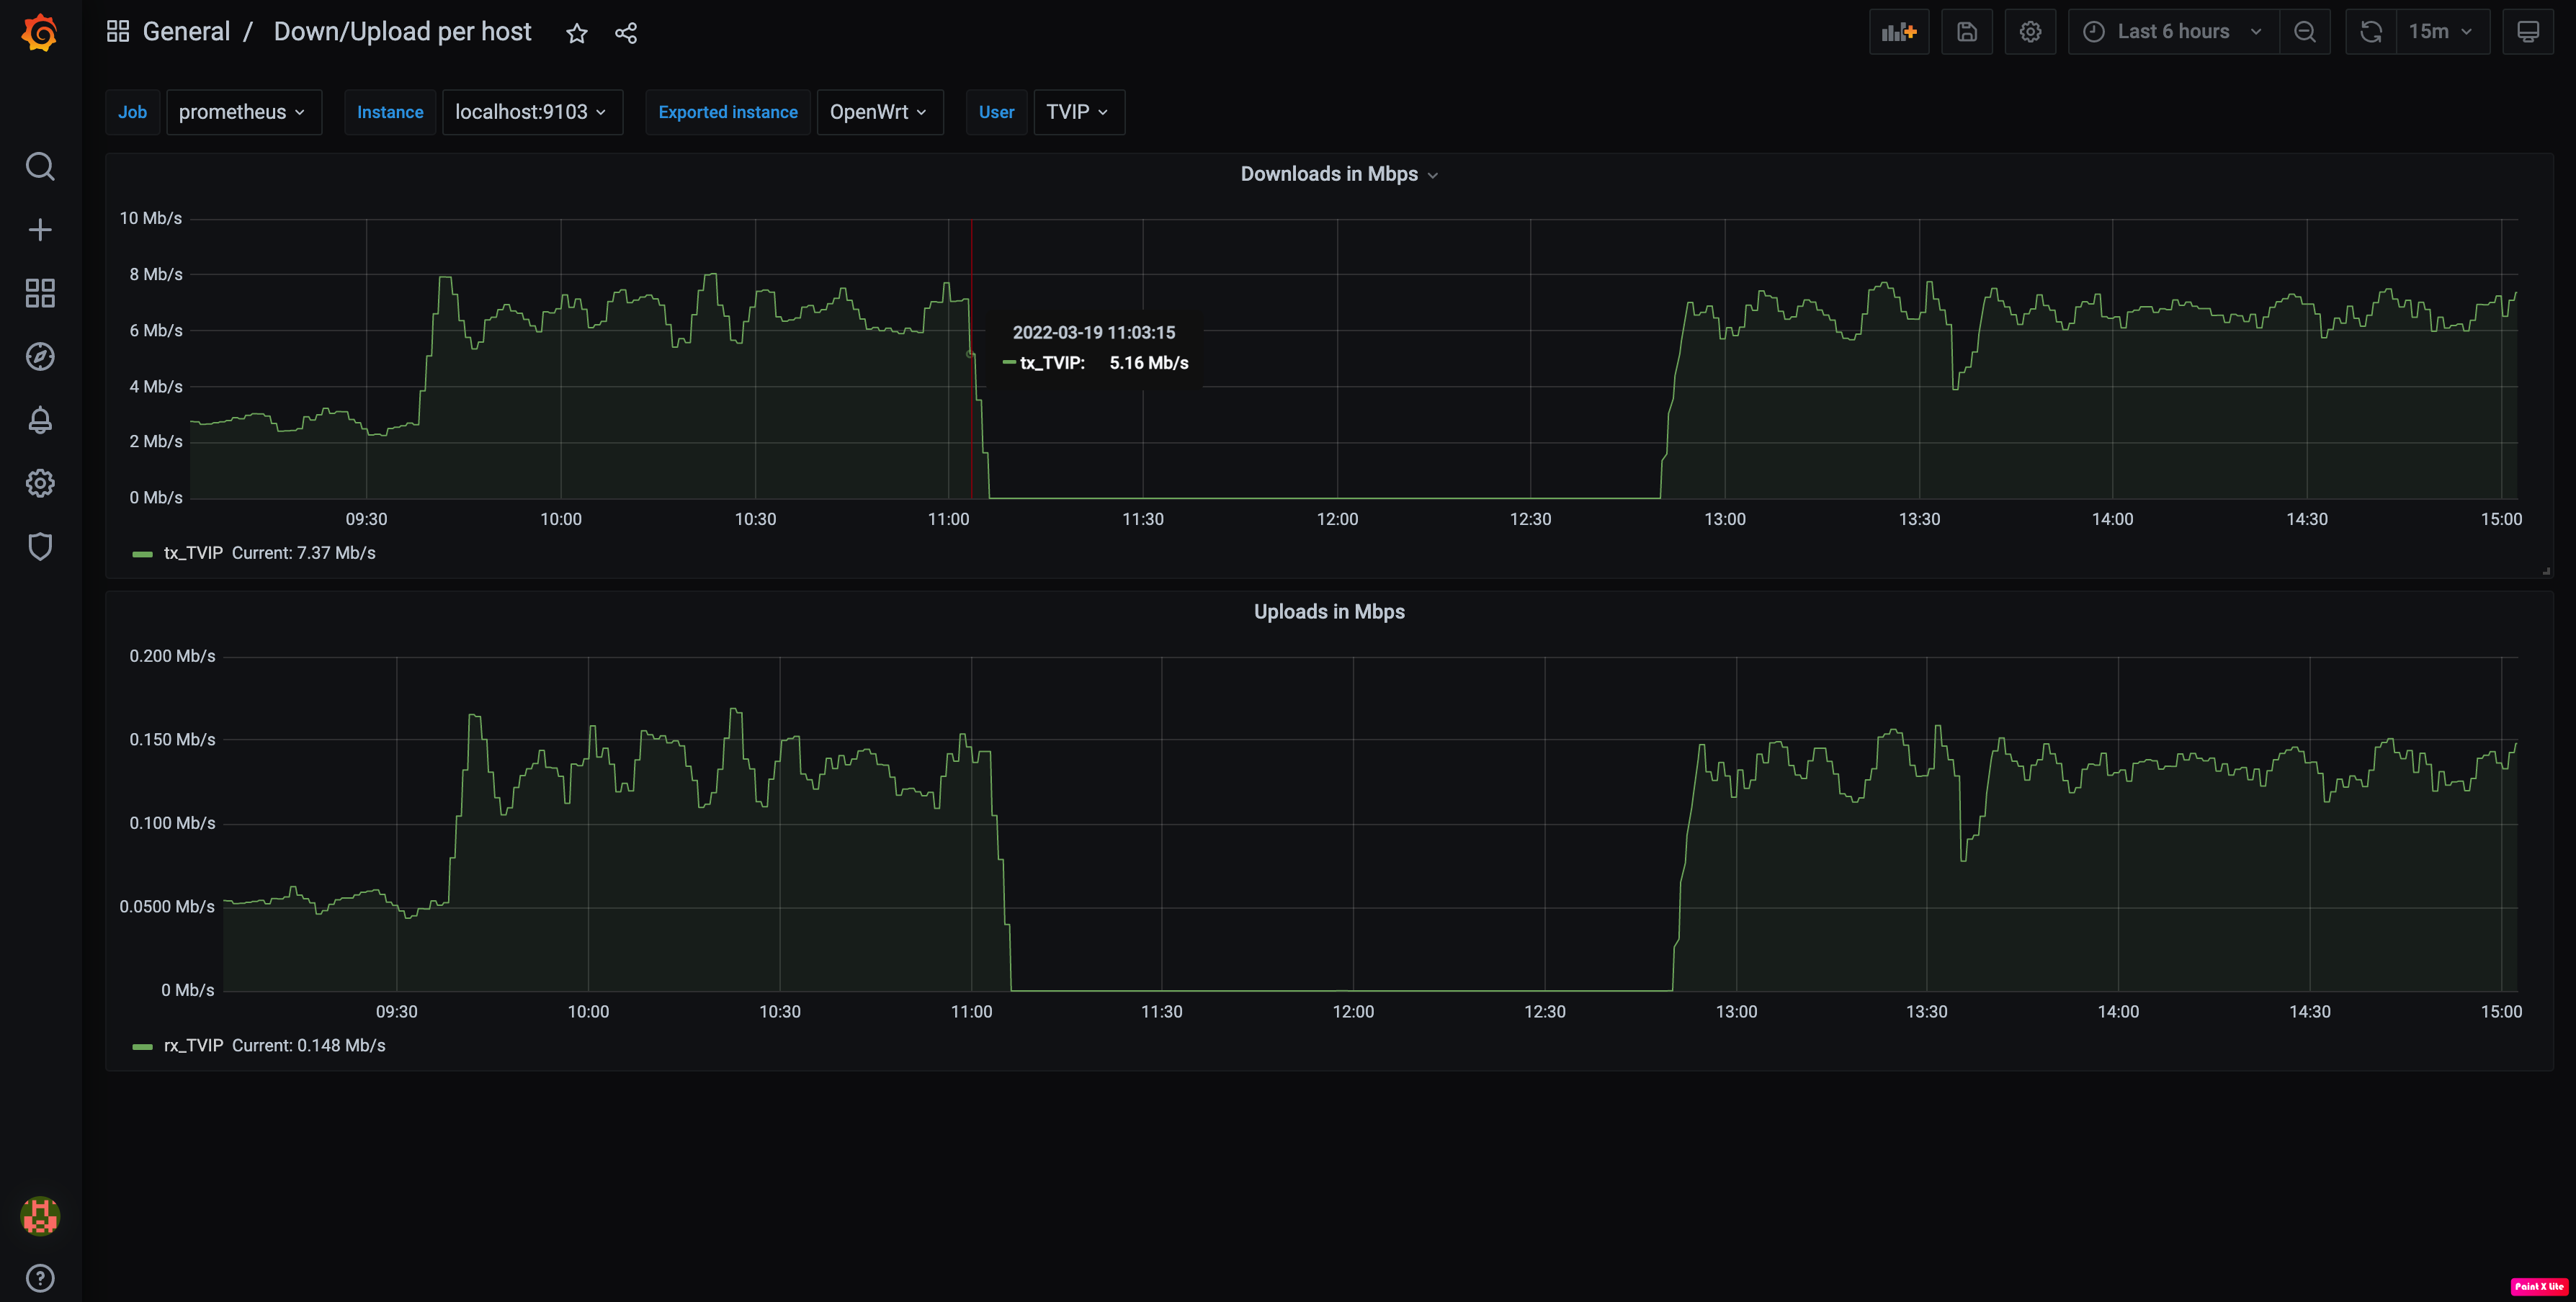
This is how it looks so far. It can surely be optimised further.

{
  "__inputs": [
    {
      "name": "DS_PROMETHEUS",
      "label": "Prometheus",
      "description": "",
      "type": "datasource",
      "pluginId": "prometheus",
      "pluginName": "Prometheus"
    }
  ],
  "__requires": [
    {
      "type": "grafana",
      "id": "grafana",
      "name": "Grafana",
      "version": "7.5.10"
    },
    {
      "type": "panel",
      "id": "graph",
      "name": "Graph",
      "version": ""
    },
    {
      "type": "datasource",
      "id": "prometheus",
      "name": "Prometheus",
      "version": "1.0.0"
    }
  ],
  "annotations": {
    "list": [
      {
        "builtIn": 1,
        "datasource": "-- Grafana --",
        "enable": true,
        "hide": true,
        "iconColor": "rgba(0, 211, 255, 1)",
        "name": "Annotations & Alerts",
        "type": "dashboard"
      }
    ]
  },
  "editable": true,
  "gnetId": null,
  "graphTooltip": 0,
  "id": null,
  "iteration": 1647698874065,
  "links": [],
  "panels": [
    {
      "aliasColors": {},
      "bars": false,
      "dashLength": 10,
      "dashes": false,
      "datasource": null,
      "fieldConfig": {
        "defaults": {
          "unit": "Mbits"
        },
        "overrides": []
      },
      "fill": 1,
      "fillGradient": 0,
      "gridPos": {
        "h": 8,
        "w": 24,
        "x": 0,
        "y": 0
      },
      "hiddenSeries": false,
      "id": 2,
      "legend": {
        "alignAsTable": false,
        "avg": false,
        "current": true,
        "max": false,
        "min": false,
        "rightSide": false,
        "show": true,
        "total": false,
        "values": true
      },
      "lines": true,
      "linewidth": 1,
      "nullPointMode": "null",
      "options": {
        "alertThreshold": true
      },
      "percentage": false,
      "pluginVersion": "7.5.10",
      "pointradius": 2,
      "points": false,
      "renderer": "flot",
      "seriesOverrides": [],
      "spaceLength": 10,
      "stack": false,
      "steppedLine": false,
      "targets": [
        {
          "exemplar": true,
          "expr": "rate(collectd_iptables_ipt_bytes_total{exported_instance=\"$exported_instance\", instance=\"$instance\",type=~\"tx_$user\"}[5m]) * 8 / 1000 / 1000",
          "interval": "",
          "legendFormat": "{{type}}",
          "refId": "A"
        }
      ],
      "thresholds": [],
      "timeFrom": null,
      "timeRegions": [],
      "timeShift": null,
      "title": "Downloads in Mbps",
      "tooltip": {
        "shared": true,
        "sort": 0,
        "value_type": "individual"
      },
      "type": "graph",
      "xaxis": {
        "buckets": null,
        "mode": "time",
        "name": null,
        "show": true,
        "values": []
      },
      "yaxes": [
        {
          "format": "Mbits",
          "label": null,
          "logBase": 1,
          "max": null,
          "min": null,
          "show": true
        },
        {
          "format": "short",
          "label": null,
          "logBase": 1,
          "max": null,
          "min": null,
          "show": true
        }
      ],
      "yaxis": {
        "align": false,
        "alignLevel": null
      }
    },
    {
      "aliasColors": {
        "rx_Iphone-11-John": "red"
      },
      "bars": false,
      "dashLength": 10,
      "dashes": false,
      "datasource": null,
      "fieldConfig": {
        "defaults": {
          "unit": "Mbits"
        },
        "overrides": []
      },
      "fill": 1,
      "fillGradient": 0,
      "gridPos": {
        "h": 9,
        "w": 24,
        "x": 0,
        "y": 8
      },
      "hiddenSeries": false,
      "id": 3,
      "legend": {
        "avg": false,
        "current": true,
        "max": false,
        "min": false,
        "show": true,
        "total": false,
        "values": true
      },
      "lines": true,
      "linewidth": 1,
      "nullPointMode": "null",
      "options": {
        "alertThreshold": true
      },
      "percentage": false,
      "pluginVersion": "7.5.10",
      "pointradius": 2,
      "points": false,
      "renderer": "flot",
      "seriesOverrides": [],
      "spaceLength": 10,
      "stack": false,
      "steppedLine": false,
      "targets": [
        {
          "exemplar": true,
          "expr": "rate(collectd_iptables_ipt_bytes_total{exported_instance=\"$exported_instance\", instance=\"$instance\",type=~\"rx_$user\"}[5m]) * 8 / 1000 / 1000",
          "interval": "",
          "legendFormat": "{{type}}",
          "refId": "A"
        }
      ],
      "thresholds": [],
      "timeFrom": null,
      "timeRegions": [],
      "timeShift": null,
      "title": "Uploads in Mbps",
      "tooltip": {
        "shared": true,
        "sort": 0,
        "value_type": "individual"
      },
      "type": "graph",
      "xaxis": {
        "buckets": null,
        "mode": "time",
        "name": null,
        "show": true,
        "values": []
      },
      "yaxes": [
        {
          "format": "Mbits",
          "label": null,
          "logBase": 1,
          "max": null,
          "min": null,
          "show": true
        },
        {
          "format": "short",
          "label": null,
          "logBase": 1,
          "max": null,
          "min": null,
          "show": true
        }
      ],
      "yaxis": {
        "align": false,
        "alignLevel": null
      }
    }
  ],
  "refresh": "15m",
  "schemaVersion": 27,
  "style": "dark",
  "tags": [],
  "templating": {
    "list": [
      {
        "allValue": null,
        "current": {},
        "datasource": "${DS_PROMETHEUS}",
        "definition": "label_values(collectd_exporter_build_info, job)",
        "description": null,
        "error": null,
        "hide": 0,
        "includeAll": false,
        "label": "Job",
        "multi": false,
        "name": "job",
        "options": [],
        "query": {
          "query": "label_values(collectd_exporter_build_info, job)",
          "refId": "StandardVariableQuery"
        },
        "refresh": 1,
        "regex": "",
        "skipUrlSync": false,
        "sort": 1,
        "tagValuesQuery": "",
        "tags": [],
        "tagsQuery": "",
        "type": "query",
        "useTags": false
      },
      {
        "allValue": null,
        "current": {},
        "datasource": "${DS_PROMETHEUS}",
        "definition": "label_values(collectd_exporter_build_info{job=\"$job\"}, instance)",
        "description": null,
        "error": null,
        "hide": 0,
        "includeAll": false,
        "label": "Instance",
        "multi": false,
        "name": "instance",
        "options": [],
        "query": {
          "query": "label_values(collectd_exporter_build_info{job=\"$job\"}, instance)",
          "refId": "StandardVariableQuery"
        },
        "refresh": 1,
        "regex": "",
        "skipUrlSync": false,
        "sort": 1,
        "tagValuesQuery": "",
        "tags": [],
        "tagsQuery": "",
        "type": "query",
        "useTags": false
      },
      {
        "allValue": null,
        "current": {},
        "datasource": "${DS_PROMETHEUS}",
        "definition": "label_values(collectd_iptables_ipt_bytes_total{instance=\"$instance\"}, exported_instance)",
        "description": null,
        "error": null,
        "hide": 0,
        "includeAll": false,
        "label": "Exported instance",
        "multi": false,
        "name": "exported_instance",
        "options": [],
        "query": {
          "query": "label_values(collectd_iptables_ipt_bytes_total{instance=\"$instance\"}, exported_instance)",
          "refId": "StandardVariableQuery"
        },
        "refresh": 1,
        "regex": "",
        "skipUrlSync": false,
        "sort": 1,
        "tagValuesQuery": "",
        "tags": [],
        "tagsQuery": "",
        "type": "query",
        "useTags": false
      },
      {
        "allValue": null,
        "current": {},
        "datasource": "${DS_PROMETHEUS}",
        "definition": "label_values(collectd_iptables_ipt_bytes_total{exported_instance=\"$exported_instance\"},  type)",
        "description": null,
        "error": null,
        "hide": 0,
        "includeAll": false,
        "label": "User",
        "multi": false,
        "name": "user",
        "options": [],
        "query": {
          "query": "label_values(collectd_iptables_ipt_bytes_total{exported_instance=\"$exported_instance\"},  type)",
          "refId": "StandardVariableQuery"
        },
        "refresh": 1,
        "regex": "/[tx]+_(.*)/",
        "skipUrlSync": false,
        "sort": 0,
        "tagValuesQuery": "",
        "tags": [],
        "tagsQuery": "",
        "type": "query",
        "useTags": false
      }
    ]
  },
  "time": {
    "from": "now-6h",
    "to": "now"
  },
  "timepicker": {
    "refresh_intervals": [
      "5s",
      "10s",
      "30s",
      "1m",
      "5m",
      "15m",
      "30m",
      "1h",
      "2h",
      "1d"
    ]
  },
  "timezone": "",
  "title": "Down/Upload per host",
  "uid": "D48vAxmgk",
  "version": 15
}

I'm in the same situation, now I'm using both InfluxDB and Prometheus to build my Grafana dashboard, but have only Prometheus would be great, infact are some days that I'm trying to do, but I'm having some troubles to run the collectd_exporter.

My config, in OpenWRT I have:

LoadPlugin network
104 <Plugin network>
105         Server "192.168.1.6" "25827"
106         Server "192.168.1.6" "25826"
107         ReportStats false
108 </Plugin>

(25827 is the port to send to Prometheus collectd, and 25286 is for InfluxDB)

on my RPi server I put the plugin in the "Prometheus folder":

root@Grafana:/home/dietpi/prometheus# ls
LICENSE  NOTICE  collectd_exporter  console_libraries  consoles  data  prometheus  prometheus.yml  promtool

Then I started the collectd_exporter with:

root@Grafana:/home/dietpi/prometheus# ./collectd_exporter --collectd.listen-address=":25827"
level=info ts=2022-05-27T20:09:37.229Z caller=main.go:321 msg="Starting collectd_exporter" version="(version=, branch=, revision=)"
level=info ts=2022-05-27T20:09:37.229Z caller=main.go:322 msg="Build context" context="(go=go1.14.2, user=, date=)"
level=info ts=2022-05-27T20:09:37.229Z caller=main.go:344 msg="Listening on address" address=:9103

But in Grafana when I try to add the new Prometheus-collectd_exporter DB with url http://192.168.1.6:9103 I get this error:

Error reading Prometheus: bad_response: readObjectStart: expect { or n, but found <, error found in #1 byte of ...|<html> |..., bigger context ...|<html> <head><title>Collectd Exporter<|...

Probably I'm doing sme stupid things since I'm new with Grafana, but what? Thanks!

Here is my post on another forum. it uses Prometheus with Collectd-exporter and Grafana. Dashboard could use some work and adjustments, first time using prom and grafana together.

1 Like

Problem: iptmon doesn't seem compatible with 22.x openWRT firmware...

I would stick with 21.x if you need a solid solution.