Thanks, OldNavyGuy, for the response.
Here's a summary of what I found with 21.02 handling high volumes of WAN-->LAN traffic
- sysstat shows system CPU goes to 80+ % under load. This does not differentiate CPU 0 from CPU 1.
- mpstat -P ALL shows CPU0 "%soft" (software interrupt servicing) use going to 93% under load
- top shows ksoftirqd to be using high CPU
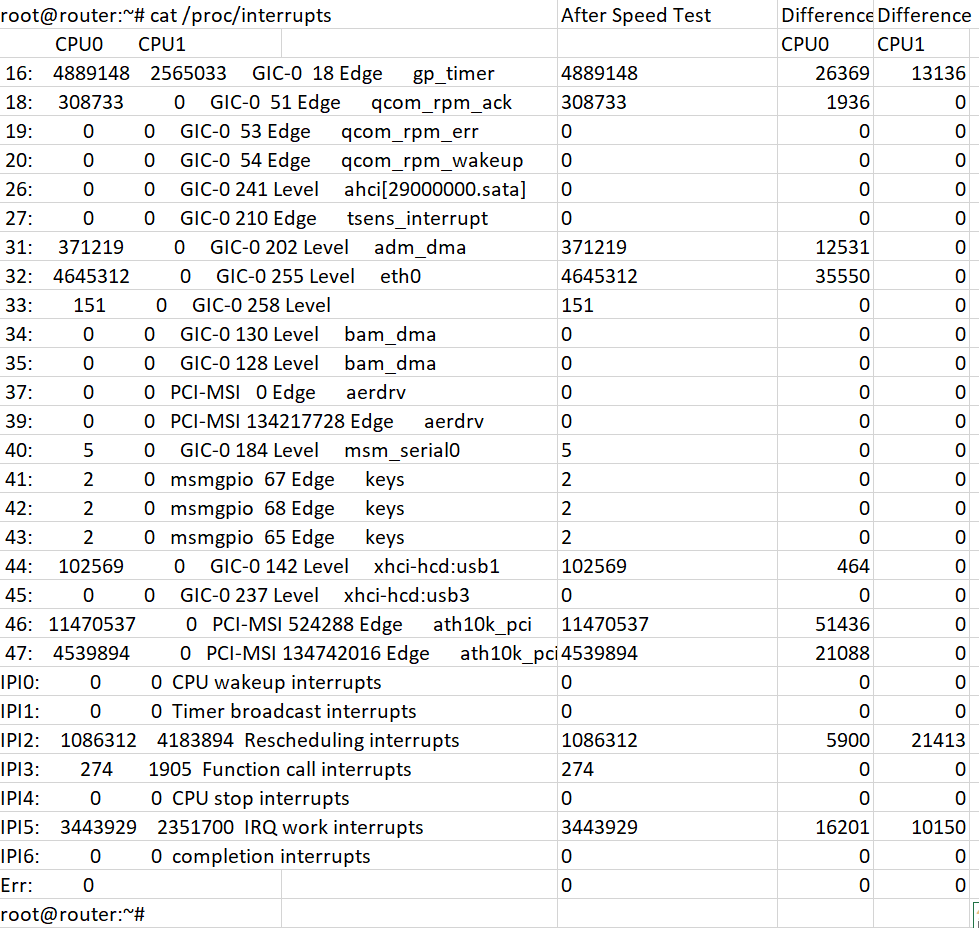
- Lots of interrupts during the speed test. Attached is an image with a table listing the quantity of each interrupt on each CPU that happened during the ~10s speed test.
I don't know enough about openwrt SW architecture to fully understand what's happening.
Details are below. The difference in interrupt counts includes the speed test plus about 2 minutes of browsing under light load while collecting data from the speed test.
root@router:~# cat /proc/interrupts
           CPU0       CPU1
 16:    4862779    2551897     GIC-0  18 Edge      gp_timer
 18:     306797          0     GIC-0  51 Edge      qcom_rpm_ack
 19:          0          0     GIC-0  53 Edge      qcom_rpm_err
 20:          0          0     GIC-0  54 Edge      qcom_rpm_wakeup
 26:          0          0     GIC-0 241 Level     ahci[29000000.sata]
 27:          0          0     GIC-0 210 Edge      tsens_interrupt
 31:     358688          0     GIC-0 202 Level     adm_dma
 32:    4609762          0     GIC-0 255 Level     eth0
 33:        151          0     GIC-0 258 Level
 34:          0          0     GIC-0 130 Level     bam_dma
 35:          0          0     GIC-0 128 Level     bam_dma
 37:          0          0   PCI-MSI   0 Edge      aerdrv
 39:          0          0   PCI-MSI 134217728 Edge      aerdrv
 40:          5          0     GIC-0 184 Level     msm_serial0
 41:          2          0   msmgpio  67 Edge      keys
 42:          2          0   msmgpio  68 Edge      keys
 43:          2          0   msmgpio  65 Edge      keys
 44:     102105          0     GIC-0 142 Level     xhci-hcd:usb1
 45:          0          0     GIC-0 237 Level     xhci-hcd:usb3
 46:   11419101          0   PCI-MSI 524288 Edge      ath10k_pci
 47:    4518806          0   PCI-MSI 134742016 Edge      ath10k_pci
IPI0:          0          0  CPU wakeup interrupts
IPI1:          0          0  Timer broadcast interrupts
IPI2:    1080412    4162481  Rescheduling interrupts
IPI3:        274       1905  Function call interrupts
IPI4:          0          0  CPU stop interrupts
IPI5:    3427728    2341550  IRQ work interrupts
IPI6:          0          0  completion interrupts
Err:          0
21.02 sysstat with minimal internet traffic:
Linux 5.4.179 (router) 04/17/22 armv7l (2 CPU)
18:22:20      UID       PID    %usr %system  %guest   %wait    %CPU   CPU  Command
18:22:22        0        10    0.00    0.49    0.00    0.00    0.49     1  rcu_sched
18:22:22        0       323    0.00    0.49    0.00    0.00    0.49     0  urngd
18:22:22        0      1162    0.49    0.00    0.00    0.00    0.49     0  netifd
18:22:22      453      2843    0.49    0.00    0.00    0.00    0.49     1  dnsmasq
18:22:22        0     22199    0.00    0.49    0.00    0.00    0.49     0  kworker/0:1-events
18:22:22        0     23922    0.49    0.00    0.00    0.00    0.49     1  kworker/1:0-events
18:22:22        0     24876    0.99    0.99    0.00    0.00    1.97     1  pidstat
21.02 sysstat while running 335 Mbps from internet WAN to LAN (Xfinity speed test):
18:24:22      UID       PID    %usr %system  %guest   %wait    %CPU   CPU  Command
18:24:24        0         9    0.00   84.00    0.00    0.00   84.00     0  ksoftirqd/0
18:24:24        0       173    0.00    0.50    0.00    0.00    0.50     1  usb-storage
18:24:24       81       248    0.00    0.50    0.00    0.00    0.50     1  ubusd
18:24:24        0       323    0.50    0.00    0.00    0.00    0.50     1  urngd
18:24:24        0      1099    0.50    0.50    0.00    0.00    1.00     1  hostapd
18:24:24        0      1960    0.00    0.50    0.00    0.00    0.50     0  charon
18:24:24        0     22199    0.00    0.50    0.00    0.00    0.50     0  kworker/0:1-events
18:24:24        0     22283    0.50    0.00    0.00    0.00    0.50     1  dropbear
18:24:24        0     23922    0.00    0.50    0.00    0.00    0.50     1  kworker/1:0-events
18:24:24        0     24876    0.50    1.00    0.00    0.00    1.50     1  pidstat
And finally, here's a copy of /proc/interrupts after the speed test:
root@router:~# cat /proc/interrupts
           CPU0       CPU1
 16:    4889148    2565033     GIC-0  18 Edge      gp_timer
 18:     308733          0     GIC-0  51 Edge      qcom_rpm_ack
 19:          0          0     GIC-0  53 Edge      qcom_rpm_err
 20:          0          0     GIC-0  54 Edge      qcom_rpm_wakeup
 26:          0          0     GIC-0 241 Level     ahci[29000000.sata]
 27:          0          0     GIC-0 210 Edge      tsens_interrupt
 31:     371219          0     GIC-0 202 Level     adm_dma
 32:    4645312          0     GIC-0 255 Level     eth0
 33:        151          0     GIC-0 258 Level
 34:          0          0     GIC-0 130 Level     bam_dma
 35:          0          0     GIC-0 128 Level     bam_dma
 37:          0          0   PCI-MSI   0 Edge      aerdrv
 39:          0          0   PCI-MSI 134217728 Edge      aerdrv
 40:          5          0     GIC-0 184 Level     msm_serial0
 41:          2          0   msmgpio  67 Edge      keys
 42:          2          0   msmgpio  68 Edge      keys
 43:          2          0   msmgpio  65 Edge      keys
 44:     102569          0     GIC-0 142 Level     xhci-hcd:usb1
 45:          0          0     GIC-0 237 Level     xhci-hcd:usb3
 46:   11470537          0   PCI-MSI 524288 Edge      ath10k_pci
 47:    4539894          0   PCI-MSI 134742016 Edge      ath10k_pci
IPI0:          0          0  CPU wakeup interrupts
IPI1:          0          0  Timer broadcast interrupts
IPI2:    1086312    4183894  Rescheduling interrupts
IPI3:        274       1905  Function call interrupts
IPI4:          0          0  CPU stop interrupts
IPI5:    3443929    2351700  IRQ work interrupts
IPI6:          0          0  completion interrupts
Err:          0
----mpstat -P ALL while executing speed test
19:14:12     CPU    %usr   %nice    %sys %iowait    %irq   %soft  %steal  %guest  %gnice   %idle
19:14:15     all    0.51    0.00    0.34    0.00    0.00   46.79    0.00    0.00    0.00   52.36
19:14:15       0    0.00    0.00    0.00    0.00    0.00   92.95    0.00    0.00    0.00    7.05
19:14:15       1    1.02    0.00    0.68    0.00    0.00    0.00    0.00    0.00    0.00   98.30
Regards,
Alex