I seem to be frustratingly close to having OpenWRT show graphs from my NAS running TrueNAS Core 13.0-U6.4. I understand that any changes made to the /usr/local/etc/collectd.conf file on the NAS are lost upon reboot so I'm not inclined to try set up the Network output plugin, unlike my three Raspberry Pi servers and an access point also running OpenWRT which do work using that method. I have instead set up a 10 minutely cronjob to transfer the contents of /var/db/collectd/rrd/ from the NAS to my router's /tmp/rrd folder via SCP.
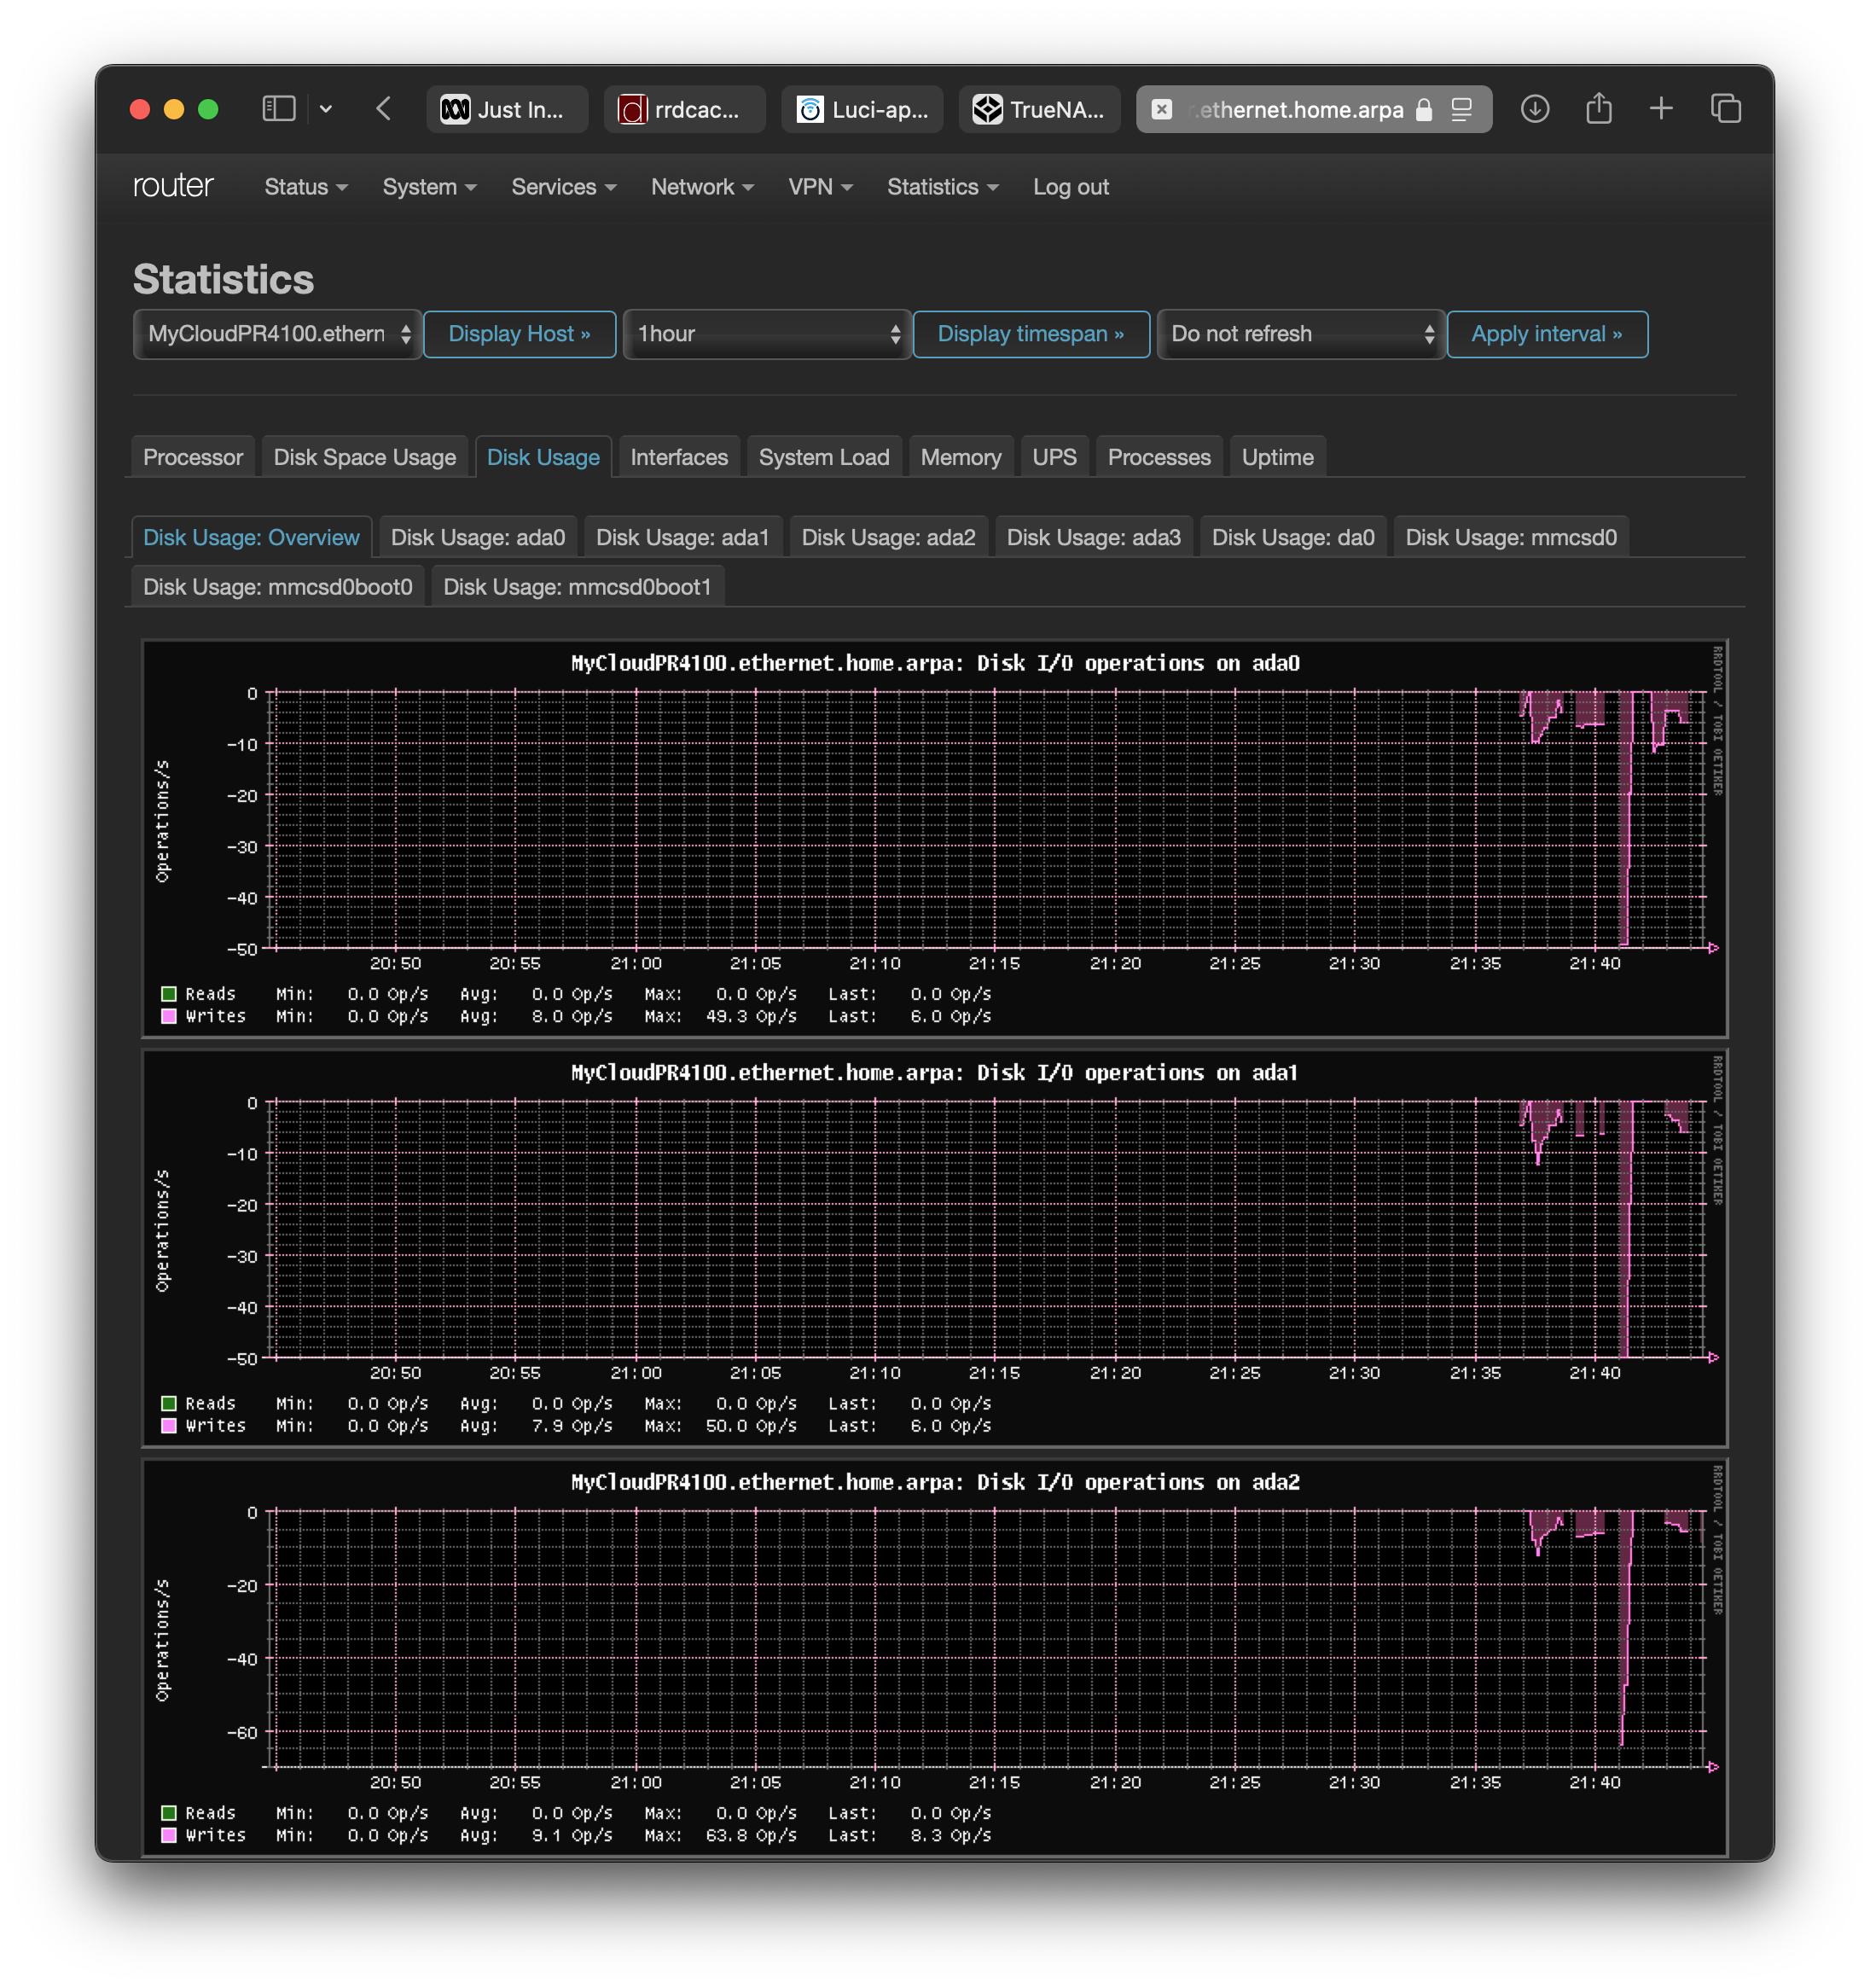
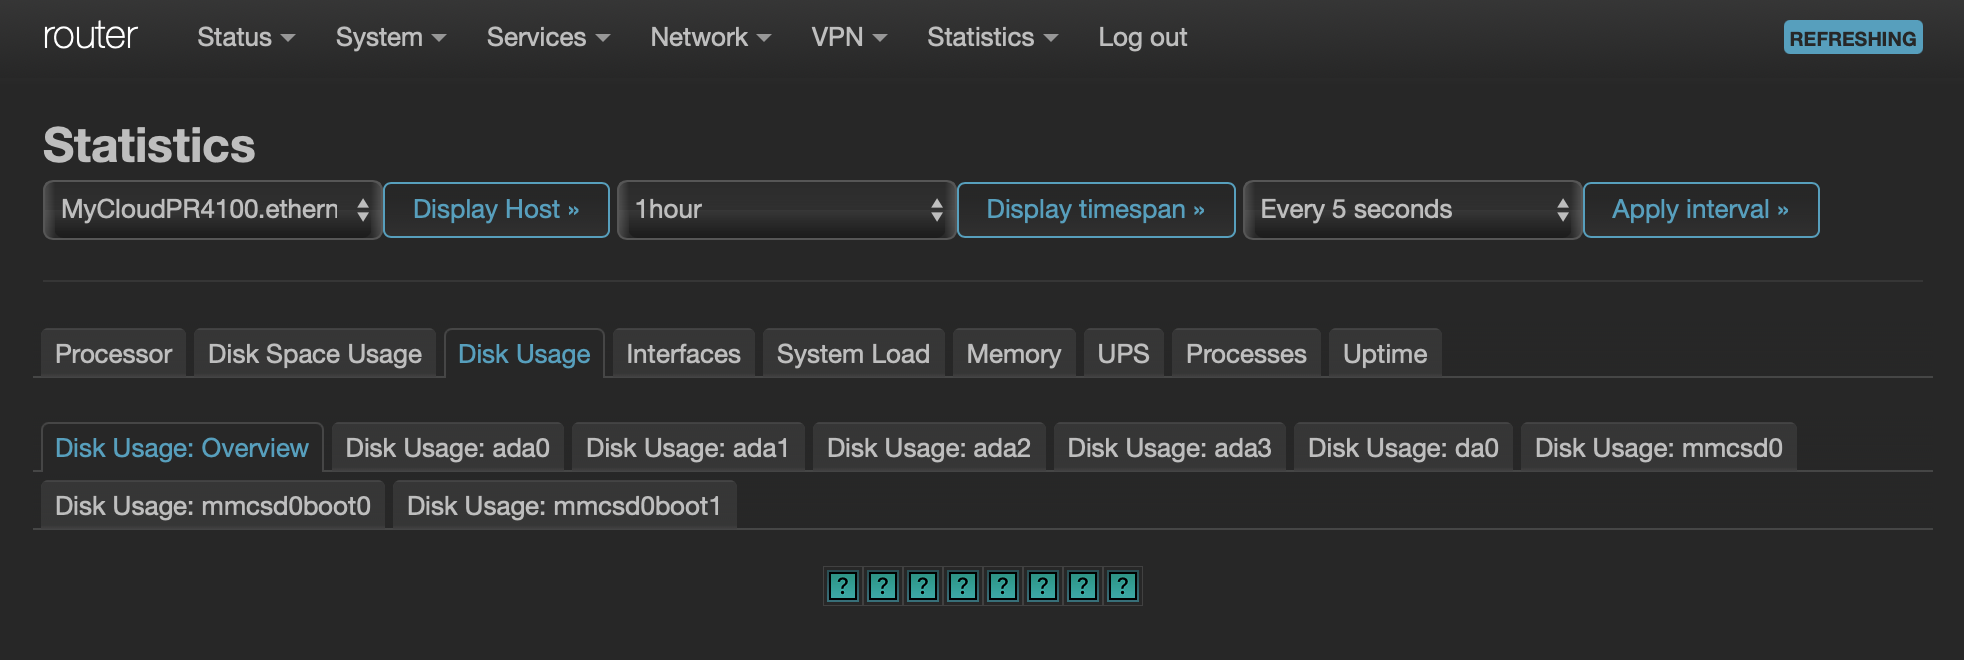
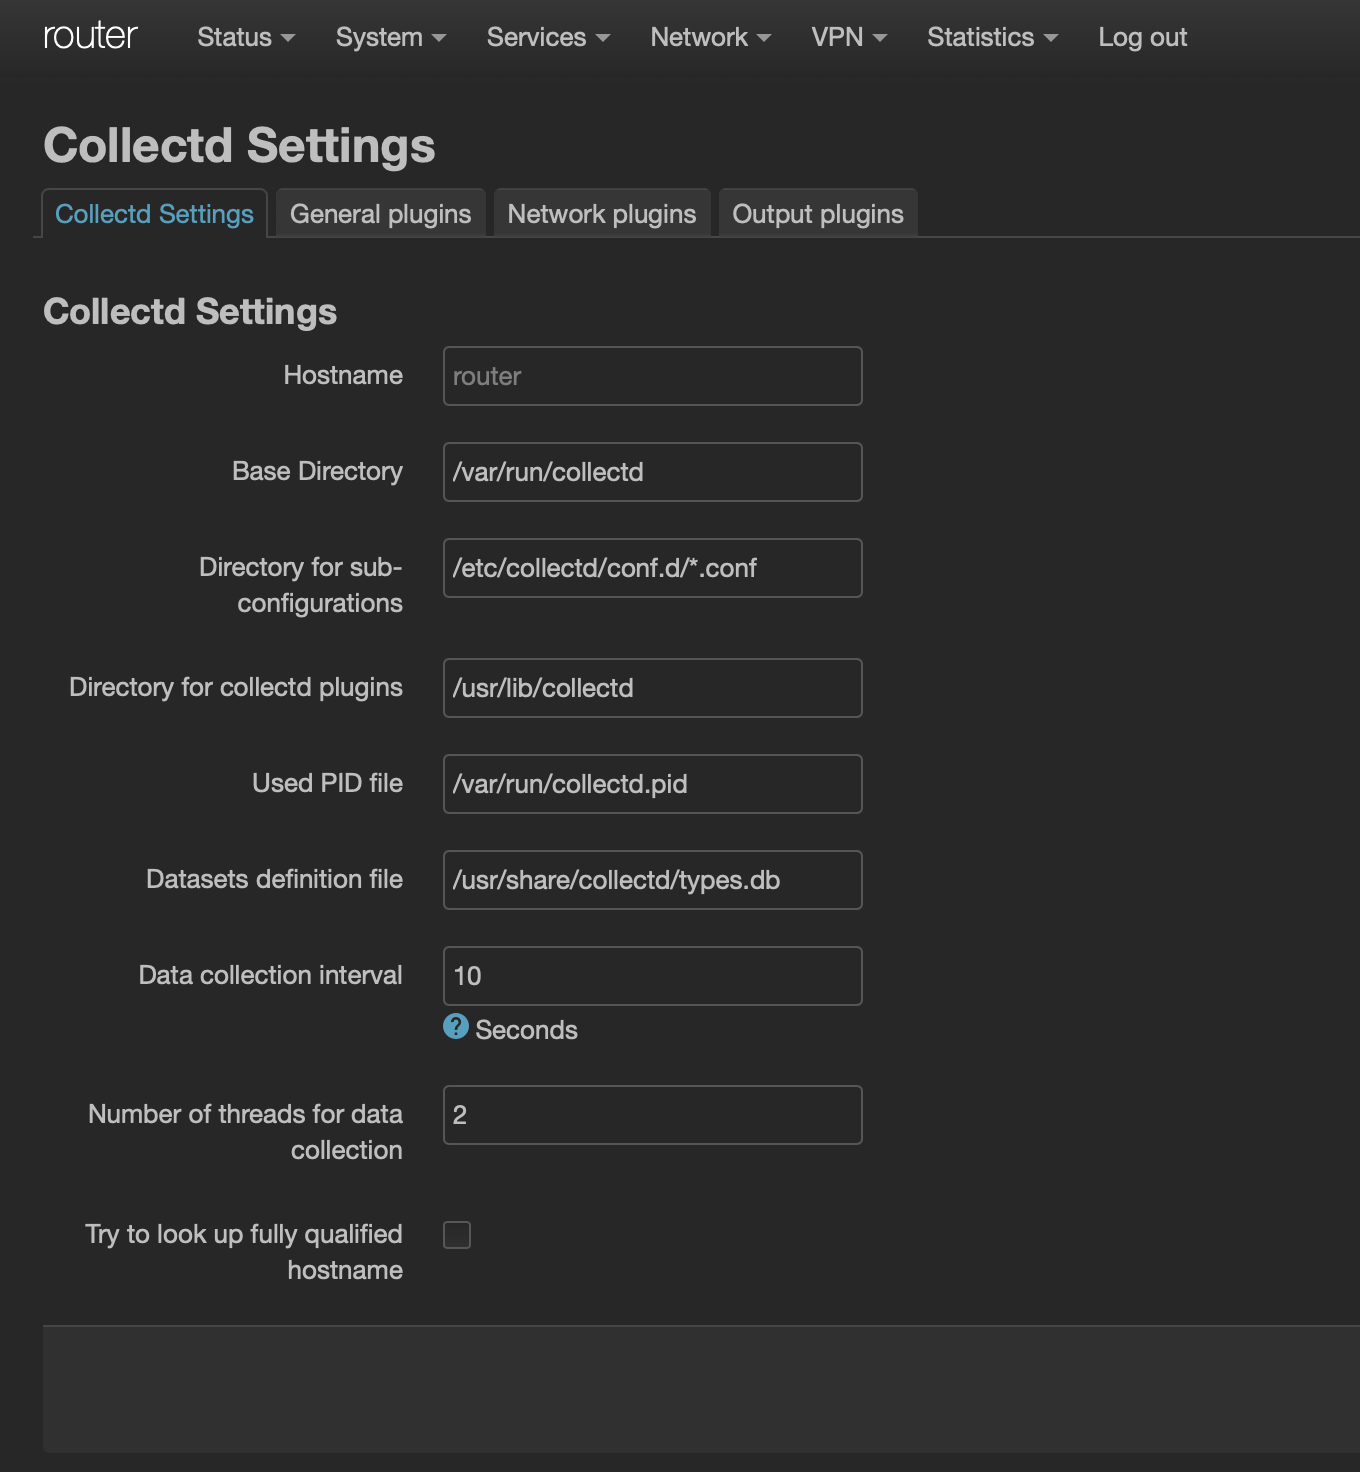
Given I can't change much on the TrueNAS side, I've tried changing things on my main OpenWRT router to accommodate the RRD files the NAS generates but am not having luck having these generate charts.
Would anyone who may have done something similar please have a glance at what I've got so far and point anything I may have missed? Perhaps the RRD files created by TrueNAS Core are non-standard, but I can't find anything online suggesting that is the case.

The contents of /usr/local/etc/collectd.conf on the NAS are as follows:
Hostname "MyCloudPR4100.ethernet.home.arpa"
BaseDir "/var/db/collectd"
PluginDir "/usr/local/lib/collectd"

LoadPlugin aggregation
LoadPlugin cpu
LoadPlugin df
LoadPlugin disk
LoadPlugin exec
LoadPlugin interface
LoadPlugin load
LoadPlugin memory
LoadPlugin processes
LoadPlugin rrdcached
LoadPlugin swap
LoadPlugin uptime
LoadPlugin syslog
LoadPlugin threshold
LoadPlugin zfs_arc
LoadPlugin nfsstat
LoadPlugin write_graphite
LoadPlugin cputemp
LoadPlugin ctl
LoadPlugin geom_stat
LoadPlugin nut
LoadPlugin python
LoadPlugin zfs_arc_v2

<Plugin "nut">
        UPS "ups@localhost:3493"
</Plugin>
<Plugin "syslog">
        LogLevel err
</Plugin>

<Plugin "aggregation">
        <Aggregation>
                Plugin "cpu"
                Type "cpu"
                GroupBy "Host"
                GroupBy "TypeInstance"
                CalculateNum false
                CalculateSum true
                CalculateAverage true
                CalculateMinimum false
                CalculateMaximum false
                CalculateStddev false
        </Aggregation>
</Plugin>
<Plugin cpu>

</Plugin>

<Plugin cputemp>
</Plugin>

<Plugin "disk">
        Disk "/^gptid/"
        Disk "/^md/"
        Disk "/^pass/"
        IgnoreSelected true
</Plugin>

<Plugin "exec">
        NotificationExec "nobody" "/usr/local/libexec/collectd_alert.py"
</Plugin>

<Plugin "interface">
        Interface "lo0"
        Interface "ipfw0"
        Interface "pflog0"
        Interface "pfsync0"
        Interface "plip0"
        Interface "/^usbus/"
        IgnoreSelected true
</Plugin>

<Plugin "rrdcached">
        DaemonAddress "unix:/var/run/rrdcached.sock"
        DataDir "/var/db/collectd/rrd"
        CreateFiles true

        RRARows 1200
        RRATimespan 3600
        RRATimespan 86400
        RRATimespan 604800
        RRATimespan 2678400
        RRATimespan 31622400
</Plugin>

<Plugin "threshold">
        <Plugin "ctl">
                Instance "ha"
                <Type "disk_octets">
                        WarningMax 10000000
                        Persist true
                        Interesting false
                </Type>
        </Plugin>
</Plugin>
# collectd 5.10 does not expect empty zfs_arc plugin block and marks it as wrong config

<Plugin "zfs_arc">
</Plugin>

<Plugin "geom_stat">
        Filter "^([a]?da|ciss|md|mfi|md|nvd|pmem|xbd|vtbd)[0123456789]+$"
</Plugin>

<Plugin "df">
        Mountpoint "/^\/boot/"
        Mountpoint "/^\/var/db/system"
        FSType "tmpfs"
        FSType "devfs"
        FSType "nullfs"
        FSType "fdescfs"
        IgnoreSelected true
        LogOnce true
</Plugin>

<Plugin python>
        ModulePath "/usr/local/lib/collectd_pyplugins"
        LogTraces true
        Interactive false
        Import "disktemp"

        <Module "disktemp">
        </Module>
</Plugin>

<Plugin "write_graphite">
</Plugin>

# Limit how much memory collectd can consume for its write queue when graphite host is down.
# Normal system has about 1500 metrics (most of them collected every 10 seconds).
# Hi-end system with 1000 drives and 1000 datasets will have about 10000 metrics.
WriteQueueLimitLow 50000
WriteQueueLimitHigh 50000