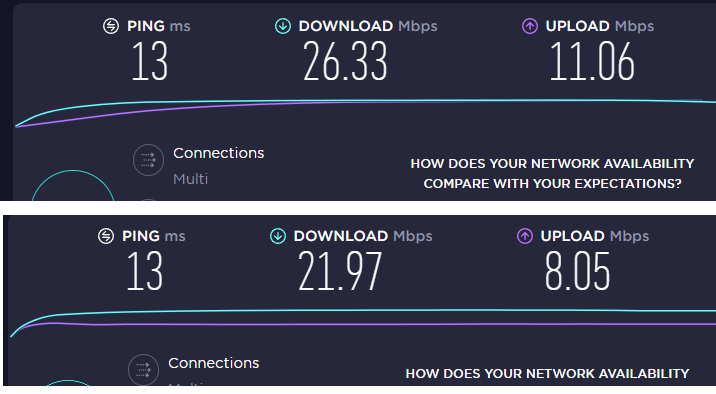
Impact of reactivating SQM QOS with params you gave (before/after):
Also note that I had 34mbps 5 hours ago, now its less than 28!
Waveform test with SQM :
and without :
So there is improvement on bufferbloat but overall speed is slower (due to processing?).
But in both cases that does not solve my issue of speed slowing down until reboot..
Thanks again!
How many client devices are currently connected?
Try changing cake and piece.of.cake to fq_codel and simplest_tbf.
Make sure you are saving and applying settings in LuCI, or doing uci commit if using the CLI.
Rerun the tests.
Do a cat /etc/config/sqm again, and post the results.
Your ISP may be using CGNAT.
With these new params :
Slower..
root@OpenWrt:~# cat /etc/config/sqm

config queue 'eth1'
        option debug_logging '0'
        option verbosity '5'
        option interface 'wan'
        option download '59000'
        option upload '9000'
        option linklayer 'ethernet'
        option overhead '18'
        option qdisc 'fq_codel'
        option script 'simplest_tbf.qos'
        option enabled '1'
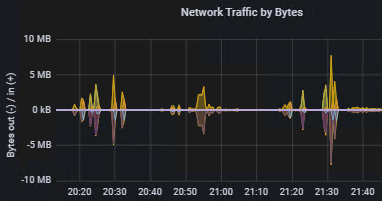
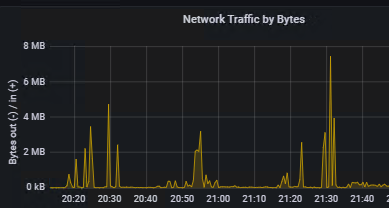
I have about 30 devices, but more than half are IOT devices with very low traffic (temperature, garage door, motion sensor) or smart plugs. The "big" devices, are 2 cellphone, 2 tablets, my desktop and laptop, then 2 work laptops. One Google Home. I can see with my grafana graphs based on prometheus that network is petty quiet except when I run the tests.
And finally, I rebooted the router, here is the result right after .
Without :
Thanks!
So try fq_codel, simplest_tbf, zero for download shaping, and 10000 for upload.
If no improvement, or worse, turn SQM off again.
Since your device subtarget is mt7621, you can take advantage of hardware NAT, which could help improve your speed.
LuCI > Network > Firewall > General Settings
In the Routing/NAT Offloading section, check Software flow offloading , which will display Hardware flow offloading .
Check that, save and apply, reboot, and test.
fwiw, have you checked LuCI > Status > Realtime graphs > Traffic to confirm no other devices are using the internet when you perform speed test?
Thanks for replies.
To Bill : Yes, it was very calm on the network between the tests I did, as you can see.
Also I did the bufferbloat test again when I woke up this morning and it was lower than last night :
With SQM 0 Download and 10000 upload :
Without :
Download speed is similar now, but upload speed is bad.
So I won't activate SQM for now as it's not my issue.
Will try software offloading later.
And continue to monitor as speed may go down by itself later today.
Me again. Network was calm before test.
And with hardware offloading :
Almost the same.
Now lets see if it drops in a couple of hours!
For now, with more than 24h of uptime, I'm not experiencing any speed issue.. Lets hope it will last!
@anon89577378
After a certain time using Hardware offloading, I started experiencing some issues with streaming, facebook etc.
Facebook conversations do not load. When I click on "see more", it just turns and turns indefinitely.
Youtube videos are buffering more than before
No issue with speed tests, I hit the max. ..
I went back to initial settings (no offloading), it fixed issues with facebook and streaming, but after one day or 2, internet speed is slowing down drastically (60mb -> 30 -> now it's around 17mb after 2 days!) A reboot will fix that...
I tried to check only Software offloading, and it seemed to fix both issues, but this morning, my RSA Token (work related) was telling "no internet" but there was no issues with internet.. And right now, I had issue loading pictures on Facebook, everything was black.
Unchecked Software offloading and no more issue loading pics.. but internet speed is back to 17mb/sec until next reboot.
Really don't know what to do. I'm about to go back to my ISP router and sell the Linksys on marketplace..
Any idea somebody ?
Let's see what your CPU and RAM look like during the "slow" period.
Install the package sysstat.
SSH in to the router.
To trace CPU usage -
pidstat -T TASK 2 (which snapshots every 2 seconds)
To log the results (name the file whatever you want) -
pidstat -T TASK 2 | tee -a CPUtrace.txt
CTRL-C to end the trace.
Log file will be in the root directory.
To trace RAM usage -
pidstat -r -p ALL 2 (which snapshots every 2 seconds)
To log the results (name the file whatever you want) -
pidstat -r -p ALL 2 | tee -a RAMtrace.txt
CTRL-C to end the trace.
Log file will be in the root directory.
Hi,
It took less than 24h to drop from 67mbps to 40.
Very clear that ksoftirqd is taking all the place.
Do you see something else wrong ?
CPUTrace :
Linux 5.4.179 (OpenWrt) 	04/08/22 	_mips_	(4 CPU)

07:10:32      UID       PID    %usr %system  %guest   %wait    %CPU   CPU  Command
07:10:34        0         5    0.00    0.49    0.00    0.00    0.49     0  kworker/0:0-events
07:10:34        0         9    0.00   39.81    0.00    0.00   39.81     0  ksoftirqd/0
07:10:34        0        10    0.00    0.49    0.00    0.00    0.49     2  rcu_sched
07:10:34        0      3149   67.96   31.07    0.00    0.00   99.03     3  prometheus-node
07:10:34      453      7684    0.97    0.97    0.00    0.00    1.94     0  dnsmasq
07:10:34        0     22219    0.97    0.97    0.00    0.00    1.94     1  pidstat

07:10:34      UID       PID    %usr %system  %guest   %wait    %CPU   CPU  Command
07:10:36        0         9    0.00   56.22    0.00    0.00   56.22     0  ksoftirqd/0
07:10:36        0        10    0.00    0.50    0.00    0.00    0.50     3  rcu_sched
07:10:36        0      3149    0.50    0.00    0.00    0.00    0.50     3  prometheus-node
07:10:36        0     22219    1.00    1.00    0.00    0.00    1.99     1  pidstat

07:10:36      UID       PID    %usr %system  %guest   %wait    %CPU   CPU  Command
07:10:38        0         9    0.00    3.00    0.00    0.00    3.00     0  ksoftirqd/0
07:10:38      453      7684    0.50    0.00    0.00    0.00    0.50     1  dnsmasq
07:10:38        0     22219    0.50    1.00    0.00    0.00    1.50     1  pidstat
07:10:38        0     22220    0.00    0.50    0.00    0.00    0.50     0  tee

07:10:38      UID       PID    %usr %system  %guest   %wait    %CPU   CPU  Command
07:10:40        0         9    0.00   20.50    0.00    0.00   20.50     0  ksoftirqd/0
07:10:40        0       776    0.00    0.50    0.00    0.00    0.50     0  urngd
07:10:40        0      1928    0.00    0.50    0.00    0.00    0.50     0  odhcpd
07:10:40      453      7684    1.00    2.00    0.00    0.00    3.00     1  dnsmasq
07:10:40        0     22219    1.50    0.50    0.00    0.00    2.00     1  pidstat

07:10:40      UID       PID    %usr %system  %guest   %wait    %CPU   CPU  Command
07:10:42        0         9    0.00    8.46    0.00    0.00    8.46     0  ksoftirqd/0
07:10:42      453      7684    0.00    0.50    0.00    0.00    0.50     1  dnsmasq
07:10:42        0     22210    0.00    0.50    0.00    0.00    0.50     2  dropbear
07:10:42        0     22219    0.50    1.49    0.00    0.00    1.99     1  pidstat

07:10:42      UID       PID    %usr %system  %guest   %wait    %CPU   CPU  Command
07:10:44        0         9    0.00    4.00    0.00    0.00    4.00     0  ksoftirqd/0
07:10:44      453      7684    0.50    0.00    0.00    0.00    0.50     1  dnsmasq
07:10:44        0     22219    1.00    0.00    0.00    0.00    1.00     1  pidstat

07:10:44      UID       PID    %usr %system  %guest   %wait    %CPU   CPU  Command
07:10:46        0         5    0.00    0.50    0.00    0.00    0.50     0  kworker/0:0-mm_percpu_wq
07:10:46        0         9    0.00   59.70    0.00    0.00   59.70     0  ksoftirqd/0
07:10:46        0      1928    0.50    0.00    0.00    0.00    0.50     1  odhcpd
07:10:46      453      7684    0.00    0.50    0.00    0.00    0.50     1  dnsmasq
07:10:46        0     22219    0.50    1.49    0.00    0.00    1.99     1  pidstat

07:10:46      UID       PID    %usr %system  %guest   %wait    %CPU   CPU  Command
07:10:48        0         9    0.00    4.00    0.00    0.00    4.00     0  ksoftirqd/0
07:10:48        0        10    0.00    0.50    0.00    0.00    0.50     0  rcu_sched
07:10:48        0      3149   43.50   12.50    0.00    0.00   56.00     3  prometheus-node
07:10:48      453      7684    0.00    0.50    0.00    0.00    0.50     1  dnsmasq
07:10:48        0     22219    1.00    1.00    0.00    0.00    2.00     1  pidstat
07:10:48        0     22220    0.00    0.50    0.00    0.00    0.50     0  tee

07:10:48      UID       PID    %usr %system  %guest   %wait    %CPU   CPU  Command
07:10:50        0         9    0.00   38.50    0.00    0.00   38.50     0  ksoftirqd/0
07:10:50        0        10    0.00    0.50    0.00    0.00    0.50     1  rcu_sched
07:10:50        0       514    0.00    0.50    0.00    0.00    0.50     2  kworker/2:2-events_power_efficient
07:10:50       81       741    0.50    0.00    0.00    0.00    0.50     2  ubusd
07:10:50        0      3149   48.00   29.00    0.00    0.00   77.00     3  prometheus-node
07:10:50      453      7684    0.50    0.50    0.00    0.00    1.00     1  dnsmasq
07:10:50        0     22219    1.00    1.00    0.00    0.00    2.00     1  pidstat

07:10:50      UID       PID    %usr %system  %guest   %wait    %CPU   CPU  Command
07:10:52        0         9    0.00  100.00    0.00    0.00  100.00     0  ksoftirqd/0
07:10:52        0        10    0.00    0.50    0.00    0.00    0.50     3  rcu_sched
07:10:52      453      7684    0.50    3.48    0.00    0.00    3.98     1  dnsmasq
07:10:52        0     22210    0.00    0.50    0.00    0.00    0.50     2  dropbear
07:10:52        0     22219    1.49    1.00    0.00    0.00    2.49     2  pidstat

07:10:52      UID       PID    %usr %system  %guest   %wait    %CPU   CPU  Command
07:10:54        0         5    0.00    0.50    0.00    0.00    0.50     0  kworker/0:0-mm_percpu_wq
07:10:54        0         9    0.00   99.50    0.00    0.00   99.50     0  ksoftirqd/0
07:10:54        0        26    0.00    0.50    0.00    0.00    0.50     3  kworker/3:0-events_power_efficient
07:10:54      453      7684    0.50    1.00    0.00    0.00    1.50     1  dnsmasq
07:10:54        0     22219    0.50    0.50    0.00    0.00    1.00     2  pidstat

07:10:54      UID       PID    %usr %system  %guest   %wait    %CPU   CPU  Command
07:10:56        0         9    0.00   99.50    0.00    0.00   99.50     0  ksoftirqd/0
07:10:56      453      7684    0.50    1.00    0.00    0.00    1.49     1  dnsmasq
07:10:56        0     22219    1.00    1.00    0.00    0.00    1.99     2  pidstat

07:10:56      UID       PID    %usr %system  %guest   %wait    %CPU   CPU  Command
07:10:58        0         9    0.00  100.00    0.00    0.00  100.00     0  ksoftirqd/0
07:10:58        0     22219    0.50    1.00    0.00    0.00    1.50     2  pidstat

07:10:58      UID       PID    %usr %system  %guest   %wait    %CPU   CPU  Command
07:11:00        0         5    0.00    0.50    0.00    0.00    0.50     0  kworker/0:0-mm_percpu_wq
07:11:00        0         9    0.00  100.00    0.00    0.00  100.00     0  ksoftirqd/0
07:11:00        0      1772    0.00    0.50    0.00    0.00    0.50     3  netifd
07:11:00        0     22219    0.50    1.00    0.00    0.00    1.50     2  pidstat

07:11:00      UID       PID    %usr %system  %guest   %wait    %CPU   CPU  Command
07:11:02        0         9    0.00  100.00    0.00    0.00  100.00     0  ksoftirqd/0
07:11:02        0        10    0.00    0.50    0.00    0.00    0.50     1  rcu_sched
07:11:02        0      1772    0.50    0.00    0.00    0.00    0.50     2  netifd
07:11:02        0      3149   29.85    6.47    0.00    0.00   36.32     3  prometheus-node
07:11:02      453      7684    0.00    0.50    0.00    0.00    0.50     1  dnsmasq
07:11:02        0     22219    0.50    1.99    0.00    0.00    2.49     2  pidstat

07:11:02      UID       PID    %usr %system  %guest   %wait    %CPU   CPU  Command
07:11:04        0         5    0.00    0.50    0.00    0.00    0.50     0  kworker/0:0-mm_percpu_wq
07:11:04        0         9    0.00   99.50    0.00    0.00   99.50     0  ksoftirqd/0
07:11:04        0        10    0.00    0.50    0.00    0.00    0.50     2  rcu_sched
07:11:04        0        29    0.00    0.50    0.00    0.00    0.50     3  kworker/u8:1-flush-ubifs_0_1
07:11:04        0      3149   36.00   12.50    0.00    0.00   48.50     3  prometheus-node
07:11:04      453      7684    0.50    1.00    0.00    0.00    1.50     1  dnsmasq
07:11:04        0     22210    0.50    0.50    0.00    0.00    1.00     1  dropbear
07:11:04        0     22219    0.00    1.50    0.00    0.00    1.50     2  pidstat
07:11:04        0     22220    0.00    0.50    0.00    0.00    0.50     2  tee

07:11:04      UID       PID    %usr %system  %guest   %wait    %CPU   CPU  Command
07:11:06        0         9    0.00   80.60    0.00    0.00   80.60     0  ksoftirqd/0
07:11:06      453      7684    0.00    0.50    0.00    0.00    0.50     1  dnsmasq
07:11:06        0     22219    0.50    1.00    0.00    0.00    1.49     2  pidstat
07:11:06        0     22220    0.50    0.00    0.00    0.00    0.50     3  tee

07:11:06      UID       PID    %usr %system  %guest   %wait    %CPU   CPU  Command
07:11:08        0         9    0.00   31.00    0.00    0.00   31.00     0  ksoftirqd/0
07:11:08        0        10    0.00    0.50    0.00    0.00    0.50     3  rcu_sched
07:11:08        0       776    0.00    0.50    0.00    0.00    0.50     1  urngd
07:11:08      453      7684    0.50    1.50    0.00    0.00    2.00     1  dnsmasq
07:11:08        0     22219    0.50    1.50    0.00    0.00    2.00     2  pidstat

07:11:08      UID       PID    %usr %system  %guest   %wait    %CPU   CPU  Command
07:11:10        0         9    0.00   15.50    0.00    0.00   15.50     0  ksoftirqd/0
07:11:10      453      7684    0.00    1.50    0.00    0.00    1.50     1  dnsmasq
07:11:10        0     22219    0.50    1.00    0.00    0.00    1.50     2  pidstat
Thanks!
RAM Trace is too big.https://drive.google.com/drive/folders/104qMM94waBAEwGI8MwnFybkWeUNfd8M-?usp=sharing
Just uploaded 2 "long" traces without any speedtests. I don't see anything wrong. I shut Prometheus down.
Indicates that the device is under heavy interrupt load.
Caused by IRQs coming in faster than the system can handle them.
They are queued for later processing by ksoftirqd.
Run...
cat /proc/interrupts
... and post the results.
Your device target is ramips/mt7621, which is a DSA device.
Even though the EA7300 has 2 CPUs, only one is being used for DSA devices in 21.02.
Hello,
After installing latest OpenWRT 21.02.01 on my WRT3200ACM I'm observing lower download speeds compared to 19.07.8.
Configuration and installed packages are identical on both versions.
Is there something that I'm missing ?
Speed difference of about 70mbps is consistent through many tests that I've made.
19.07.8:
[image]
20.02.01:
[image]
I suspect the best option is to roll back to 19.07.n, until the issue is fixed.
During a speedtest, this command gives :
           CPU0       CPU1       CPU2       CPU3
  8:   28589101   28589132   28589122   28589117  MIPS GIC Local   1  timer
  9:    1157445          0          0          0  MIPS GIC  63  IPI call
 10:          0      41179          0          0  MIPS GIC  64  IPI call
 11:          0          0     988399          0  MIPS GIC  65  IPI call
 12:          0          0          0      41810  MIPS GIC  66  IPI call
 13:     153062          0          0          0  MIPS GIC  67  IPI resched
 14:          0     633781          0          0  MIPS GIC  68  IPI resched
 15:          0          0     618748          0  MIPS GIC  69  IPI resched
 16:          0          0          0     564527  MIPS GIC  70  IPI resched
 17:          0          0          0          0  MIPS GIC  19  1e000600.gpio-bank0, 1e000600.gpio-bank1, 1e000600.gpio-bank2
 19:         12          0          0          0  MIPS GIC  33  ttyS0
 20:          0          0          0          0  MIPS GIC  29  xhci-hcd:usb1
 21:   33780702          0          0          0  MIPS GIC  10  1e100000.ethernet
 23:         23          0          0          0  MIPS GIC  11  mt7603e
 24:         18          0          0          0  MIPS GIC  31  mt7615e
 26:          0          0          0          0  1e000600.gpio  17  keys
 27:          0          0          0          0  1e000600.gpio  12  keys
ERR:          1
And after fresh reboot
           CPU0       CPU1       CPU2       CPU3
  8:      10998      11028      11038      11011  MIPS GIC Local   1  timer
  9:      19175          0          0          0  MIPS GIC  63  IPI call
 10:          0       6531          0          0  MIPS GIC  64  IPI call
 11:          0          0      18069          0  MIPS GIC  65  IPI call
 12:          0          0          0       6388  MIPS GIC  66  IPI call
 13:       3946          0          0          0  MIPS GIC  67  IPI resched
 14:          0       3963          0          0  MIPS GIC  68  IPI resched
 15:          0          0       4043          0  MIPS GIC  69  IPI resched
 16:          0          0          0       4662  MIPS GIC  70  IPI resched
 17:          0          0          0          0  MIPS GIC  19  1e000600.gpio-bank0, 1e000600.gpio-bank1, 1e000600.gpio-bank2
 19:         12          0          0          0  MIPS GIC  33  ttyS0
 20:          0          0          0          0  MIPS GIC  29  xhci-hcd:usb1
 21:      10788          0          0          0  MIPS GIC  10  1e100000.ethernet
 23:         23          0          0          0  MIPS GIC  11  mt7603e
 24:         18          0          0          0  MIPS GIC  31  mt7615e
 26:          0          0          0          0  1e000600.gpio  17  keys
 27:          0          0          0          0  1e000600.gpio  12  keys
ERR:          1
CrAsH0v3r:
EA7300
Since your router is one of those making use of MediaTek MT7621A - MT7615N combination,Development Snapshot builds a try and see if that improves the situation.
Due to bug(s),
I can do that. But when I bought the router, I installed by mistake a dev snapshot instead of the stable one and configured LUCI myself. But I don't remember which one, but I think that there were a couple other packages that were not comptatible.
I may take a look at this option after Easter because I'll be out of the country a couple a days and I dont want to make the situation worse before leaving.
For now I'll schedule a reboot every night as a temporary patch..
Hi all,
Just a little follow up on this one.. I may have found the (or one of the) guilty package.
Few weeks ago, I updated my router to the latest version, and the issue diseapered.
I did not reinstall any of my previous packages(except VPN) to keep the setup clean.
After a few weeks running without issue, last week I wanted to limit bandwidth for a specific device, so after reading, I installed NFT-QOS (which was installed before but unused).
I was unabled to get it to work properly.. So I unchecked the "active" box in Lucy and I left it like that.
Two days later, my Internet speed was veeeeery slow, on all devices. As I knew that the only difference was the NFT-QOS "inactive" package, I decided to completely remove it.
I'm now on the sixth day without reboot with no issue at all.
So lesson learned, I'll go one package at a time and wait a couple of days to see if there are issues!
Thanks all for help !
system
June 10, 2022, 2:14pm
27
This topic was automatically closed 10 days after the last reply. New replies are no longer allowed.