Hi all,
Running 21.02.2 on a EA7300 since 2 weeks.
Everything is now inactivated except Unbound and OpenVPN.
Looking at logs (system and Kernel), I don't see anything wrong. Memory and CPU are fine.
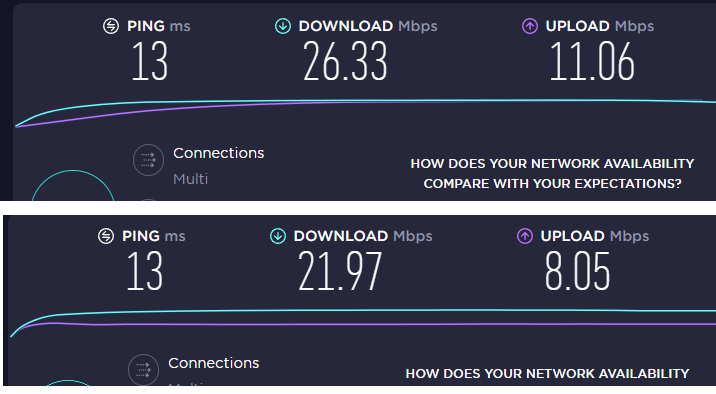
But after less than a day since reboot, my internet speed (speedtest.net ) is already slower. After reboot, I get 66-68mbps, but right now I'm having about 35mbps. During last week-end, I dropped to 16mbps before a reboot.
Any idea of what I can look at? Or other tests I can run?
Thanks for any help .. I could reboot everynight but would like to find the cause! I chose OpenWRT due to it's reliabilty.. so I hope to find!
What is your advertised download/upload speed? (what you're paying for)
Is the Linksys connected to an ISP device? (Double NAT can cause speed issues).
SSH in to the router and run the following -
cat /etc/config/sqm
Post the results in preformatted text, by using the icon highlighted in red...
Hi,
I'm supposed to get 60mbit/s download and 10mbits/s upload. With ISP router, I usually get 66-68/11 mbits/sec.
The ISP router is in bridge mode so no double NAT.
And as requested :
config queue 'eth1'
        option qdisc 'cake'
        option script 'piece_of_cake.qos'
        option linklayer 'none'
        option debug_logging '0'
        option verbosity '5'
        option download '700000'
        option upload '100000'
        option interface 'wan'
        option enabled '0'

config queue
Thanks for quick reply.
Just to confirm, DHCP, wireless, and the firewall are turned off on the ISP device.
option download '700000'
option upload '100000'
The numbers for download and upload you have translate to 700 Mbps and 100 Mbps...too many zeroes.
For a 60/10 connection, start with download at 59000 and upload at 9000.
Set Link Layer Adaption to "Ethernet" and Per Packet Overhead to 18.
Run a speed and bufferbloat test on Waveform...
Hi,
Q1 : Yes, everything is Off on this device. Only way to reach it is if the laptop is directly linked to it by wire.
I agree for the wrong values here, It was the last test I did saturday. But you can also notice that Enable =0, so it should not cause anywhing.
But I'll do the test you suggest and come back with results.
Thanks!
slh
March 9, 2022, 1:12am
6
Depending on your configuration, that (especially the later) might be a rather big 'except'…
It is the opposite.
1 Like
Impact of reactivating SQM QOS with params you gave (before/after):
Also note that I had 34mbps 5 hours ago, now its less than 28!
Waveform test with SQM :
and without :
So there is improvement on bufferbloat but overall speed is slower (due to processing?).
But in both cases that does not solve my issue of speed slowing down until reboot..
Thanks again!
How many client devices are currently connected?
Try changing cake and piece.of.cake to fq_codel and simplest_tbf.
Make sure you are saving and applying settings in LuCI, or doing uci commit if using the CLI.
Rerun the tests.
Do a cat /etc/config/sqm again, and post the results.
Your ISP may be using CGNAT.
With these new params :
Slower..
root@OpenWrt:~# cat /etc/config/sqm

config queue 'eth1'
        option debug_logging '0'
        option verbosity '5'
        option interface 'wan'
        option download '59000'
        option upload '9000'
        option linklayer 'ethernet'
        option overhead '18'
        option qdisc 'fq_codel'
        option script 'simplest_tbf.qos'
        option enabled '1'
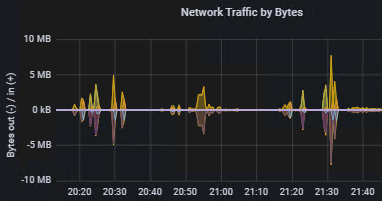
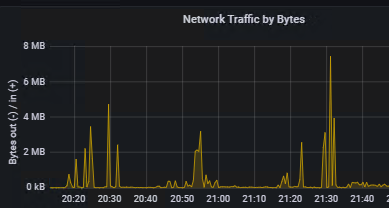
I have about 30 devices, but more than half are IOT devices with very low traffic (temperature, garage door, motion sensor) or smart plugs. The "big" devices, are 2 cellphone, 2 tablets, my desktop and laptop, then 2 work laptops. One Google Home. I can see with my grafana graphs based on prometheus that network is petty quiet except when I run the tests.
And finally, I rebooted the router, here is the result right after .
Without :
Thanks!
So try fq_codel, simplest_tbf, zero for download shaping, and 10000 for upload.
If no improvement, or worse, turn SQM off again.
Since your device subtarget is mt7621, you can take advantage of hardware NAT, which could help improve your speed.
LuCI > Network > Firewall > General Settings
In the Routing/NAT Offloading section, check Software flow offloading , which will display Hardware flow offloading .
Check that, save and apply, reboot, and test.
fwiw, have you checked LuCI > Status > Realtime graphs > Traffic to confirm no other devices are using the internet when you perform speed test?
Thanks for replies.
To Bill : Yes, it was very calm on the network between the tests I did, as you can see.
Also I did the bufferbloat test again when I woke up this morning and it was lower than last night :
With SQM 0 Download and 10000 upload :
Without :
Download speed is similar now, but upload speed is bad.
So I won't activate SQM for now as it's not my issue.
Will try software offloading later.
And continue to monitor as speed may go down by itself later today.
Me again. Network was calm before test.
And with hardware offloading :
Almost the same.
Now lets see if it drops in a couple of hours!
For now, with more than 24h of uptime, I'm not experiencing any speed issue.. Lets hope it will last!
@anon89577378
After a certain time using Hardware offloading, I started experiencing some issues with streaming, facebook etc.
Facebook conversations do not load. When I click on "see more", it just turns and turns indefinitely.
Youtube videos are buffering more than before
No issue with speed tests, I hit the max. ..
I went back to initial settings (no offloading), it fixed issues with facebook and streaming, but after one day or 2, internet speed is slowing down drastically (60mb -> 30 -> now it's around 17mb after 2 days!) A reboot will fix that...
I tried to check only Software offloading, and it seemed to fix both issues, but this morning, my RSA Token (work related) was telling "no internet" but there was no issues with internet.. And right now, I had issue loading pictures on Facebook, everything was black.
Unchecked Software offloading and no more issue loading pics.. but internet speed is back to 17mb/sec until next reboot.
Really don't know what to do. I'm about to go back to my ISP router and sell the Linksys on marketplace..
Any idea somebody ?
Let's see what your CPU and RAM look like during the "slow" period.
Install the package sysstat.
SSH in to the router.
To trace CPU usage -
pidstat -T TASK 2 (which snapshots every 2 seconds)
To log the results (name the file whatever you want) -
pidstat -T TASK 2 | tee -a CPUtrace.txt
CTRL-C to end the trace.
Log file will be in the root directory.
To trace RAM usage -
pidstat -r -p ALL 2 (which snapshots every 2 seconds)
To log the results (name the file whatever you want) -
pidstat -r -p ALL 2 | tee -a RAMtrace.txt
CTRL-C to end the trace.
Log file will be in the root directory.
Hi,
It took less than 24h to drop from 67mbps to 40.
Very clear that ksoftirqd is taking all the place.
Do you see something else wrong ?
CPUTrace :
Linux 5.4.179 (OpenWrt) 	04/08/22 	_mips_	(4 CPU)

07:10:32      UID       PID    %usr %system  %guest   %wait    %CPU   CPU  Command
07:10:34        0         5    0.00    0.49    0.00    0.00    0.49     0  kworker/0:0-events
07:10:34        0         9    0.00   39.81    0.00    0.00   39.81     0  ksoftirqd/0
07:10:34        0        10    0.00    0.49    0.00    0.00    0.49     2  rcu_sched
07:10:34        0      3149   67.96   31.07    0.00    0.00   99.03     3  prometheus-node
07:10:34      453      7684    0.97    0.97    0.00    0.00    1.94     0  dnsmasq
07:10:34        0     22219    0.97    0.97    0.00    0.00    1.94     1  pidstat

07:10:34      UID       PID    %usr %system  %guest   %wait    %CPU   CPU  Command
07:10:36        0         9    0.00   56.22    0.00    0.00   56.22     0  ksoftirqd/0
07:10:36        0        10    0.00    0.50    0.00    0.00    0.50     3  rcu_sched
07:10:36        0      3149    0.50    0.00    0.00    0.00    0.50     3  prometheus-node
07:10:36        0     22219    1.00    1.00    0.00    0.00    1.99     1  pidstat

07:10:36      UID       PID    %usr %system  %guest   %wait    %CPU   CPU  Command
07:10:38        0         9    0.00    3.00    0.00    0.00    3.00     0  ksoftirqd/0
07:10:38      453      7684    0.50    0.00    0.00    0.00    0.50     1  dnsmasq
07:10:38        0     22219    0.50    1.00    0.00    0.00    1.50     1  pidstat
07:10:38        0     22220    0.00    0.50    0.00    0.00    0.50     0  tee

07:10:38      UID       PID    %usr %system  %guest   %wait    %CPU   CPU  Command
07:10:40        0         9    0.00   20.50    0.00    0.00   20.50     0  ksoftirqd/0
07:10:40        0       776    0.00    0.50    0.00    0.00    0.50     0  urngd
07:10:40        0      1928    0.00    0.50    0.00    0.00    0.50     0  odhcpd
07:10:40      453      7684    1.00    2.00    0.00    0.00    3.00     1  dnsmasq
07:10:40        0     22219    1.50    0.50    0.00    0.00    2.00     1  pidstat

07:10:40      UID       PID    %usr %system  %guest   %wait    %CPU   CPU  Command
07:10:42        0         9    0.00    8.46    0.00    0.00    8.46     0  ksoftirqd/0
07:10:42      453      7684    0.00    0.50    0.00    0.00    0.50     1  dnsmasq
07:10:42        0     22210    0.00    0.50    0.00    0.00    0.50     2  dropbear
07:10:42        0     22219    0.50    1.49    0.00    0.00    1.99     1  pidstat

07:10:42      UID       PID    %usr %system  %guest   %wait    %CPU   CPU  Command
07:10:44        0         9    0.00    4.00    0.00    0.00    4.00     0  ksoftirqd/0
07:10:44      453      7684    0.50    0.00    0.00    0.00    0.50     1  dnsmasq
07:10:44        0     22219    1.00    0.00    0.00    0.00    1.00     1  pidstat

07:10:44      UID       PID    %usr %system  %guest   %wait    %CPU   CPU  Command
07:10:46        0         5    0.00    0.50    0.00    0.00    0.50     0  kworker/0:0-mm_percpu_wq
07:10:46        0         9    0.00   59.70    0.00    0.00   59.70     0  ksoftirqd/0
07:10:46        0      1928    0.50    0.00    0.00    0.00    0.50     1  odhcpd
07:10:46      453      7684    0.00    0.50    0.00    0.00    0.50     1  dnsmasq
07:10:46        0     22219    0.50    1.49    0.00    0.00    1.99     1  pidstat

07:10:46      UID       PID    %usr %system  %guest   %wait    %CPU   CPU  Command
07:10:48        0         9    0.00    4.00    0.00    0.00    4.00     0  ksoftirqd/0
07:10:48        0        10    0.00    0.50    0.00    0.00    0.50     0  rcu_sched
07:10:48        0      3149   43.50   12.50    0.00    0.00   56.00     3  prometheus-node
07:10:48      453      7684    0.00    0.50    0.00    0.00    0.50     1  dnsmasq
07:10:48        0     22219    1.00    1.00    0.00    0.00    2.00     1  pidstat
07:10:48        0     22220    0.00    0.50    0.00    0.00    0.50     0  tee

07:10:48      UID       PID    %usr %system  %guest   %wait    %CPU   CPU  Command
07:10:50        0         9    0.00   38.50    0.00    0.00   38.50     0  ksoftirqd/0
07:10:50        0        10    0.00    0.50    0.00    0.00    0.50     1  rcu_sched
07:10:50        0       514    0.00    0.50    0.00    0.00    0.50     2  kworker/2:2-events_power_efficient
07:10:50       81       741    0.50    0.00    0.00    0.00    0.50     2  ubusd
07:10:50        0      3149   48.00   29.00    0.00    0.00   77.00     3  prometheus-node
07:10:50      453      7684    0.50    0.50    0.00    0.00    1.00     1  dnsmasq
07:10:50        0     22219    1.00    1.00    0.00    0.00    2.00     1  pidstat

07:10:50      UID       PID    %usr %system  %guest   %wait    %CPU   CPU  Command
07:10:52        0         9    0.00  100.00    0.00    0.00  100.00     0  ksoftirqd/0
07:10:52        0        10    0.00    0.50    0.00    0.00    0.50     3  rcu_sched
07:10:52      453      7684    0.50    3.48    0.00    0.00    3.98     1  dnsmasq
07:10:52        0     22210    0.00    0.50    0.00    0.00    0.50     2  dropbear
07:10:52        0     22219    1.49    1.00    0.00    0.00    2.49     2  pidstat

07:10:52      UID       PID    %usr %system  %guest   %wait    %CPU   CPU  Command
07:10:54        0         5    0.00    0.50    0.00    0.00    0.50     0  kworker/0:0-mm_percpu_wq
07:10:54        0         9    0.00   99.50    0.00    0.00   99.50     0  ksoftirqd/0
07:10:54        0        26    0.00    0.50    0.00    0.00    0.50     3  kworker/3:0-events_power_efficient
07:10:54      453      7684    0.50    1.00    0.00    0.00    1.50     1  dnsmasq
07:10:54        0     22219    0.50    0.50    0.00    0.00    1.00     2  pidstat

07:10:54      UID       PID    %usr %system  %guest   %wait    %CPU   CPU  Command
07:10:56        0         9    0.00   99.50    0.00    0.00   99.50     0  ksoftirqd/0
07:10:56      453      7684    0.50    1.00    0.00    0.00    1.49     1  dnsmasq
07:10:56        0     22219    1.00    1.00    0.00    0.00    1.99     2  pidstat

07:10:56      UID       PID    %usr %system  %guest   %wait    %CPU   CPU  Command
07:10:58        0         9    0.00  100.00    0.00    0.00  100.00     0  ksoftirqd/0
07:10:58        0     22219    0.50    1.00    0.00    0.00    1.50     2  pidstat

07:10:58      UID       PID    %usr %system  %guest   %wait    %CPU   CPU  Command
07:11:00        0         5    0.00    0.50    0.00    0.00    0.50     0  kworker/0:0-mm_percpu_wq
07:11:00        0         9    0.00  100.00    0.00    0.00  100.00     0  ksoftirqd/0
07:11:00        0      1772    0.00    0.50    0.00    0.00    0.50     3  netifd
07:11:00        0     22219    0.50    1.00    0.00    0.00    1.50     2  pidstat

07:11:00      UID       PID    %usr %system  %guest   %wait    %CPU   CPU  Command
07:11:02        0         9    0.00  100.00    0.00    0.00  100.00     0  ksoftirqd/0
07:11:02        0        10    0.00    0.50    0.00    0.00    0.50     1  rcu_sched
07:11:02        0      1772    0.50    0.00    0.00    0.00    0.50     2  netifd
07:11:02        0      3149   29.85    6.47    0.00    0.00   36.32     3  prometheus-node
07:11:02      453      7684    0.00    0.50    0.00    0.00    0.50     1  dnsmasq
07:11:02        0     22219    0.50    1.99    0.00    0.00    2.49     2  pidstat

07:11:02      UID       PID    %usr %system  %guest   %wait    %CPU   CPU  Command
07:11:04        0         5    0.00    0.50    0.00    0.00    0.50     0  kworker/0:0-mm_percpu_wq
07:11:04        0         9    0.00   99.50    0.00    0.00   99.50     0  ksoftirqd/0
07:11:04        0        10    0.00    0.50    0.00    0.00    0.50     2  rcu_sched
07:11:04        0        29    0.00    0.50    0.00    0.00    0.50     3  kworker/u8:1-flush-ubifs_0_1
07:11:04        0      3149   36.00   12.50    0.00    0.00   48.50     3  prometheus-node
07:11:04      453      7684    0.50    1.00    0.00    0.00    1.50     1  dnsmasq
07:11:04        0     22210    0.50    0.50    0.00    0.00    1.00     1  dropbear
07:11:04        0     22219    0.00    1.50    0.00    0.00    1.50     2  pidstat
07:11:04        0     22220    0.00    0.50    0.00    0.00    0.50     2  tee

07:11:04      UID       PID    %usr %system  %guest   %wait    %CPU   CPU  Command
07:11:06        0         9    0.00   80.60    0.00    0.00   80.60     0  ksoftirqd/0
07:11:06      453      7684    0.00    0.50    0.00    0.00    0.50     1  dnsmasq
07:11:06        0     22219    0.50    1.00    0.00    0.00    1.49     2  pidstat
07:11:06        0     22220    0.50    0.00    0.00    0.00    0.50     3  tee

07:11:06      UID       PID    %usr %system  %guest   %wait    %CPU   CPU  Command
07:11:08        0         9    0.00   31.00    0.00    0.00   31.00     0  ksoftirqd/0
07:11:08        0        10    0.00    0.50    0.00    0.00    0.50     3  rcu_sched
07:11:08        0       776    0.00    0.50    0.00    0.00    0.50     1  urngd
07:11:08      453      7684    0.50    1.50    0.00    0.00    2.00     1  dnsmasq
07:11:08        0     22219    0.50    1.50    0.00    0.00    2.00     2  pidstat

07:11:08      UID       PID    %usr %system  %guest   %wait    %CPU   CPU  Command
07:11:10        0         9    0.00   15.50    0.00    0.00   15.50     0  ksoftirqd/0
07:11:10      453      7684    0.00    1.50    0.00    0.00    1.50     1  dnsmasq
07:11:10        0     22219    0.50    1.00    0.00    0.00    1.50     2  pidstat
Thanks!
RAM Trace is too big.https://drive.google.com/drive/folders/104qMM94waBAEwGI8MwnFybkWeUNfd8M-?usp=sharing
Just uploaded 2 "long" traces without any speedtests. I don't see anything wrong. I shut Prometheus down.