iptmon sounds interesting but it seems I am too a neebie to understand everything.
I have OpenWRT 19.07.7
How can I check that:
iptmon depends on dnsmasq version >=2.80-16, which merged a PR to enable script-arp so make sure your dnsmasq package is up-to-date.
If you are using luci-app-statistics prior to git commit 4778aa6 you will need to upgrade as this commit merged a PR to fix the ip6tables firewall statistics view in LuCI.
dnsmasq -v gives me 2.80 but not much details more for example
Hi @darrepac, this was an issue about a year ago. I submitted a patch to the dnsmasq package that has since been merged, so you should be fine.
To get the full installed version of any package, you can run opkg info dnsmasq | grep Version. This info is also available through the web UI under "System -> Software".
Is there a step-by-step, very detailed tutorial that teaches you how to build this monitoring panel using Grafana?
I am self-taught in Linux, I know some things and I always like to learn ... I can upload a Linux (I really like Debian) on a virtual or real machine here at home or even in the cloud (AWS free tier lol) and study it even more ...
By the way, I will install the ipk on my router to test ...
I use nlbwmonitor, but I constantly observe the corruption of the data file - I don't know if this is related to the fact of uses extroot, I believe not, I have already tested my pendrive and no problem was found on it.
Hi @topsbr, there is no tutorial but you can simply download it from the Grafana site and import it in to your Grafana installation by entering the dashboard ID. You can then customize it as you wish.
Thanks so much for building this. I'm trying to understand the impact of running statistic gathering on my router. I have a Influx and Grafana installation on the LAN, so I'd like to push as much of the processing and memory usage to that PC instead of putting the burden on my router.
[edit] In terms of dependencies for iptmon, can I install collectd instead of installing luci-app-statistics? The thing that would be lost by only installing collectd without luci-app-statistics is the UI configuration right for collectd right? I'd have to manually configure collectd?
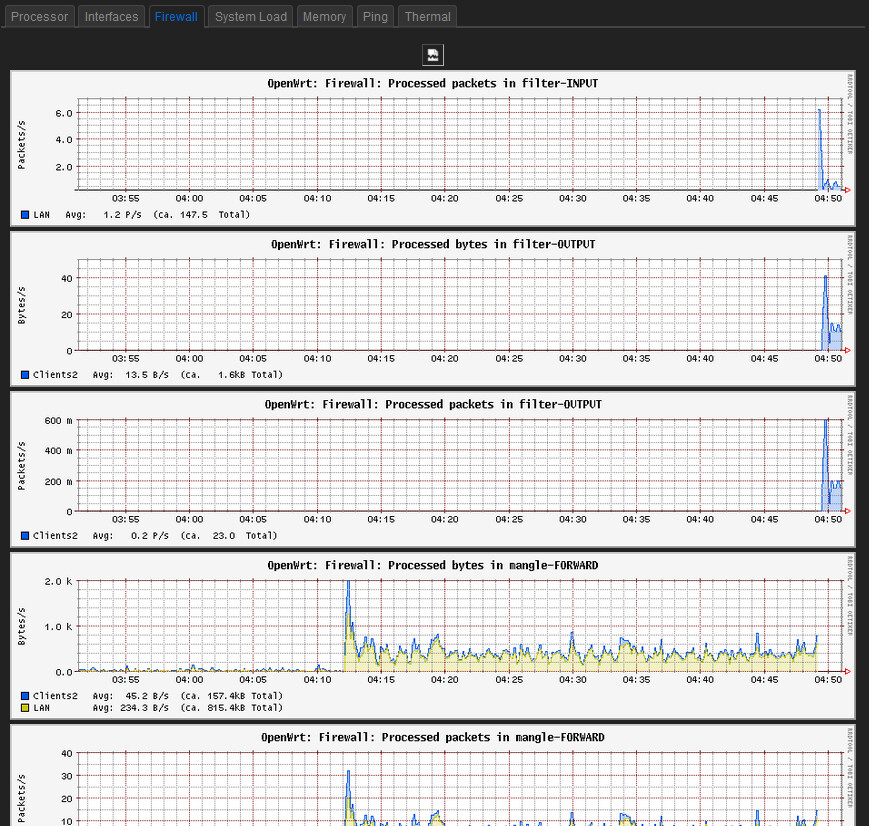
Kind of a followup to the previous question. With luci-app-statistics and Iptmon installed, how do I view bandwidth of specific host devices? It is suppose to show up on the LuCI UI's staistics menu? If someone could post a screen shot, that'd be really helpful. I don't know if the install did not go OK and I'm not seeing what I'm suppose to, or if the host data is available a different view than the statistics menu.
Yes, it's the Statistics menu. Yes, pretty sure you need luci-app-statistics (which installs collectd).
Of course, you have to use the script to install the .ipk as shown on the github page or nothing is going to be happening.
.
You also may or may not need to do this:
I no longer use iptmon, so that's all I can tell you.
Oh, I think you just identified the issue I was having. I installed iptmon by doing this:
opkg install ./iptmon_0.1.6-1_all.ipk
But you're saying you need to use a script to install it? I didn't see any scripts in the github project. Sorry, I'm new to OpenWRT and I've only installed things via opkg. Can tell me which script?
Yes, it's at the bottom of the page, but now that I look at it again it's not much of a script: it's doing what you did, just in more generalized form (you apparently just downloaded the ipk manually).
If you're not seeing data, I suspect that it's because of needing to do what's mentioned in the link in my previous post.
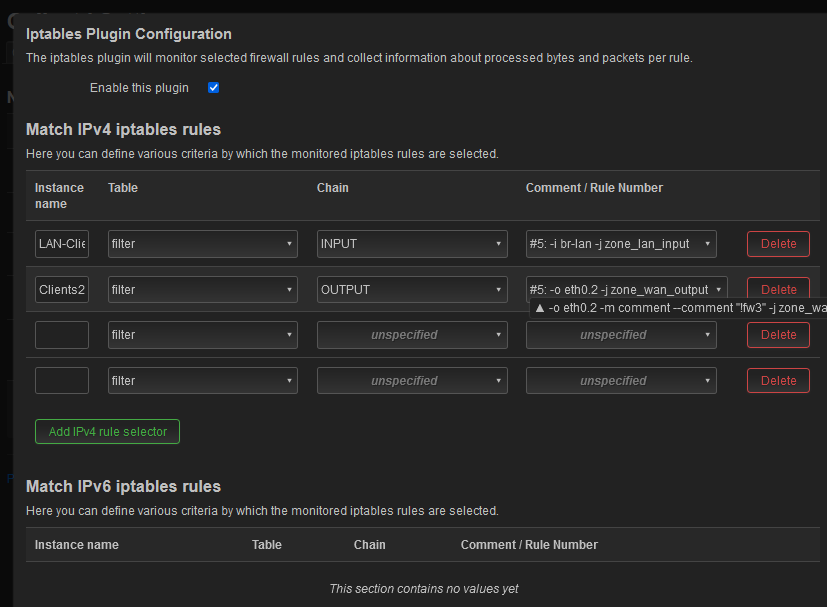
It looks like the problem was that I didn't know that the "firewall" network plugin is the iptables collectd component I was looking for. When I enabled it and blindly add something in there, I can now see data. But it's not per-host data I was after. The configuration of the iptables isn't very intuitive. There's table, chain, and comment...I'm not really sure what set of selections would provide the per-host data I want collectd to collect.