I'm trying to get a better idea of performance across my network using iPerf3 but don't understand why I'm getting significantly different results for the same test. I wonder if anyone could enlighten me or suggest a way to identify the issue (if there is one).
My OpenWrt solution is running on a D-Link DIR 2660 with multiple VLANs configured. My main VLAN (VLAN10) is the HOME network (192.168.1.0/24). The main OpenWrt interface for management is at 192.168.1.1.
If I run iPerf3 between my main PC (192.168.1.11) and a Rpi4 running iPerf3 on the same unmanaged switch I get 936Mbits/sec and the result is fairly consistent. When I connect that unmanaged switch to VLAN10 on OpenWrt and run the test again but iPerf3 server on OpenWrt I primarily get one of two results......either approx. 710Mbits/sec or 550Mbits/sec and again these two results are fairly consistent.
I realize the result will be slower than just running it on an unmanaged switch but what I don't get is why on one test I get 710Mbits/sec and then on the next test I get 550Mbits/sec.....the figures are always generally the same.
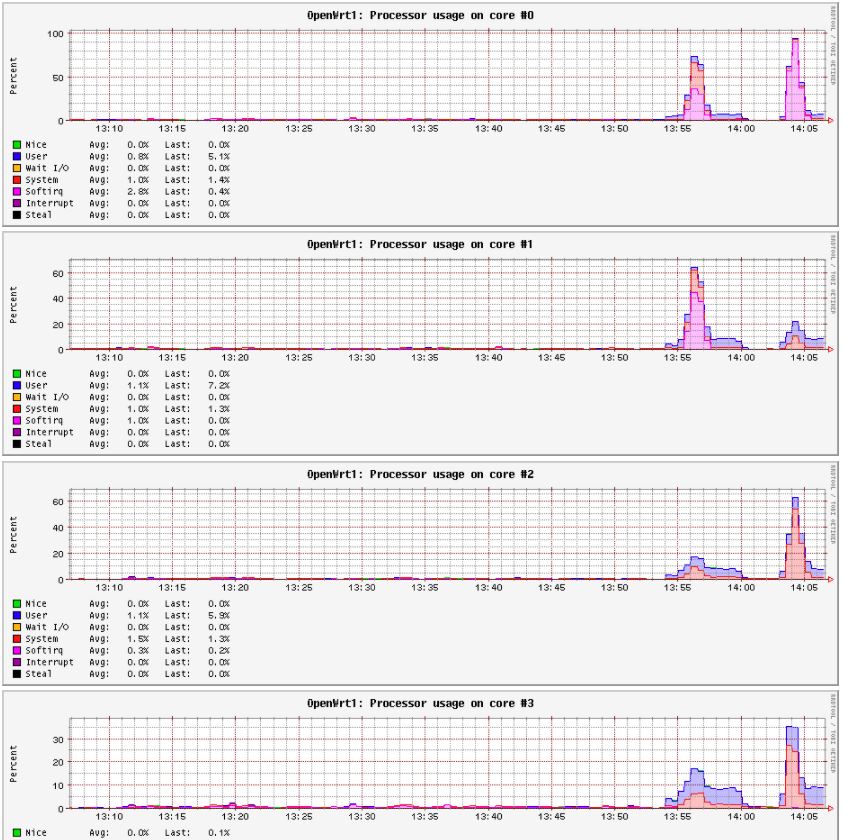
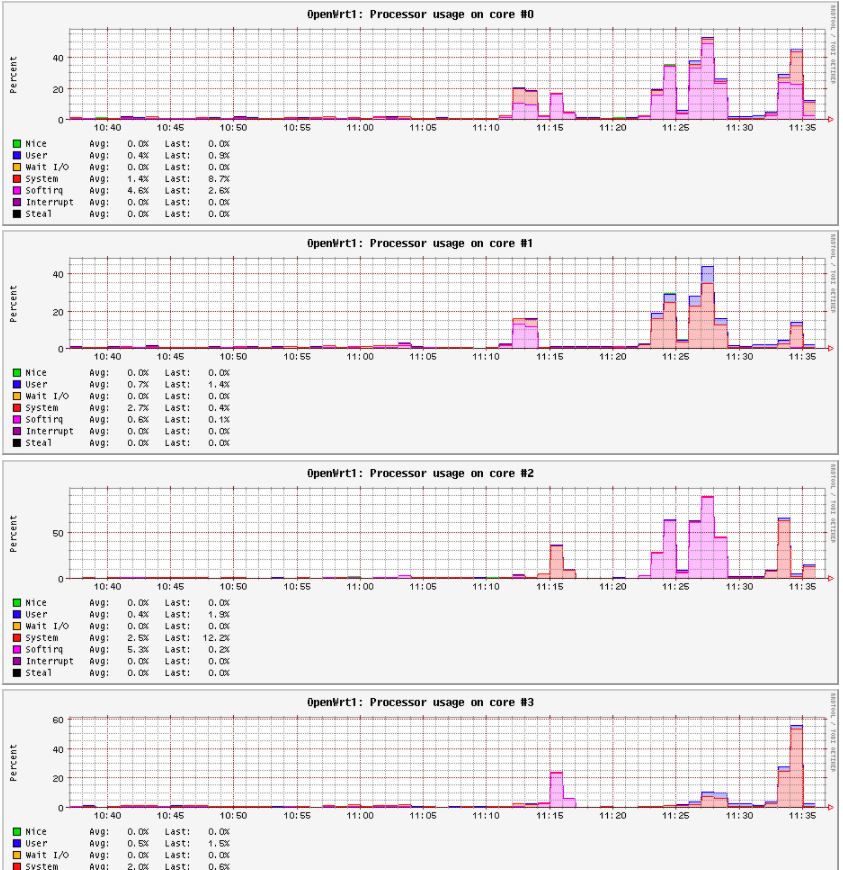
My first though was maybe it's to do with cpu utilisaton when I run the test or system load but I've configured "collectd" and the system is basically doing nothing when I run the tests (I've posted a screenshot which shows normal state and also when I have run iPerf3)
main PC = Windows10
iPerf3 command = iperf3.exe -c 192.168.1.1 -t 60s -i1s
Are these two iPerf3 runs? And was the first one ~710 and the second around 550?
On the first rund software interrupt processing (SIRQ) shows up as moderate load on core #0 and #1, on te second run it seems appear exclusively on #0 but at much higher magnitude (getting this core close to maxing out). collectd by default samples every 60 seconds, so running your tests for 120 seconds or longer should get easier to interpret results in the graphs.
Odd, my hypothesis was that if the SIRQ load maxes out one CPU you would see the slower throughput, but that does not match your second example, even though it is clear that the SIRQ load on #0 is very high in the first test.
I'm starting to think this is Windows issue causing the variance but no idea why? I've run the same tests after booting Linux and don't appear to get the two variances like I see on Windows or least I haven't seen it yet. I tried an old W7 machine and it does the same thing as W10.
Hmmm... good that you're trying different machines on the other end.
Check the usage on the Windows machines too. Ive had issues with a 4 core i5 laptop running out of CPU, doing a speedtest on a 1Gb connection. Wasnt expecting that, and am still figuring it out.
In earlier days wasnt able to get full speed on a 300Mb link, turned out that PC couldn't make that on its 1Gb eth card for some reason.
Sometimes theres hidden bottlenecks confounding tests.
It's not the CPU on the Windows machine....it's running at approx. 6% when I do the test, it's a 4 core i7 (3.10Ghz) machine.
This is interesting though.....I did the same test from Ubuntu running in WSL and got better results and no inconsistencies such as those exhibited on W10.CPU on machine at about 10% when using Ubuntu.
One thing you can try to help find the source of the issue is to use udp (-u) , and either set a target bit rate (-b 950M) or as fast is it can go (-b 0). Then run the same test but in reverse (-R).
iperf3.exe -c 192.168.1.1 -t 60 -i 1 -u -b 0 -R
I've found that some devices have transmit bottlenecks for whatever reason, and that slows down the response packets on the tcp test, which can reduce the bandwidth. If iperf3 is running on the router itself you will see drastic differences depending on which direction you test. The router cpu will max out trying to generate packets and send them.
Thanks for the suggestion. I ran the tests as follows:
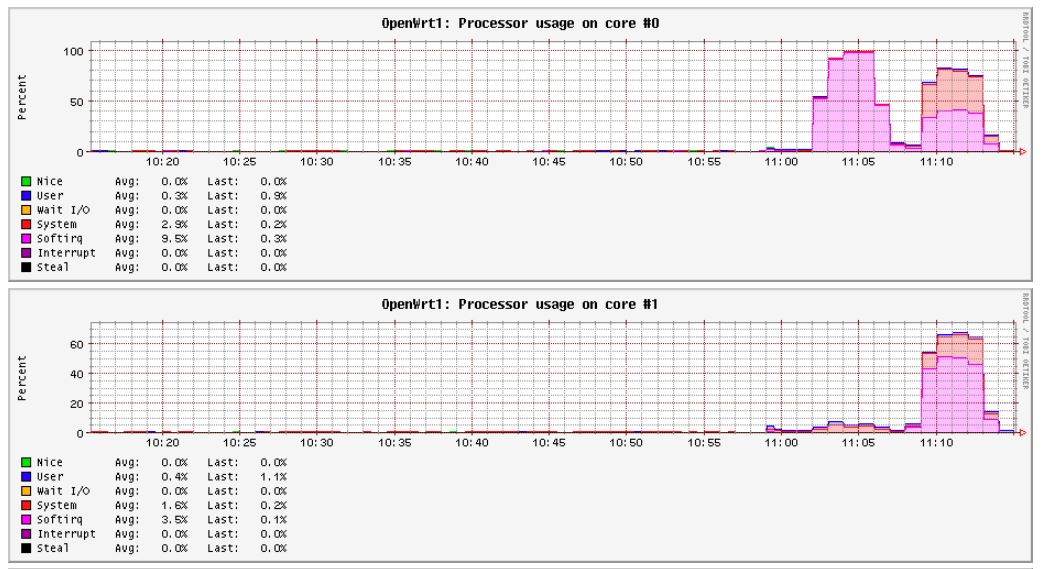
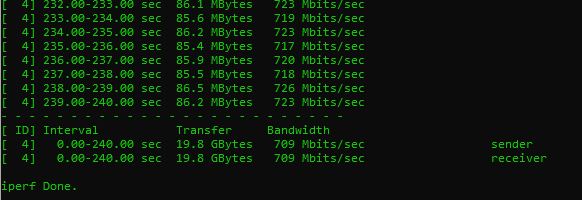
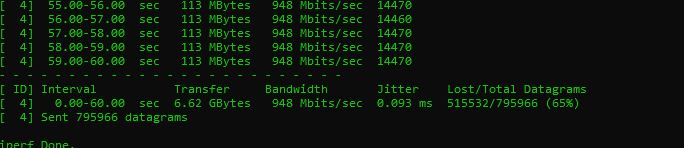
First straight from my PC to the iPerf server running on OpenWrt (iperf3.exe -c 192.168.1.1 -t 130s -i1s -u -b 0) and the bandwidth result was 948Mbits/sec. I ran the tests for 130s so you could see the info on the cpu info on the graphs.
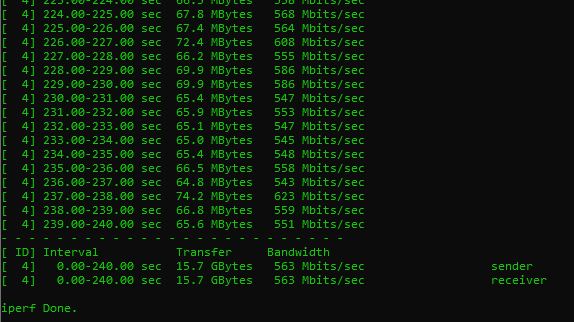
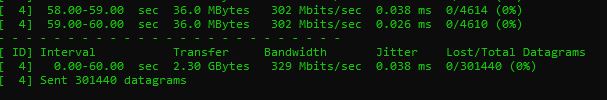
I then ran the test again but with -R (iperf3.exe -c 192.168.1.1 -t 130s -i1s -u -b 0 -R) and the bandwidth result was 348Mbits/sec. These results seem fairly consistent when repeated.
The CPU on OpenWrt doesn't appear to be maxing out and seems approx 55% for both tests (see graph). One thing I did notice though in the results is that the test WITHOUT -R was showing a 60-70% packet loss whereas the test WITH -R showed not packet loss. This was also consistent.
So clearly there's some kind of bottleneck on the router. The udp test showed that the router could only send/recieve ~330Mbps. (which is 35% of the 948Mbps sent)
I would first try to eliminate the unmanaged switch from the equation and see what you get plugged directly into the port.
Regardless of setup though, first make sure you have no VLAN tagged egress from that router port. In other words, make sure all VLANS are NOT a port member, except your untagged VLAN 10 (or whatever ID you assigned for that LAN subnet).
You never really know how an unmanaged switch will handle tagged traffic...
Previously when I realised that the problem was Windows based I sort of settled with the fact that I would just use Linux for all my benchmark testing. Consequently I have actually changed my network a little and my PC is actually plugged into a managed switch with a trunk port back to OpenWrt. So the OpenWrt router port is actually tagging all VLANs back to my managed switch.
Notwithstanding any of those topology changes the fact is that Windows regardless of topology doesn't give consistent performance results (for TCP at least).......either reporting approx. 720Mbits or approx. 550Mbits
I will plug my PC directly into port2 which is VLAN20 and not tagged with any other VLANs and repeat the test.
Just an update.....I ran 4 new tests with my PC plugged directly into port 2 (192.168.2.0/24) of the OpenWrt router. This port is untagged for VLAN20 so no trunking or other switches involved. It basically produced exactly the same results as before. TCP test will run with result of 728Mbits/sec and then 30 seconds later run with 570Mbits/sec and so on. The UDP test was also as before and I've posted results here.