alright, I‘m going to do that back home. I also just asked a friend who measured 19 with only the game and spotify drawing bandwith. Could this be due to the game? the moment I closed it yesterday, up- and downstream dropped to 0
Could be the game, it is just that 19 Mbps is a quite a lot; typically games like valorant send one packet per game tick (128 Hz I believe) and actor. Now I think these packets typically are smaller than full MTU (~1500 bytes), but let's assume one full packet per omponent:
(128 * 1500*8)/1000^2 = 1.536 Mbps/oponent
Mmmh, maybe 15-19 Mbps is not that bad 19/1.536 = 12.3697916667 other players, that does not sound that excessive! Maybe my assumption about how much download traffic a modern game requires is off.... How many players do you typically share the server with?
But with a 37 Mbps Shaper 19 Mbps should still go through relatively smoothly.
It depends on the game mode, usually around 9-11
Mmh, so the amount of data is at least not off by an order of magnitude, but still rather high... I guess that still should be confirmed by packet captures during gameplay (also to get an idea how large valorant's packets actually are).
But that still leaves us to puzzle why the shaper at 37 Mbps with only 19 Mbps worth of traffic still drops packets.... we would need to see packet bursts that clog the queue for > 100 ms before the dropper is engaged at all, but if all packets for 12 players come back to back we are talking about:
(12 * 1500*8)/1000^2 = 0.144 Mbit
worth of packets which at 37 Mbps would take roughly
1000 * 0.144/37 = 3.89ms
to service which is way to short to drive the respective cake hashbucket into dropping mode (for at least 100ms the minimum sojourn time would need to stay above 5ms)...
I think I was able to capture some instances of packet loss while wireshark was running:
-
I had several retransmissions (88 in about 5mins) as well as 22 instances where the previous tcp segment was not captured (= packet loss, I if got that right).
-
the source was always a cloudflare server (http://172.64.155.155) - I use their dns servers if that's relevant - and the destination my pc's local ip.
-
part of the info was either "Ignored Unknown Record" or "TCP segment of a reassembled PDU)"
Those are the corresponding xDSL stats:
Previous 15 minutes time = 15 min 0 sec
FEC:		1108	0
CRC:		1		0
ES:		    1		0
SES:		0		0
UAS:		0		0
LOS:		0		0
LOF:		0		0
LOM:		0		0
The xDSL stats are only relevant if you would see considerable more drops in Valorant than cake logs over the same period, but alas it seems that these are well correlated...
You probably know, but only CRCs (and unsuccessful retransmissions that your modem does not log) are indicative of lost packets, so your line seems to be clean right now.
Not sure about the latter, but always try to look at the tc -s qdisc output differences from before and after the capture to see whether these might be caused by your own traffic shaper.
Mmmh, is valorant using these servers as well?
What I would like to know is how many packets and in what interval does the game send in your direction while you play...
I ran another test for about 10mins. I was just running around on an online server without any other players. according to valorant, I dropped 163 packets and could tell that there were some issues (teleporting, lag)
- result
tc -s qdiscbefore
root@OpenWrt:~# tc -s qdisc
qdisc noqueue 0: dev lo root refcnt 2
 Sent 0 bytes 0 pkt (dropped 0, overlimits 0 requeues 0)
 backlog 0b 0p requeues 0
qdisc fq_codel 0: dev eth0 root refcnt 2 limit 10240p flows 1024 quantum 1514 target 5ms interval 100ms memory_limit 4Mb ecn drop_batch 64
 Sent 19005095081 bytes 25545737 pkt (dropped 0, overlimits 0 requeues 609)
 backlog 0b 0p requeues 609
  maxpacket 1514 drop_overlimit 0 new_flow_count 595 ecn_mark 0
  new_flows_len 0 old_flows_len 0
qdisc noqueue 0: dev br-lan root refcnt 2
 Sent 0 bytes 0 pkt (dropped 0, overlimits 0 requeues 0)
 backlog 0b 0p requeues 0
qdisc noqueue 0: dev eth0.1 root refcnt 2
 Sent 0 bytes 0 pkt (dropped 0, overlimits 0 requeues 0)
 backlog 0b 0p requeues 0
qdisc cake 8011: dev eth0.2 root refcnt 2 bandwidth 10Mbit diffserv3 dual-srchost nat nowash no-ack-filter split-gso rtt 100ms noatm overhead 34 mpu 88 memlimit 8Mb
 Sent 7267520 bytes 18948 pkt (dropped 1, overlimits 454 requeues 0)
 backlog 0b 0p requeues 0
 memory used: 20Kb of 8Mb
 capacity estimate: 10Mbit
 min/max network layer size:           28 /    1480
 min/max overhead-adjusted size:       88 /    1514
 average network hdr offset:           14

                   Bulk  Best Effort        Voice
  thresh        625Kbit       10Mbit     2500Kbit
  target         29.1ms          5ms       7.29ms
  interval        124ms        100ms        102ms
  pk_delay          0us       2.15ms         93us
  av_delay          0us        169us          3us
  sp_delay          0us         16us          3us
  backlog            0b           0b           0b
  pkts                0        18912           37
  bytes               0      7263528         5486
  way_inds            0            6            0
  way_miss            0          469            6
  way_cols            0            0            0
  drops               0            1            0
  marks               0            0            0
  ack_drop            0            0            0
  sp_flows            0            1            1
  bk_flows            0            1            0
  un_flows            0            0            0
  max_len             0         1494          590
  quantum           300          305          300

qdisc ingress ffff: dev eth0.2 parent ffff:fff1 ----------------
 Sent 2798189 bytes 13932 pkt (dropped 0, overlimits 0 requeues 0)
 backlog 0b 0p requeues 0
qdisc cake 8012: dev ifb4eth0.2 root refcnt 2 bandwidth 37500Kbit diffserv3 dual-dsthost nat nowash ingress no-ack-filter split-gso rtt 100ms noatm overhead 34 mpu 88 memlimit 8Mb
 Sent 2982639 bytes 13925 pkt (dropped 7, overlimits 2173 requeues 0)
 backlog 0b 0p requeues 0
 memory used: 294Kb of 8Mb
 capacity estimate: 37500Kbit
 min/max network layer size:           46 /    1500
 min/max overhead-adjusted size:       88 /    1534
 average network hdr offset:           14

                   Bulk  Best Effort        Voice
  thresh       2343Kbit    37500Kbit     9375Kbit
  target         7.75ms          5ms          5ms
  interval        103ms        100ms        100ms
  pk_delay          0us        290us         38us
  av_delay          0us         30us          3us
  sp_delay          0us         16us          3us
  backlog            0b           0b           0b
  pkts                0        13885           47
  bytes               0      2990007         3230
  way_inds            0           11            0
  way_miss            0          475            4
  way_cols            0            0            0
  drops               0            7            0
  marks               0            0            0
  ack_drop            0            0            0
  sp_flows            0            0            1
  bk_flows            0            1            0
  un_flows            0            0            0
  max_len             0         1514           70
  quantum           300         1144          300
- after:
root@OpenWrt:~# tc -s qdisc
qdisc noqueue 0: dev lo root refcnt 2
 Sent 0 bytes 0 pkt (dropped 0, overlimits 0 requeues 0)
 backlog 0b 0p requeues 0
qdisc fq_codel 0: dev eth0 root refcnt 2 limit 10240p flows 1024 quantum 1514 target 5ms interval 100ms memory_limit 4Mb ecn drop_batch 64
 Sent 19029879881 bytes 25626166 pkt (dropped 0, overlimits 0 requeues 610)
 backlog 0b 0p requeues 610
  maxpacket 1514 drop_overlimit 0 new_flow_count 597 ecn_mark 0
  new_flows_len 0 old_flows_len 0
qdisc noqueue 0: dev br-lan root refcnt 2
 Sent 0 bytes 0 pkt (dropped 0, overlimits 0 requeues 0)
 backlog 0b 0p requeues 0
qdisc noqueue 0: dev eth0.1 root refcnt 2
 Sent 0 bytes 0 pkt (dropped 0, overlimits 0 requeues 0)
 backlog 0b 0p requeues 0
qdisc cake 8011: dev eth0.2 root refcnt 2 bandwidth 10Mbit diffserv3 dual-srchost nat nowash no-ack-filter split-gso rtt 100ms noatm overhead 34 mpu 88 memlimit 8Mb
 Sent 22720563 bytes 63427 pkt (dropped 2, overlimits 1453 requeues 0)
 backlog 0b 0p requeues 0
 memory used: 58Kb of 8Mb
 capacity estimate: 10Mbit
 min/max network layer size:           28 /    1500
 min/max overhead-adjusted size:       88 /    1534
 average network hdr offset:           14

                   Bulk  Best Effort        Voice
  thresh        625Kbit       10Mbit     2500Kbit
  target         29.1ms          5ms       7.29ms
  interval        124ms        100ms        102ms
  pk_delay          0us       1.14ms       1.36ms
  av_delay          0us         56us         74us
  sp_delay          0us         16us         19us
  backlog            0b           0b           0b
  pkts                0        63249          180
  bytes               0     22689861        32250
  way_inds            0            9            0
  way_miss            0         1221            8
  way_cols            0            0            0
  drops               0            2            0
  marks               0            0            0
  ack_drop            0            0            0
  sp_flows            0            1            1
  bk_flows            0            1            0
  un_flows            0            0            0
  max_len             0         1514          590
  quantum           300          305          300

qdisc ingress ffff: dev eth0.2 parent ffff:fff1 ----------------
 Sent 9776467 bytes 47051 pkt (dropped 0, overlimits 0 requeues 0)
 backlog 0b 0p requeues 0
qdisc cake 8012: dev ifb4eth0.2 root refcnt 2 bandwidth 37500Kbit diffserv3 dual-dsthost nat nowash ingress no-ack-filter split-gso rtt 100ms noatm overhead 34 mpu 88 memlimit 8Mb
 Sent 10423069 bytes 47043 pkt (dropped 8, overlimits 5677 requeues 0)
 backlog 0b 0p requeues 0
 memory used: 294Kb of 8Mb
 capacity estimate: 37500Kbit
 min/max network layer size:           46 /    1500
 min/max overhead-adjusted size:       88 /    1534
 average network hdr offset:           14

                   Bulk  Best Effort        Voice
  thresh       2343Kbit    37500Kbit     9375Kbit
  target         7.75ms          5ms          5ms
  interval        103ms        100ms        100ms
  pk_delay          0us        225us         49us
  av_delay          0us         30us         10us
  sp_delay          0us         12us          9us
  backlog            0b           0b           0b
  pkts                0        46892          159
  bytes               0     10424077        11104
  way_inds            0           84            0
  way_miss            0         1229            5
  way_cols            0            0            0
  drops               0            8            0
  marks               0            0            0
  ack_drop            0            0            0
  sp_flows            0            2            0
  bk_flows            0            0            0
  un_flows            0            0            0
  max_len             0         1514          194
  quantum           300         1144          300
- xdsl stats:
Previous 15 minutes time = 15 min 0 sec
FEC:		1320		0
CRC:		4		0
ES:		1		0
SES:		0		0
UAS:		0		0
LOS:		0		0
LOF:		0		0
LOM:		0		0
- wireshark:
- 4x TCP Previous segment not captured (all from the game server to my pc)
- 2x Retransmission
- time interval (seconds since start):
No.		time 		source 			destination 	protocol 	length	 info
33048	122.694057	162.249.72.1	192.168.10.213	UDP			217		7112 → 55840 Len=175
33049	122.710033	162.249.72.1	192.168.10.213	UDP			84		7112 → 55840 Len=42
33050	122.724831	162.249.72.1	192.168.10.213	UDP			74		7112 → 55840 Len=32
I also took a screenshot of the realtime bandwith graph towards the end (this was just me on an online server without any other players):
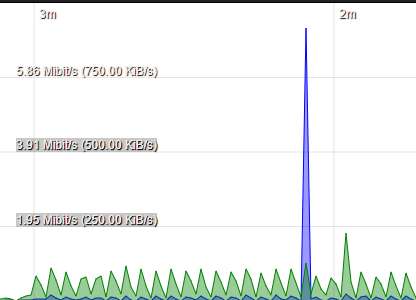
I'm really confused since I can't really see the packet loss indicated by the game itself in the data (whether it is wireshark, xdsl or tc -s qdisc. Nethertheless, it was really noticable that there was something wrong. I had a friend of mine do the same thing and he did not drop a single packet within 10mins
Edit: While I was typing this message, I apparently dropped some more packets even though there was no real load (game menu open):
root@OpenWrt:~# tc -s qdisc
qdisc noqueue 0: dev lo root refcnt 2
 Sent 0 bytes 0 pkt (dropped 0, overlimits 0 requeues 0)
 backlog 0b 0p requeues 0
qdisc fq_codel 0: dev eth0 root refcnt 2 limit 10240p flows 1024 quantum 1514 target 5ms interval 100ms memory_limit 4Mb ecn drop_batch 64
 Sent 19101488758 bytes 25726194 pkt (dropped 0, overlimits 0 requeues 610)
 backlog 0b 0p requeues 610
  maxpacket 1514 drop_overlimit 0 new_flow_count 597 ecn_mark 0
  new_flows_len 0 old_flows_len 0
qdisc noqueue 0: dev br-lan root refcnt 2
 Sent 0 bytes 0 pkt (dropped 0, overlimits 0 requeues 0)
 backlog 0b 0p requeues 0
qdisc noqueue 0: dev eth0.1 root refcnt 2
 Sent 0 bytes 0 pkt (dropped 0, overlimits 0 requeues 0)
 backlog 0b 0p requeues 0
qdisc cake 8011: dev eth0.2 root refcnt 2 bandwidth 10Mbit diffserv3 dual-srchost nat nowash no-ack-filter split-gso rtt 100ms noatm overhead 34 mpu 88 memlimit 8Mb
 Sent 29835620 bytes 103192 pkt (dropped 9, overlimits 8991 requeues 0)
 backlog 0b 0p requeues 0
 memory used: 58Kb of 8Mb
 capacity estimate: 10Mbit
 min/max network layer size:           28 /    1500
 min/max overhead-adjusted size:       88 /    1534
 average network hdr offset:           14

                   Bulk  Best Effort        Voice
  thresh        625Kbit       10Mbit     2500Kbit
  target         29.1ms          5ms       7.29ms
  interval        124ms        100ms        102ms
  pk_delay          0us       12.5ms       1.09ms
  av_delay          0us       1.05ms         63us
  sp_delay          0us         14us          9us
  backlog            0b           0b           0b
  pkts                0       102964          237
  bytes               0     29797530        47504
  way_inds            0          231            0
  way_miss            0         3379           11
  way_cols            0            0            0
  drops               0            9            0
  marks               0            0            0
  ack_drop            0            0            0
  sp_flows            0            1            1
  bk_flows            0            1            0
  un_flows            0            0            0
  max_len             0         1514          590
  quantum           300          305          300

qdisc ingress ffff: dev eth0.2 parent ffff:fff1 ----------------
 Sent 72994395 bytes 106485 pkt (dropped 0, overlimits 0 requeues 0)
 backlog 0b 0p requeues 0
qdisc cake 8012: dev ifb4eth0.2 root refcnt 2 bandwidth 37500Kbit diffserv3 dual-dsthost nat nowash ingress no-ack-filter split-gso rtt 100ms noatm overhead 34 mpu 88 memlimit 8Mb
 Sent 74432445 bytes 106448 pkt (dropped 37, overlimits 82212 requeues 0)
 backlog 0b 0p requeues 0
 memory used: 294Kb of 8Mb
 capacity estimate: 37500Kbit
 min/max network layer size:           46 /    1500
 min/max overhead-adjusted size:       88 /    1534
 average network hdr offset:           14

                   Bulk  Best Effort        Voice
  thresh       2343Kbit    37500Kbit     9375Kbit
  target         7.75ms          5ms          5ms
  interval        103ms        100ms        100ms
  pk_delay          4us        520us        107us
  av_delay          0us         85us         17us
  sp_delay          0us         15us         13us
  backlog            0b           0b           0b
  pkts                1       106013          471
  bytes              90     74452331        32764
  way_inds            0          417            0
  way_miss            1         3375            5
  way_cols            0            0            0
  drops               0           37            0
  marks               0            0            0
  ack_drop            0            0            0
  sp_flows            0            6            1
  bk_flows            0            1            0
  un_flows            0            0            0
  max_len            90         1514          194
  quantum           300         1144          300
Odd, in the first test you reported drops (cake, xdsl, wireshark* combined) do not come close to what the game reports, which indicates that these drops came either before your router/dsl link (e.g. if your ISP has congested peering/paths to the game servers or if you end up playing on an overloaded server); or after your router on the way to your gaming machine...
*) Most games use UDP and there wireshark really does not know whether a packet was dropped/is missing
Exactly, the numbers - especially cake - are not great but definitely way lower than the in game netstats.
I already replaced the cable between my pc and router; does this mean I should doubt my ISP's verdict (= line stability is solid + no packet loss measurable on their end)?
That clearly depends... the stats on your DSL link indicate that you are not having massive DSL problems, so your ISP might be right here, but it could still be that they have issues further up in their network (but again the drops could also happen truly outside of their domain).
Maybe look at the ethernet statistics of your gaming computer before and after playing a game, that is an unlikely but not impossible place to loose some packets...
Today I did another run for about an hour. The result was the same: cake and wireshark showed some packet loss, xdsl stats a couple of crc errors but what really confused me is that most of the lost packets I see within wireshark ( tcp.analysis.lost_segment) were sent from my modem to my pc. Can you make anything out of that?
Edit:
Interestingly, all these entries look exactly the same:
No.     Time        Source      Destination     Protocol  Length   Info
210953	1075.333841	192.168.1.1	192.168.10.213	TCP	      1514	   [TCP Previous segment not captured] 80 → 61708 [ACK] Seq=123817 Ack=385 Win=6432 Len=1460 [TCP segment of a reassembled PDU]
Edit2: In fact every dropped package shows "Len=1460" as part of its info even though the values within the length column vary
Smaller packet delivery units are reassembled to make the whole packet
I got an update I'd like to share with you guys: Logging with PingPlotter over the past couple of days, I realized that packet loss really is dependant on the interval: while 2,5 and 5 are totally fine, 1 and 0,5 seconds show >50% packet loss for the first two hops. Is this something I could fix within open wrt?
Edit: For 0,5s, I observed something that puzzled me: PL for the first hop (internal router ip) was constantly at 50% while the value slowly climbed up for the second hop (external ipv4 address), starting at around 20 all the way up to 70%
Increase the ICMP rate limit... but really that is purely cosmetic, the easiest way forward is to ignore these two hops (as long as higher-up hops show considerably less/no packet loss).
It seems like the three hops following my external ip (third one = last from my ISP's network before they hand it over to the valorant servers) are - even though this happens much slower - also following the 'build up' on the second hop. They start at 0% packet loss but went up to 4, 6, and 8% packet loss. I could not spot any CRC errors within the same time frame
Edit: The moment I restart to ping, PL is gone for these hops again. With a larger interval (2,5s) there is no such 'build up' of PL
It is a well known fact that network operators consider ICMP more of a courtesy than something they strictly owe the network's users so many hops will either down-prioritize ICMP response generation or rate limit it or both. So ping/traceroute/mtr/pingplotter are still useful tools, but not as easy to interpret as one would like. Here is a link to a great description of the issues, albeit a but technical:
https://archive.nanog.org/sites/default/files/10_Roisman_Traceroute.pdf
See the section titled "Prioritization and Rate Limiting" ![]()
Thank you for these slides! They really helped me to understand what I'm doing there when I'm pinging several IPs at once.
Today, I realized something that was rather odd to me: Packet Loss jumped to 100% for less than a sec when I turned wifi on/off. Is this normal behaviour (I was able to replicate it consistently) or could it indicate some router malfunction?
It depends, if pingplotter runs on a machine connected via the WiFi being switched off and on again, I would expect packet loss, if pingplotter runs on a computer connected to the router via wired ethernet I would expect no packet loss.
I ran PingPlotter on a PC connected via LAN (motherboard without wifi) and deactivated wifi via Luci web interface on the same machine.
Ah, then I would not expect packetloss, but I have not tested that myself, so can not tell whether my intuition is correct for OpenWrt's default behavior.