Internal Packet loss (first two hops)

Hello,
I originally switched to OpenWRT in order to eliminate Packet Loss via SQM for a better gaming and video conferencing experience. Jitter looks great now but I realized that I now have internal packet loss (first two hops, tested with PingPlotter).
My setup: Zyxel VMG1312-B30A in bridge mode, TP Link Archer C7 V5 as router, gaming pc directly connected via lan; 50/15 connection set to 38/11 (SQM).

I already reset my router, reinstalled the current OpenWRT firmware, replaced all the cables, disabled wifi, and even removed every other device from the network except for the gaming PC. The packet loss is not visible when I use the zyxel modem as a router, but then I have the jitter again because I'm not using OpenWrt's great SQM.

Is there anything else I could try in order to fix this internal packet loss?

Just ignore it? As long as you have no loss (or almost no loss) to pingplotter's endpoints all is well, many hops rate-limit their ICMP responses, if you ping such a hop too hard it will stop responding to all echo requests... that generally is not a problem.

Also the way SQM works is that it carefully will drop/mark a few selected packets and with responsive traffic that is all that is needed, it will only start dropping hard if a flow is completely unresponsive and above its fair capacity share for long enough.

3 Likes

It doesn't bother me during office usage/browsing, but online gaming is almost impossible. Ingame monitoring also highlights packet loss. On 'good' days I drop about 1.000 packets in 30mins, sometimes these numbers go up to about 40.000 dropped packets (according to valorants net stats). I was already in contact with their support and they asked me to run pingplotter and ping the game server while playing. I did this on 5 occassions (different days + times of the day) and saw that the packet loss in ping plotter only affected the first two hops (router + external ip; sometimes I had 0.1-1% on a different hop for a couple of seconds but I guess that these situations can't be responsible for several houndred or thousand dropped packets).
It's almost impossible to play a game like that because rubberbanding, random teleportations or 'ghosts' (player models showing up for me while they are actually somewhere else on the map).

Edit: I also dialed down the up-/downstream even more (down to 15/7) to test whether it's related to sqm but it didn't change anything

But that is unrelated to seeing dropped ICMP packets along a traceroute/mtr/pingplotter path unless these drops also affect the final hop.

Well, that looks like something is dropping, alright.

Yes, you can ignore these intermediate apparent packt losses, if the endhost shows zero drops all the intermediate hosts were doing just fine in routing/transporting your packets.

So if you run tc -s qdisc sqm configured with cake will show cake's statistics, which include number of dropped packets, maybe run repeatedly this while playing and see whether the number of drops in cake comes anywhere near your drops as reported by valorant.

I know that it's a really small sample size but I just opened the game, jumped onto a server and this is the result of "tc -s qdisc" after 3mins. Unfortunately I don't know how to interpret the result. Is there a wiki page I should have a look at?

root@OpenWrt:~# tc -s qdisc
qdisc noqueue 0: dev lo root refcnt 2
 Sent 0 bytes 0 pkt (dropped 0, overlimits 0 requeues 0)
 backlog 0b 0p requeues 0
qdisc fq_codel 0: dev eth0 root refcnt 2 limit 10240p flows 1024 quantum 1514 target 5ms interval 100ms memory_limit 4Mb ecn drop_batch 64
 Sent 15109434825 bytes 20181428 pkt (dropped 0, overlimits 0 requeues 34)
 backlog 0b 0p requeues 34
  maxpacket 1514 drop_overlimit 0 new_flow_count 51 ecn_mark 0
  new_flows_len 0 old_flows_len 0
qdisc noqueue 0: dev br-lan root refcnt 2
 Sent 0 bytes 0 pkt (dropped 0, overlimits 0 requeues 0)
 backlog 0b 0p requeues 0
qdisc noqueue 0: dev eth0.1 root refcnt 2
 Sent 0 bytes 0 pkt (dropped 0, overlimits 0 requeues 0)
 backlog 0b 0p requeues 0
qdisc cake 8009: dev eth0.2 root refcnt 2 bandwidth 10Mbit besteffort triple-isolate nonat nowash no-ack-filter split-gso rtt 100ms noatm overhead 34
 Sent 911511367 bytes 8242211 pkt (dropped 299, overlimits 448343 requeues 0)
 backlog 0b 0p requeues 0
 memory used: 583168b of 4Mb
 capacity estimate: 10Mbit
 min/max network layer size:           28 /    1500
 min/max overhead-adjusted size:       62 /    1534
 average network hdr offset:           14

                  Tin 0
  thresh         10Mbit
  target            5ms
  interval        100ms
  pk_delay        640us
  av_delay         40us
  sp_delay         15us
  backlog            0b
  pkts          8242510
  bytes       911901930
  way_inds      1378976
  way_miss        67911
  way_cols            0
  drops             299
  marks             122
  ack_drop            0
  sp_flows           15
  bk_flows            1
  un_flows            0
  max_len         46066
  quantum           305

qdisc ingress ffff: dev eth0.2 parent ffff:fff1 ----------------
 Sent 19676283638 bytes 15360689 pkt (dropped 0, overlimits 0 requeues 0)
 backlog 0b 0p requeues 0
qdisc cake 800a: dev ifb4eth0.2 root refcnt 2 bandwidth 37500Kbit besteffort triple-isolate nonat wash no-ack-filter split-gso rtt 100ms noatm overhead 34
 Sent 19832169801 bytes 15319572 pkt (dropped 41117, overlimits 24238382 requeues 0)
 backlog 0b 0p requeues 0
 memory used: 1270Kb of 4Mb
 capacity estimate: 37500Kbit
 min/max network layer size:           46 /    1500
 min/max overhead-adjusted size:       80 /    1534
 average network hdr offset:           14

                  Tin 0
  thresh      37500Kbit
  target            5ms
  interval        100ms
  pk_delay          3ms
  av_delay       1.07ms
  sp_delay        181us
  backlog            0b
  pkts         15360689
  bytes     19891333284
  way_inds       796016
  way_miss        67574
  way_cols            0
  drops           41117
  marks             251
  ack_drop            0
  sp_flows           16
  bk_flows            1
  un_flows            0
  max_len          1514
  quantum          1144

qdisc noqueue 0: dev wlan0 root refcnt 2
 Sent 0 bytes 0 pkt (dropped 0, overlimits 0 requeues 0)
 backlog 0b 0p requeues 0
qdisc noqueue 0: dev wlan1 root refcnt 2
 Sent 0 bytes 0 pkt (dropped 0, overlimits 0 requeues 0)
 backlog 0b 0p requeues 0
root@OpenWrt:~#

Just to make sure that we are on the same page: Riot (Valorant dev company) support told me, that I will always get 100% PL at the final destination because of the way the server is set up. The hop before that (80.81.193.162/pr02.fra02.riotdirect.net) shows no PL, though

Mmmh, you need to capture the statistcs at least twice once just before starting the game and once later, so you can compare the values in the drops row.

In that case the final IP is not a good address to hand to users for debugging.... but if the penultimate hop shows no packet loss, that indicates that your traffic to and from that hop seems to not be affected by spurious packet loss.

Alright, I'm gonna do this tonight during a 'longer' session. Would you advice to restart both devices (modem + router) prior to logging?

I also attached a 10min pingplotter log to this message. I redacted my ip address (please let me know if there's more information I shouldn't share online)

Target Name: 162.249.72.1
         IP: 162.249.72.1
  Date/Time: 28.06.2022 15:44:26 - 28.06.2022 15:54:26

Hop  Sent  PL%    Min    Max    Avg  Host Name / [IP]
  1   239   50   0,23   0,67   0,35  OpenWrt.lan [192.168.10.1]
  2   239   50  20,61  22,38  21,19  91.XXX.XX.X [91.XXX.XX.X]
  3   239    0  21,64  56,83  23,54  10.226.19.53 [10.226.19.53]
  4   239    0  21,64  46,28  22,75  5.10.7.73 [5.10.7.73]
  5   239    0  27,98  42,87  29,22  eth-trunk-63.rt-pe-ffm-5.inf.komdsl.de [80.81.193.95]
  6   239    0  27,80  31,64  28,78  pr02.fra02.riotdirect.net [80.81.193.162]
  7   239  100      0      0      0  162.249.72.1 [162.249.72.1]

For this test, no; the question really is will cake accumulate a similar amount of lost packets as your game. So you should before/after quitting the gaming look up how many lost packets it reports.

First: Thank you for your help!

I was able to measure some more:

  • PingPlotter showed the same result as above (PL on the first two hops varies between 20 and 80)
  • Valorant net stats showed 47 lost packets (most of them outgoing)
  • I also attached a before and after log

Valorant Screenshot 2022.06.28 - 16.04.41.20

Before

root@OpenWrt:~# tc -s qdisc
qdisc noqueue 0: dev lo root refcnt 2
 Sent 0 bytes 0 pkt (dropped 0, overlimits 0 requeues 0)
 backlog 0b 0p requeues 0
qdisc fq_codel 0: dev eth0 root refcnt 2 limit 10240p flows 1024 quantum 1514 target 5ms interval 100ms memory_limit 4Mb ecn drop_batch 64
 Sent 17314570517 bytes 22542095 pkt (dropped 0, overlimits 0 requeues 34)
 backlog 0b 0p requeues 34
  maxpacket 1514 drop_overlimit 0 new_flow_count 51 ecn_mark 0
  new_flows_len 0 old_flows_len 0
qdisc noqueue 0: dev br-lan root refcnt 2
 Sent 0 bytes 0 pkt (dropped 0, overlimits 0 requeues 0)
 backlog 0b 0p requeues 0
qdisc noqueue 0: dev eth0.1 root refcnt 2
 Sent 0 bytes 0 pkt (dropped 0, overlimits 0 requeues 0)
 backlog 0b 0p requeues 0
qdisc cake 8009: dev eth0.2 root refcnt 2 bandwidth 10Mbit besteffort triple-isolate nonat nowash no-ack-filter split-gso rtt 100ms noatm overhead 34
 Sent 965260468 bytes 9057924 pkt (dropped 301, overlimits 463684 requeues 0)
 backlog 0b 0p requeues 0
 memory used: 583168b of 4Mb
 capacity estimate: 10Mbit
 min/max network layer size:           28 /    1500
 min/max overhead-adjusted size:       62 /    1534
 average network hdr offset:           14

                  Tin 0
  thresh         10Mbit
  target            5ms
  interval        100ms
  pk_delay         78us
  av_delay         16us
  sp_delay         12us
  backlog            0b
  pkts          9058225
  bytes       965651931
  way_inds      1381682
  way_miss        71648
  way_cols            0
  drops             301
  marks             123
  ack_drop            0
  sp_flows            0
  bk_flows            1
  un_flows            0
  max_len         46066
  quantum           305

qdisc ingress ffff: dev eth0.2 parent ffff:fff1 ----------------
 Sent 21805825352 bytes 16899430 pkt (dropped 0, overlimits 0 requeues 0)
 backlog 0b 0p requeues 0
qdisc cake 800a: dev ifb4eth0.2 root refcnt 2 bandwidth 37500Kbit besteffort triple-isolate nonat wash no-ack-filter split-gso rtt 100ms noatm overhead 34
 Sent 21983146621 bytes 16858233 pkt (dropped 41197, overlimits 26726671 requeues 0)
 backlog 0b 0p requeues 0
 memory used: 1270Kb of 4Mb
 capacity estimate: 37500Kbit
 min/max network layer size:           46 /    1500
 min/max overhead-adjusted size:       80 /    1534
 average network hdr offset:           14

                  Tin 0
  thresh      37500Kbit
  target            5ms
  interval        100ms
  pk_delay       1.86ms
  av_delay        876us
  sp_delay        130us
  backlog            0b
  pkts         16899430
  bytes     22042417372
  way_inds       801669
  way_miss        71313
  way_cols            0
  drops           41197
  marks             251
  ack_drop            0
  sp_flows            0
  bk_flows            1
  un_flows            0
  max_len          1514
  quantum          1144

qdisc noqueue 0: dev wlan0 root refcnt 2
 Sent 0 bytes 0 pkt (dropped 0, overlimits 0 requeues 0)
 backlog 0b 0p requeues 0
qdisc noqueue 0: dev wlan1 root refcnt 2
 Sent 0 bytes 0 pkt (dropped 0, overlimits 0 requeues 0)
 backlog 0b 0p requeues 0

After:

root@OpenWrt:~# tc -s qdisc
qdisc noqueue 0: dev lo root refcnt 2
 Sent 0 bytes 0 pkt (dropped 0, overlimits 0 requeues 0)
 backlog 0b 0p requeues 0
qdisc fq_codel 0: dev eth0 root refcnt 2 limit 10240p flows 1024 quantum 1514 target 5ms interval 100ms memory_limit 4Mb ecn drop_batch 64
 Sent 17546418077 bytes 22813980 pkt (dropped 0, overlimits 0 requeues 34)
 backlog 0b 0p requeues 34
  maxpacket 1514 drop_overlimit 0 new_flow_count 51 ecn_mark 0
  new_flows_len 0 old_flows_len 0
qdisc noqueue 0: dev br-lan root refcnt 2
 Sent 0 bytes 0 pkt (dropped 0, overlimits 0 requeues 0)
 backlog 0b 0p requeues 0
qdisc noqueue 0: dev eth0.1 root refcnt 2
 Sent 0 bytes 0 pkt (dropped 0, overlimits 0 requeues 0)
 backlog 0b 0p requeues 0
qdisc cake 8009: dev eth0.2 root refcnt 2 bandwidth 10Mbit besteffort triple-isolate nonat nowash no-ack-filter split-gso rtt 100ms noatm overhead 34
 Sent 975524399 bytes 9156755 pkt (dropped 301, overlimits 468410 requeues 0)
 backlog 0b 0p requeues 0
 memory used: 583168b of 4Mb
 capacity estimate: 10Mbit
 min/max network layer size:           28 /    1500
 min/max overhead-adjusted size:       62 /    1534
 average network hdr offset:           14

                  Tin 0
  thresh         10Mbit
  target            5ms
  interval        100ms
  pk_delay         89us
  av_delay         17us
  sp_delay         12us
  backlog            0b
  pkts          9157056
  bytes       975915862
  way_inds      1381684
  way_miss        72063
  way_cols            0
  drops             301
  marks             123
  ack_drop            0
  sp_flows            1
  bk_flows            1
  un_flows            0
  max_len         46066
  quantum           305

qdisc ingress ffff: dev eth0.2 parent ffff:fff1 ----------------
 Sent 22024821702 bytes 17071713 pkt (dropped 0, overlimits 0 requeues 0)
 backlog 0b 0p requeues 0
qdisc cake 800a: dev ifb4eth0.2 root refcnt 2 bandwidth 37500Kbit besteffort triple-isolate nonat wash no-ack-filter split-gso rtt 100ms noatm overhead 34
 Sent 22204553419 bytes 17030515 pkt (dropped 41198, overlimits 26976721 requeues 0)
 backlog 0b 0p requeues 0
 memory used: 1270Kb of 4Mb
 capacity estimate: 37500Kbit
 min/max network layer size:           46 /    1500
 min/max overhead-adjusted size:       80 /    1534
 average network hdr offset:           14

                  Tin 0
  thresh      37500Kbit
  target            5ms
  interval        100ms
  pk_delay       1.77ms
  av_delay        613us
  sp_delay         64us
  backlog            0b
  pkts         17071713
  bytes     22263825684
  way_inds       801982
  way_miss        71737
  way_cols            0
  drops           41198
  marks             251
  ack_drop            0
  sp_flows            1
  bk_flows            1
  un_flows            0
  max_len          1514
  quantum          1144

qdisc noqueue 0: dev wlan0 root refcnt 2
 Sent 0 bytes 0 pkt (dropped 0, overlimits 0 requeues 0)
 backlog 0b 0p requeues 0
qdisc noqueue 0: dev wlan1 root refcnt 2
 Sent 0 bytes 0 pkt (dropped 0, overlimits 0 requeues 0)
 backlog 0b 0p requeues 0

cake logged on dropped packet from the internet to your network.... so far from 47 and it is not clear whether that dropped packet belonged to your game.
Before:

After:

no drop in the other direction from you to the internet, and no CE marking in either direction.

That‘s really odd. I experienced stutter, even teleported when PL was rising but neither pingplotter nor the router registered what the game shows. I‘m going to do more logs but right now I‘m rather clueless because I don‘t know where exactly these problems (if it even is PL as valorant states) occur.

Well the problems can well be on the wan side, say if you have DSL problems... Maybe go and get @janh's great DSL tool at https://github.com/janh/go-dsl and post the full GUI report (bitloading and SNR spectrum, as well as numerical error and statistics numbers)?

Thank you for the recommendation. Unfortunately, it looks like my router (model mentioned in first post) is not supported.
However, I also had a look at the xDSL stats that my modem shows and they appeared to be normal while I was in game and logging
image

Edit: the stats cover a 15min time frame

Mmmh, I would have thought that this just works as generic broadcom modem for g-dsl. Other than that you could use DSLStats...

I just experienced lag/latency issues again and logged for 15mins. Here are the results:

  1. OpenWrt: cake

before:

root@OpenWrt:~# tc -s qdisc
qdisc noqueue 0: dev lo root refcnt 2
 Sent 0 bytes 0 pkt (dropped 0, overlimits 0 requeues 0)
 backlog 0b 0p requeues 0
qdisc fq_codel 0: dev eth0 root refcnt 2 limit 10240p flows 1024 quantum 1514 target 5ms interval 100ms memory_limit 4Mb ecn drop_batch 64
 Sent 17961582082 bytes 23450980 pkt (dropped 0, overlimits 0 requeues 34)
 backlog 0b 0p requeues 34
  maxpacket 1514 drop_overlimit 0 new_flow_count 51 ecn_mark 0
  new_flows_len 0 old_flows_len 0
qdisc noqueue 0: dev br-lan root refcnt 2
 Sent 0 bytes 0 pkt (dropped 0, overlimits 0 requeues 0)
 backlog 0b 0p requeues 0
qdisc noqueue 0: dev eth0.1 root refcnt 2
 Sent 0 bytes 0 pkt (dropped 0, overlimits 0 requeues 0)
 backlog 0b 0p requeues 0
qdisc cake 8009: dev eth0.2 root refcnt 2 bandwidth 10Mbit besteffort triple-isolate nonat nowash no-ack-filter split-gso rtt 100ms noatm overhead 34
 Sent 1013701966 bytes 9490088 pkt (dropped 313, overlimits 510750 requeues 0)
 backlog 0b 0p requeues 0
 memory used: 583168b of 4Mb
 capacity estimate: 10Mbit
 min/max network layer size:           28 /    1500
 min/max overhead-adjusted size:       62 /    1534
 average network hdr offset:           14

                  Tin 0
  thresh         10Mbit
  target            5ms
  interval        100ms
  pk_delay       5.04ms
  av_delay        232us
  sp_delay         14us
  backlog            0b
  pkts          9490401
  bytes      1014110135
  way_inds      1382908
  way_miss        82887
  way_cols            0
  drops             313
  marks             123
  ack_drop            0
  sp_flows            2
  bk_flows            1
  un_flows            0
  max_len         46066
  quantum           305

qdisc ingress ffff: dev eth0.2 parent ffff:fff1 ----------------
 Sent 23096257694 bytes 17892655 pkt (dropped 0, overlimits 0 requeues 0)
 backlog 0b 0p requeues 0
qdisc cake 800a: dev ifb4eth0.2 root refcnt 2 bandwidth 37500Kbit besteffort triple-isolate nonat wash no-ack-filter split-gso rtt 100ms noatm overhead 34
 Sent 23286820614 bytes 17850988 pkt (dropped 41667, overlimits 28221080 requeues 0)
 backlog 0b 0p requeues 0
 memory used: 1270Kb of 4Mb
 capacity estimate: 37500Kbit
 min/max network layer size:           46 /    1500
 min/max overhead-adjusted size:       80 /    1534
 average network hdr offset:           14

                  Tin 0
  thresh      37500Kbit
  target            5ms
  interval        100ms
  pk_delay       11.7ms
  av_delay       7.35ms
  sp_delay         11us
  backlog            0b
  pkts         17892655
  bytes     23346754864
  way_inds       803299
  way_miss        82746
  way_cols            0
  drops           41667
  marks             280
  ack_drop            0
  sp_flows            2
  bk_flows            1
  un_flows            0
  max_len          1514
  quantum          1144

qdisc noqueue 0: dev wlan0 root refcnt 2
 Sent 0 bytes 0 pkt (dropped 0, overlimits 0 requeues 0)
 backlog 0b 0p requeues 0
qdisc noqueue 0: dev wlan1 root refcnt 2
 Sent 0 bytes 0 pkt (dropped 0, overlimits 0 requeues 0)
 backlog 0b 0p requeues 0

after:

root@OpenWrt:~# tc -s qdisc
qdisc noqueue 0: dev lo root refcnt 2
 Sent 0 bytes 0 pkt (dropped 0, overlimits 0 requeues 0)
 backlog 0b 0p requeues 0
qdisc fq_codel 0: dev eth0 root refcnt 2 limit 10240p flows 1024 quantum 1514 target 5ms interval 100ms memory_limit 4Mb ecn drop_batch 64
 Sent 18047006061 bytes 23736107 pkt (dropped 0, overlimits 0 requeues 34)
 backlog 0b 0p requeues 34
  maxpacket 1514 drop_overlimit 0 new_flow_count 51 ecn_mark 0
  new_flows_len 0 old_flows_len 0
qdisc noqueue 0: dev br-lan root refcnt 2
 Sent 0 bytes 0 pkt (dropped 0, overlimits 0 requeues 0)
 backlog 0b 0p requeues 0
qdisc noqueue 0: dev eth0.1 root refcnt 2
 Sent 0 bytes 0 pkt (dropped 0, overlimits 0 requeues 0)
 backlog 0b 0p requeues 0
qdisc cake 8009: dev eth0.2 root refcnt 2 bandwidth 10Mbit besteffort triple-isolate nonat nowash no-ack-filter split-gso rtt 100ms noatm overhead 34
 Sent 1048771116 bytes 9641953 pkt (dropped 316, overlimits 519197 requeues 0)
 backlog 0b 0p requeues 0
 memory used: 583168b of 4Mb
 capacity estimate: 10Mbit
 min/max network layer size:           28 /    1500
 min/max overhead-adjusted size:       62 /    1534
 average network hdr offset:           14

                  Tin 0
  thresh         10Mbit
  target            5ms
  interval        100ms
  pk_delay        977us
  av_delay         75us
  sp_delay         13us
  backlog            0b
  pkts          9642269
  bytes      1049183727
  way_inds      1383181
  way_miss        85967
  way_cols            0
  drops             316
  marks             123
  ack_drop            0
  sp_flows            1
  bk_flows            1
  un_flows            0
  max_len         46066
  quantum           305

qdisc ingress ffff: dev eth0.2 parent ffff:fff1 ----------------
 Sent 23184505393 bytes 18065206 pkt (dropped 0, overlimits 0 requeues 0)
 backlog 0b 0p requeues 0
qdisc cake 800a: dev ifb4eth0.2 root refcnt 2 bandwidth 37500Kbit besteffort triple-isolate nonat wash no-ack-filter split-gso rtt 100ms noatm overhead 34
 Sent 23377276191 bytes 18023396 pkt (dropped 41810, overlimits 28307186 requeues 0)
 backlog 0b 0p requeues 0
 memory used: 1270Kb of 4Mb
 capacity estimate: 37500Kbit
 min/max network layer size:           46 /    1500
 min/max overhead-adjusted size:       80 /    1534
 average network hdr offset:           14

                  Tin 0
  thresh      37500Kbit
  target            5ms
  interval        100ms
  pk_delay         91us
  av_delay         21us
  sp_delay         13us
  backlog            0b
  pkts         18065206
  bytes     23437418277
  way_inds       806281
  way_miss        85910
  way_cols            0
  drops           41810
  marks             280
  ack_drop            0
  sp_flows            0
  bk_flows            1
  un_flows            0
  max_len          1514
  quantum          1144

qdisc noqueue 0: dev wlan0 root refcnt 2
 Sent 0 bytes 0 pkt (dropped 0, overlimits 0 requeues 0)
 backlog 0b 0p requeues 0
qdisc noqueue 0: dev wlan1 root refcnt 2
 Sent 0 bytes 0 pkt (dropped 0, overlimits 0 requeues 0)
 backlog 0b 0p requeues 0
  1. dslstats
xdslctl info --stats
xdslctl: ADSL driver and PHY status
Status: Showtime
Last Retrain Reason:    0
Last initialization procedure status:   0
Max:    Upstream rate = 15132 Kbps, Downstream rate = 49678 Kbps
Bearer: 0, Upstream rate = 14224 Kbps, Downstream rate = 48342 Kbps

Link Power State:       L0
Mode:                   VDSL2 Annex B
VDSL2 Profile:          Profile 17a
TPS-TC:                 PTM Mode(0x0)
Trellis:                U:ON /D:ON
Line Status:            No Defect
Training Status:        Showtime
                Down            Up
SNR (dB):        10.3            10.7
Attn(dB):        21.1            0.0
Pwr(dBm):        12.7            9.3

                        VDSL2 framing
                        Bearer 0
MSGc:           17              17
B:              237             237
M:              1               1
T:              64              62
R:              16              16
S:              0.1567          0.5325
L:              12968           3816
D:              205             61
I:              254             254
N:              254             254

                        Counters
                        Bearer 0
OHF:            37912295                1400359
OHFErr:         358             0
RS:             2426361711              3878110
RSCorr:         118205          9
RSUnCorr:       7709            0

                        Bearer 0
HEC:            3035            0
OCD:            0               0
LCD:            0               0
Total Cells:    280956220               0
Data Cells:     377859344               0
Drop Cells:     0
Bit Errors:     0               0

ES:             95              0
SES:            0               0
UAS:            90              1262
AS:             95440

                        Bearer 0
INP:            1.00            1.00
INPRein:        0.00            0.00
delay:          8               8
PER:            2.51            8.28
OR:             73.10           22.20
AgR:            48415.34        14246.83

Bitswap:        12424/12431             3/3

Total time = 1 days 2 hours 32 min 10 sec
FEC:            118205          9
CRC:            358             0
ES:             95              0
SES:            0               0
UAS:            90              1262
LOS:            0               0
LOF:            0               0
LOM:            0               0
Latest 15 minutes time = 2 min 10 sec
FEC:            318             0
CRC:            3               0
ES:             2               0
SES:            0               0
UAS:            0               0
LOS:            0               0
LOF:            0               0
LOM:            0               0
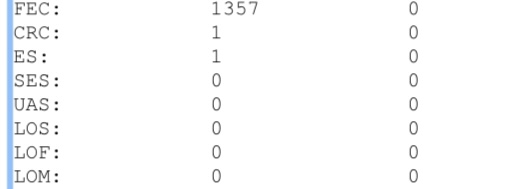
Previous 15 minutes time = 15 min 0 sec
FEC:            1322            0
CRC:            3               0
ES:             1               0
SES:            0               0
UAS:            0               0
LOS:            0               0
LOF:            0               0
LOM:            0               0
Latest 1 day time = 2 hours 32 min 10 sec
FEC:            17175           0
CRC:            60              0
ES:             14              0
SES:            0               0
UAS:            0               0
LOS:            0               0
LOF:            0               0
LOM:            0               0
Previous 1 day time = 24 hours 0 sec
FEC:            101030          9
CRC:            298             0
ES:             81              0
SES:            0               0
UAS:            90              1262
LOS:            0               0
LOF:            0               0
LOM:            0               0
Since Link time = 1 days 2 hours 30 min 39 sec
FEC:            118205          9
CRC:            358             0
ES:             95              0
SES:            0               0
UAS:            0               1172
LOS:            0               0
LOF:            0               0
LOM:            0               0
NTR: mipsCntAtNtr=0 ncoCntAtNtr=0
 > 
  1. PingPlotter Log:
Target Name: 162.249.72.1
         IP: 162.249.72.1
  Date/Time: 28.06.2022 22:15:59 - 28.06.2022 22:25:59

Hop  Sent  PL%    Min    Max    Avg  Host Name / [IP]
  1   239    0   0,18   0,54   0,36  OpenWrt.lan [192.168.10.1]
  2   239    0  20,69  24,87  21,14  XX.XXX.XX.X [XX.XXX.XX.X]
  3   239    0  21,51  77,32  23,13  10.226.19.53 [10.226.19.53]
  4   239    0  21,60  55,70  22,99  5.10.7.73 [5.10.7.73]
  5   239    0  28,04  40,83  29,10  eth-trunk-63.rt-pe-ffm-5.inf.komdsl.de [80.81.193.95]
  6   239    0  28,08  38,03  29,85  pr02.fra02.riotdirect.net [80.81.193.162]
  7   239  100      0      0      0  162.249.72.1 [162.249.72.1]

As far as I understand these results, cake actually shows some packet loss (41810-41667=143 during 15mins).

Edit: the game's net stats showed 147 lost packets:
Valorant 2022.06.28 - 22.25.21.02.DVR_Moment

Yes, that might or might not be related. What else is going on in your network while you play?

Most games produce so little traffic that cake should never be inclined to drop it, so something seems off here. Also, could you post the content of:

  1. ifstatus wan | grep -e device
  2. cat /etc/config/sqm
    please?

Apart from the gaming PC, I had no other device connected to the network for testing purposes.
Edit: there should be little to no background 'noise' on that pc. I reinstalled windows two days ago and only installed neccessary drivers, the game + firefox.

root@OpenWrt:~# ifstatus wan | grep -e device
        "l3_device": "eth0.2",
        "device": "eth0.2",
root@OpenWrt:~# cat /etc/config/sqm

config queue 'eth1'
        option debug_logging '0'
        option verbosity '5'
        option interface 'eth0.2'
        option linklayer 'ethernet'
        option overhead '34'
        option download '37500'
        option upload '10000'
        option qdisc 'cake'
        option script 'piece_of_cake.qos'
        option enabled '1'

config queue
        option interface 'wlan0'
        option debug_logging '0'
        option verbosity '5'
        option qdisc 'cake'
        option script 'piece_of_cake.qos'
        option linklayer 'none'
        option download '10000'
        option upload '4000'
        option enabled '0'
1 Like

what version openwrt are you running ? is this default stock settings or did you add / edit anything at all ?

I'm running OpenWrt 21.02.3 r16554-1d4dea6d4f / LuCI openwrt-21.02 branch git-22.083.69138-0a0ce2a, downloaded it last weekend from https://openwrt.org/toh/hwdata/tp-link/tp-link_archer_c7_v5 since I thought that it is the most recent version. Now I realized, because of your question (thank you!) that it's not the current version. Should I therefore upgrade right away?

I didn't change anything apart from installing the sqm package.