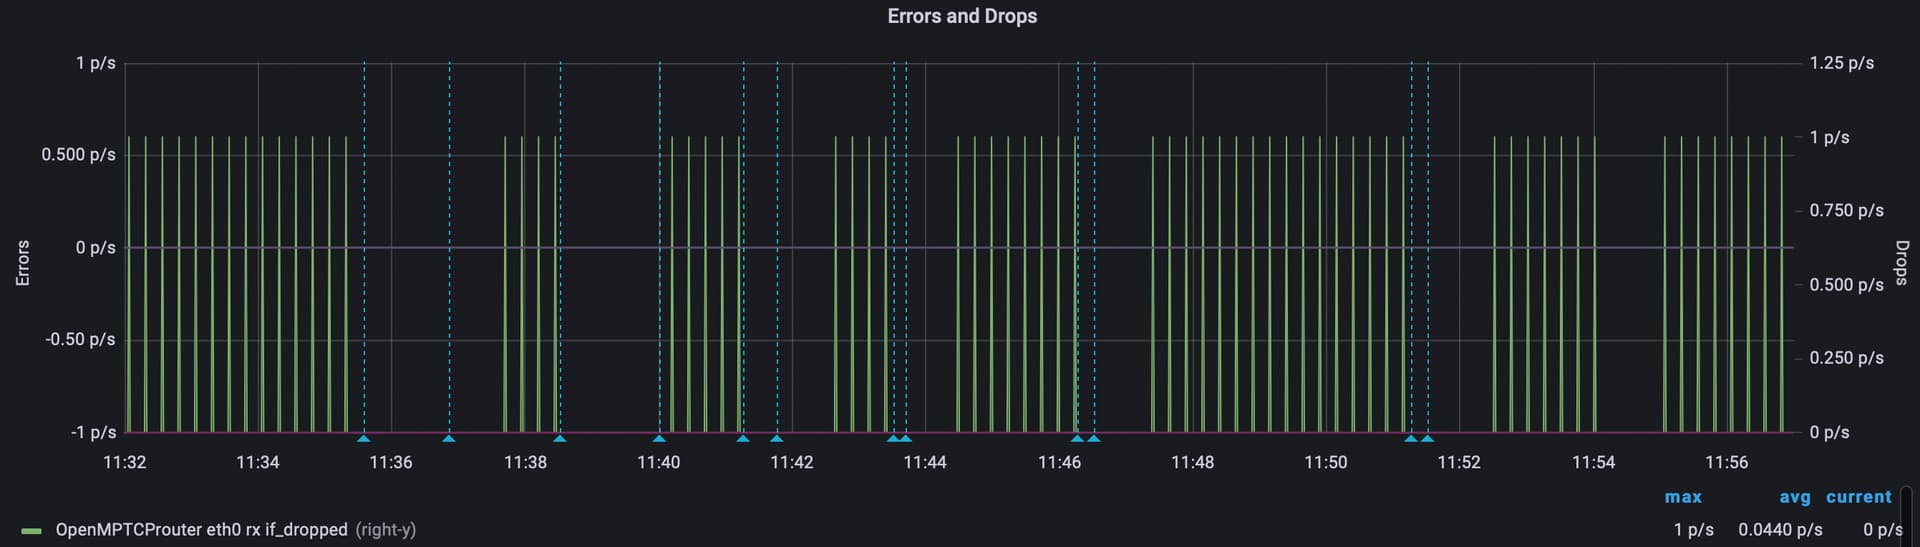
I'm having a very strange periodic packet drop reported by collectd on eth0 (LAN), but only when I have a particular device online. I'm trying to understand better what this reported packet drop is, but I can't find any DROP or REJECTED type messages in the log (neither via logread nor syslog). You can see below it's very regular (the gaps are when I was testing connecting/disconnecting the device) - the spike is exactly 15s, so I'm assuming the device is sending a packet that gets dropped. Probably harmless, but I want to understand what it is.
I'd do a tcpdump and look at it in wireshark, but I honestly have no idea what to look for. Would a tcpdump on the OpenWRT device even catch this or would it be dropped before it hit the tcpdump filter? Might need to capture from another device on the LAN side?
I think so? Under Firewall, I clicked Edit for the LAN zone -> Advanced Settings, Enable logging on this zone is checked. Maybe that's not all I need to do?
Hi,
I don't know much about the OpenWrt firewall implementation but I have a background in networking.
It looks like you are graphing ethernet stats and ethernet errors/drops likely won't show at the firewall layer. I wouldn't expect any malformed ethernet frames to get passed up the next layer but depending on ethernet nic firmware and kernel driver implementation there may be more info than a basic error counter and tcpdump might have a low enough hook to see the bad or incomplete frame. You can also look at : > ifconfig eth0 to possibly see what type of error is incrementing:
Look to see which of errors, dropped, overruns, frame or carrier are incrementing.
Ethertool may be more useful to query the NIC for the error info. You may need to install it though.
There may be more specific counters you can query with collectd but I don't know how that is setup on your system.
Edit: dmesg may show different info than logread (it does on my system) so looking at that might show something useful.
If the suspect device is a switch or even an endpoint device with a Realtek nic phy you might be seeing RRCP frames or associated protocols like their proprietary loop detection. I don't recall what I was seeing to prompt me to investigated on my network when I first added a Netgear switch but I was seeing those ether types in tcpdump before flashing it with OpenWrt. https://en.wikipedia.org/wiki/Realtek_Remote_Control_Protocol#Loop_Detect_packet
If you haven't tried yet, tcpdump might show the dropped frames but it could be useful to do ithe capture with the network very quiet. If you are not familiar with tcpdump, you can just capture some header info and show it on the terminal. You don't have to capture to a file and analyze later unless you want/need a more in-depth analysis. You could try various capture filters like the mac address of the suspect device to limit capture output.
If there is a switch between the suspected source and your OpenWrt device and other hosts are connected, do the other hosts or stats on the switch show the drops?
Is the suspect device a *nix system with a rich set of admin tools? You might be able to see what process is connecting to the network interface/driver with lsof type tools.