Hello all,
Honestly I do not know why I didn't realize before that I had a memory leak, as I have been using the router without problems for 2-3 months already. It started giving problems this week. I set up a RaspiNAS running OMV but I doubt that this has something to do with the memory leak on the router.
I've read about kmemleak but neither I have it activated on my firmware nor I know how to do that.
Additional info: I've a PiHole instance running which serves DNS requests (DHCP is done by the router itself) since the begining and I got 0 problems
Installed packages
base-files - 204.2-r10911-c155900f66
busybox - 1.30.1-5
cgi-io - 16
dnsmasq - 2.80-15
dropbear - 2019.78-2
firewall - 2019-11-22-8174814a-1
fstools - 2020-01-18-189b41b6-1
fwtool - 2
getrandom - 2019-06-16-4df34a4d-3
hostapd-common - 2019-08-08-ca8c2bd2-2
htop - 2.2.0-2
ip6tables - 1.8.3-1
iptables - 1.8.3-1
iw - 5.0.1-1
iwinfo - 2019-10-16-07315b6f-1
jshn - 2020-01-20-43a103ff-1
jsonfilter - 2018-02-04-c7e938d6-1
kernel - 4.14.167-1-a92a3f5c5bed2671533484c7ace9d5b5
kmod-cfg80211 - 4.14.167+4.19.98-1-1
kmod-gpio-button-hotplug - 4.14.167-3
kmod-ip6tables - 4.14.167-1
kmod-ipt-conntrack - 4.14.167-1
kmod-ipt-core - 4.14.167-1
kmod-ipt-nat - 4.14.167-1
kmod-ipt-offload - 4.14.167-1
kmod-lib-crc-ccitt - 4.14.167-1
kmod-mac80211 - 4.14.167+4.19.98-1-1
kmod-mwlwifi - 4.14.167+2019-03-02-31d93860-1
kmod-nf-conntrack - 4.14.167-1
kmod-nf-conntrack6 - 4.14.167-1
kmod-nf-flow - 4.14.167-1
kmod-nf-ipt - 4.14.167-1
kmod-nf-ipt6 - 4.14.167-1
kmod-nf-nat - 4.14.167-1
kmod-nf-reject - 4.14.167-1
kmod-nf-reject6 - 4.14.167-1
kmod-ppp - 4.14.167-1
kmod-pppoe - 4.14.167-1
kmod-pppox - 4.14.167-1
kmod-slhc - 4.14.167-1
libblobmsg-json - 2020-01-20-43a103ff-1
libc - 1.1.24-2
libgcc1 - 7.5.0-2
libip4tc2 - 1.8.3-1
libip6tc2 - 1.8.3-1
libiwinfo-lua - 2019-10-16-07315b6f-1
libiwinfo20181126 - 2019-10-16-07315b6f-1
libjson-c2 - 0.12.1-3
libjson-script - 2020-01-20-43a103ff-1
liblua5.1.5 - 5.1.5-3
liblucihttp-lua - 2019-07-05-a34a17d5-1
liblucihttp0 - 2019-07-05-a34a17d5-1
libncurses6 - 6.1-5
libnl-tiny - 0.1-5
libpthread - 1.1.24-2
libubox20191228 - 2020-01-20-43a103ff-1
libubus-lua - 2019-12-27-041c9d1c-1
libubus20191227 - 2019-12-27-041c9d1c-1
libuci20130104 - 2019-09-01-415f9e48-3
libuclient20160123 - 2019-05-30-3b3e368d-1
libxtables12 - 1.8.3-1
logd - 2019-06-16-4df34a4d-3
lua - 5.1.5-3
luci - git-20.057.55219-13dd17f-1
luci-app-firewall - git-20.057.55219-13dd17f-1
luci-app-opkg - git-20.057.55219-13dd17f-1
luci-base - git-20.057.55219-13dd17f-1
luci-lib-ip - git-20.057.55219-13dd17f-1
luci-lib-jsonc - git-20.057.55219-13dd17f-1
luci-lib-nixio - git-20.057.55219-13dd17f-1
luci-mod-admin-full - git-20.057.55219-13dd17f-1
luci-mod-network - git-20.057.55219-13dd17f-1
luci-mod-status - git-20.057.55219-13dd17f-1
luci-mod-system - git-20.057.55219-13dd17f-1
luci-proto-ipv6 - git-20.057.55219-13dd17f-1
luci-proto-ppp - git-20.057.55219-13dd17f-1
luci-theme-bootstrap - git-20.057.55219-13dd17f-1
mtd - 24
muninlite - 1.0.4-10
mwlwifi-firmware-88w8864 - 2019-03-02-31d93860-1
netifd - 2019-08-05-5e02f944-1
odhcp6c - 2019-01-11-e199804b-16
odhcpd-ipv6only - 2019-12-16-e53fec89-3
openwrt-keyring - 2019-07-25-8080ef34-1
opkg - 2020-01-25-c09fe209-1
ppp - 2.4.7.git-2019-05-25-3
ppp-mod-pppoe - 2.4.7.git-2019-05-25-3
procd - 2020-01-24-31e4b2df-1
rpcd - 2019-11-10-77ad0de0-1
rpcd-mod-file - 2019-11-10-77ad0de0-1
rpcd-mod-iwinfo - 2019-11-10-77ad0de0-1
rpcd-mod-luci - 20191114
rpcd-mod-rrdns - 20170710
swconfig - 12
terminfo - 6.1-5
ubi-utils - 2.1.1-1
uboot-envtools - 2018.03-3
ubox - 2019-06-16-4df34a4d-3
ubus - 2019-12-27-041c9d1c-1
ubusd - 2019-12-27-041c9d1c-1
uci - 2019-09-01-415f9e48-3
uclient-fetch - 2019-05-30-3b3e368d-1
uhttpd - 2020-02-12-2ee323c0-1
urandom-seed - 1.0-1
urngd - 2020-01-21-c7f7b6b6-1
usign - 2019-08-06-5a52b379-1
wireless-regdb - 2019.06.03
wpad-basic - 2019-08-08-ca8c2bd2-2
xinetd - 2.3.15-5
So here my questions:
Where does this topic belongs in the forum?
Could someone give me some hint about how to get some more info about who is leaking my router's memory?
Thanks for reading till here!
hnyman
February 28, 2020, 7:11pm
2
Not at the "site feedback" section as your question has no relation to the forum.
htop can be GUI configured to show also the kernel threads.
1 Like
Hi hnyman, thank you for moving.
I tried to do a ps aux but I get a "Wide output" result (I tried adding "w" to the arguments and also "ww" without success).
You might try reconciling memory leak fix-ups from the master git logs (main / packages...), against what you are running, to see if any have not been tagged for 19.x.
Before jumping to a conclusion, can you post the output of “free” as well as a screenshot of “top” (mostly interested in the header)?
What led you to believe that there is a memory leak?
root@OpenWrt:~# free
              total        used        free      shared  buff/cache   available
Mem:         511952      148452      354340         316        9160      335504
Swap:             0           0           0
and
 Mem: 156492K used, 355460K free, 316K shrd, 2224K buff, 6932K cached
 CPU:   0% usr   0% sys   0% nic  90% idle   0% io   0% irq  10% sirq
 Load average: 0.19 0.12 0.03 1/66 2843
   PID  PPID USER     STAT   VSZ %VSZ %CPU COMMAND
  2644     1 root     S     1700   0%   0% /usr/sbin/hostapd -s -P /var/run/wifi-phy1.pid -B /var/run/hostapd-phy1.conf
  2664     1 root     S     1700   0%   0% /usr/sbin/hostapd -s -P /var/run/wifi-phy0.pid -B /var/run/hostapd-phy0.conf
  2745  2271 root     S      900   0%   0% /usr/sbin/dropbear -F -P /var/run/dropbear.1.pid -p 192.168.0.2:22 -p fdd3:fee7:5b46::1:22 -K 300 -T 3
   937     1 root     R      808   0%   0% /sbin/urngd
  1384     1 root     S     1960   0%   0% /sbin/rpcd -s /var/run/ubus.sock -t 30
  1530     1 root     S     1484   0%   0% /sbin/netifd
     1     0 root     S     1356   0%   0% /sbin/procd
  1569     1 root     S     1244   0%   0% /usr/sbin/odhcpd
  2643     1 dnsmasq  S     1172   0%   0% /usr/sbin/dnsmasq -C /var/etc/dnsmasq.conf.cfg01411c -k -x /var/run/dnsmasq/dnsmasq.cfg01411c.pid
  1630     1 root     S     1144   0%   0% /usr/sbin/uhttpd -f -h /www -r OpenWrt -x /cgi-bin -t 60 -T 30 -k 20 -A 1 -n 3 -N 100 -R -p 0.0.0.0:80 -p [::]:80
  2915  2746 root     R     1088   0%   0% top
  2746  2745 root     S     1080   0%   0% -ash
  2080     1 root     S<    1076   0%   0% /usr/sbin/ntpd -n -N -S /usr/sbin/ntpd-hotplug -p 0.openwrt.pool.ntp.org -p 1.openwrt.pool.ntp.org -p 2.openwrt.pool.ntp.org -p 3
  1596     1 root     S     1076   0%   0% /usr/sbin/crond -f -c /etc/crontabs -l 5
  1799  1530 root     S     1072   0%   0% udhcpc -p /var/run/udhcpc-eth1.2.pid -s /lib/netifd/dhcp.script -f -t 0 -i eth1.2 -x hostname:OpenWrt -C -O 121
  1359     1 root     S     1028   0%   0% /sbin/logd -S 64
   919     1 root     S     1008   0%   0% /sbin/ubusd
  2271     1 root     S      836   0%   0% /usr/sbin/dropbear -F -P /var/run/dropbear.1.pid -p 192.168.0.2:22 -p fdd3:fee7:5b46::1:22 -K 300 -T 3
  1639     1 root     S      828   0%   0% /usr/sbin/xinetd -pidfile /var/run/xinetd.pid
   920     1 root     S      696   0%   0% /sbin/askfirst /usr/libexec/login.sh
     7     2 root     SW       0   0%   0% [ksoftirqd/0]
   535     2 root     IW       0   0%   0% [kworker/0:1]
The result after the free memory reaches 0 is that the router stops reacting to new connections (before that I lose access via the web interface / ssh). The whole memory is leaked in about 3-4 hours but even when it is close to run OOM "top/htop" are not showing any process/kernel thread consuming more than 1% of memory.
Just want to double-check against other rumored memory leaks
Could you please confirm or deny whether you use any form of PPP, flow offloading in 19.07, or ipsets?
No that I'm aware of, I mean, if it's not activated by default, no.
No flow offloading or ipsets AFAIK.
If you have any suggestions about how to find out who is leaking the memory I'm happy to dig into that.@anomeome suggested but until tomorrow I won't have time to do that.
Fair enough. To use top to read memory usage you need a full version of it, not the busybox installed by default. htop can display kernel threads (hidden by default): hit F2 and go to Display Options . Then while htop is running, clink on VIRT , RES , and SHR in the header to sort by memory.
I had already disabled hidding of kernel threads, same result.
  1  [||||||||||||||||||||||||                                              31.3%]   Tasks: 20, 0 thr, 47 kthr; 1 running
  2  [                                                                       0.0%]   Load average: 0.22 0.29 0.19
  Mem[||||||||||||||||||                                               94.8M/500M]   Uptime: 00:31:01
  Swp[                                                                      0K/0K]

  PID USER      PRI  NI  VIRT   RES   SHR S CPU% MEM%   TIME+  Command
 1384 root       20   0  1960  1016   812 S  0.0  0.2  0:00.23 /sbin/rpcd -s /var/run/ubus.sock -t 30
 2785 root       20   0  1756  1516   800 R  0.0  0.3  0:00.15 htop
 2642 root       20   0  1700   124     0 S  0.0  0.0  0:01.39 /usr/sbin/hostapd -s -P /var/run/wifi-phy0.pid -B /var/run/hostapd-phy0.conf
 2622 root       20   0  1700   120     0 S  0.7  0.0  0:03.85 /usr/sbin/hostapd -s -P /var/run/wifi-phy1.pid -B /var/run/hostapd-phy1.conf
 1530 root       20   0  1484   904   756 S  0.0  0.2  0:00.20 /sbin/netifd
    1 root       20   0  1356   788   648 S  0.0  0.2  0:01.50 /sbin/procd
 1560 root       20   0  1244   672   632 S  0.0  0.1  0:00.05 /usr/sbin/odhcpd
 2619 dnsmasq    20   0  1176   816   720 S  0.0  0.2  0:00.40 /usr/sbin/dnsmasq -C /var/etc/dnsmasq.conf.cfg01411c -k -x /var/run/dnsmasq/dnsmasq.cfg01411c.pid
 1629 root       20   0  1120   712   608 S  0.0  0.1  0:00.02 /usr/sbin/uhttpd -f -h /www -r OpenWrt -x /cgi-bin -t 60 -T 30 -k 20 -A 1 -n 3 -N 100 -R -p 0.0.0.0:80 -p [:
 2777 root       20   0  1080   516   492 S  0.0  0.1  0:00.00 -ash
 1593 root       20   0  1076   760   720 S  0.0  0.1  0:00.00 /usr/sbin/crond -f -c /etc/crontabs -l 5
 1985 root        5 -15  1076   516   492 S  0.0  0.1  0:00.01 /usr/sbin/ntpd -n -N -S /usr/sbin/ntpd-hotplug -p 0.openwrt.pool.ntp.org -p 1.openwrt.pool.ntp.org -p 2.open
 1826 root       20   0  1072   516   492 S  0.0  0.1  0:00.10 udhcpc -p /var/run/udhcpc-eth1.2.pid -s /lib/netifd/dhcp.script -f -t 0 -i eth1.2 -x hostname:OpenWrt -C -O
 1359 root       20   0  1028   540   508 S  0.0  0.1  0:00.04 /sbin/logd -S 64
  919 root       20   0  1008   584   548 S  0.0  0.1  0:00.05 /sbin/ubusd
 2776 root       20   0   900    40     0 S  0.0  0.0  0:00.16 /usr/sbin/dropbear -F -P /var/run/dropbear.1.pid -p 192.168.0.2:22 -p fdd3:fee7:5b46::1:22 -K 300 -T 3
 2250 root       20   0   836   516   492 S  0.0  0.1  0:00.00 /usr/sbin/dropbear -F -P /var/run/dropbear.1.pid -p 192.168.0.2:22 -p fdd3:fee7:5b46::1:22 -K 300 -T 3
 1637 root       20   0   828    36     0 S  0.0  0.0  0:00.01 /usr/sbin/xinetd -pidfile /var/run/xinetd.pid
  937 root       20   0   808   512   480 S  0.7  0.1  0:03.52 /sbin/urngd
  920 root       20   0   696   456   428 S  0.0  0.1  0:00.01 /sbin/askfirst /usr/libexec/login.sh
    2 root       20   0     0     0     0 S  0.0  0.0  0:00.00 kthreadd
    3 root       20   0     0     0     0 I  0.0  0.0  0:00.04 kworker/0:0
    4 root        0 -20     0     0     0 I  0.0  0.0  0:00.00 kworker/0:0H
    5 root       20   0     0     0     0 I  0.0  0.0  0:00.11 kworker/u4:0
    6 root        0 -20     0     0     0 I  0.0  0.0  0:00.00 mm_percpu_wq
    7 root       20   0     0     0     0 S  0.0  0.0  0:01.99 ksoftirqd/0
    8 root       20   0     0     0     0 I  0.0  0.0  0:00.12 rcu_sched
    9 root       20   0     0     0     0 I  0.0  0.0  0:00.00 rcu_bh
   10 root       RT   0     0     0     0 S  0.0  0.0  0:00.00 migration/0
   11 root       20   0     0     0     0 S  0.0  0.0  0:00.00 cpuhp/0
   12 root       20   0     0     0     0 S  0.0  0.0  0:00.00 cpuhp/1
   13 root       RT   0     0     0     0 S  0.0  0.0  0:00.00 migration/1
F1Help  F2Setup F3SearchF4FilterF5Tree  F6SortByF7Nice -F8Nice +F9Kill  F10Quit
Here some entries from the kernel log, IDK if the entries MACREG_REG_INT_CODE: 0x0000 may point to the problem, or are just a sympthom of the router running OOM.
[ 1716.802783] ieee80211 phy0: Mac80211 start BA 28:37:37:21:98:a4
[ 1716.844489] ieee80211 phy0: Mac80211 start BA 28:37:37:21:98:a4
[ 1716.884486] ieee80211 phy0: Mac80211 start BA 28:37:37:21:98:a4
[ 1716.924487] ieee80211 phy0: Mac80211 start BA 28:37:37:21:98:a4
[ 1716.964483] ieee80211 phy0: Mac80211 start BA 28:37:37:21:98:a4
[ 1717.752850] ieee80211 phy0: Mac80211 start BA 28:37:37:21:98:a4
[ 1717.925461] ieee80211 phy0: Stop BA dc:a6:32:67:61:05
[ 1718.269732] ieee80211 phy1: MACREG_REG_INT_CODE: 0x0000
[ 1722.773207] ieee80211 phy0: Mac80211 start BA dc:a6:32:67:61:05
[ 1723.655463] ieee80211 phy0: Stop BA c8:28:32:2d:10:3f
[ 1740.248060] ieee80211 phy1: MACREG_REG_INT_CODE: 0x0000
[ 1745.364444] ieee80211 phy1: MACREG_REG_INT_CODE: 0x0000
[ 1745.377313] ieee80211 phy1: MACREG_REG_INT_CODE: 0x0000
[ 1772.712660] ieee80211 phy1: MACREG_REG_INT_CODE: 0x0000
[ 1809.745864] ieee80211 phy1: MACREG_REG_INT_CODE: 0x0000
[ 1846.649820] ieee80211 phy1: MACREG_REG_INT_CODE: 0x0000
[ 1865.631891] ieee80211 phy0: Mac80211 start BA a4:93:3f:e6:54:3d
[ 1867.985150] ieee80211 phy0: Stop BA dc:a6:32:67:61:05
[ 1872.459239] ieee80211 phy0: Mac80211 start BA dc:a6:32:67:61:05
[ 1873.185136] ieee80211 phy0: Stop BA a4:93:3f:e6:54:3d
[ 1885.288078] ieee80211 phy1: MACREG_REG_INT_CODE: 0x0000
[ 1932.862194] ieee80211 phy1: MACREG_REG_INT_CODE: 0x0000
[ 1942.795864] ieee80211 phy0: Mac80211 start BA dc:a6:32:67:61:05
[ 1943.744993] ieee80211 phy0: Stop BA 30:07:4d:96:7e:b1
[ 1972.838784] ieee80211 phy1: MACREG_REG_INT_CODE: 0x0000
[ 2006.884765] ieee80211 phy1: MACREG_REG_INT_CODE: 0x0000
[ 2057.344037] ieee80211 phy1: MACREG_REG_INT_CODE: 0x0000
You are gonna have to wait until the leak is bigger and see what is on top when you order by RES or SHR .
Will do, I've to leave now but tomorrow I'll post the result close to the OOM.
Yogi43
February 29, 2020, 3:11pm
13
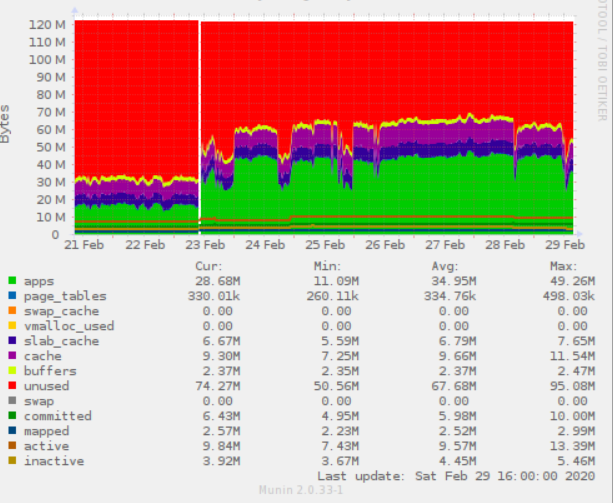
Maybe I'm facing the same in my Archer C7 v2 with 19.07.1 - as you can see in the Munin chart on 23. Feb I moved to 19.07.01. Also in the cases of high memory consumption I see no task in htop with more than 2%.
Info: On my TL-WR1043 v4 this chart ist almost flat.
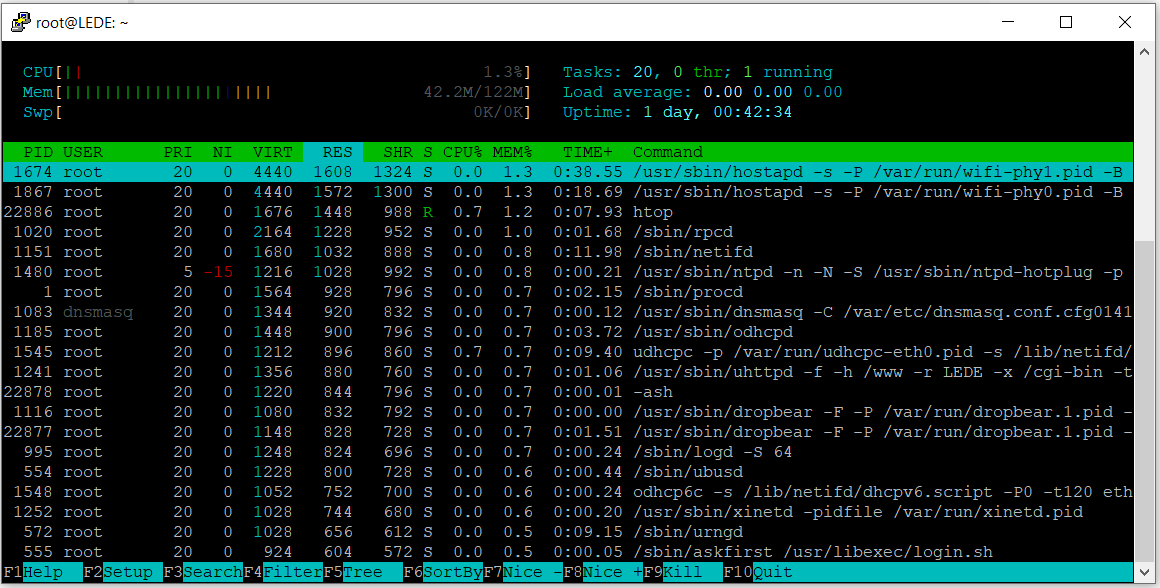
And here the htop output - in the past minutes the used memory has increased by 15 M - but no change in htop:
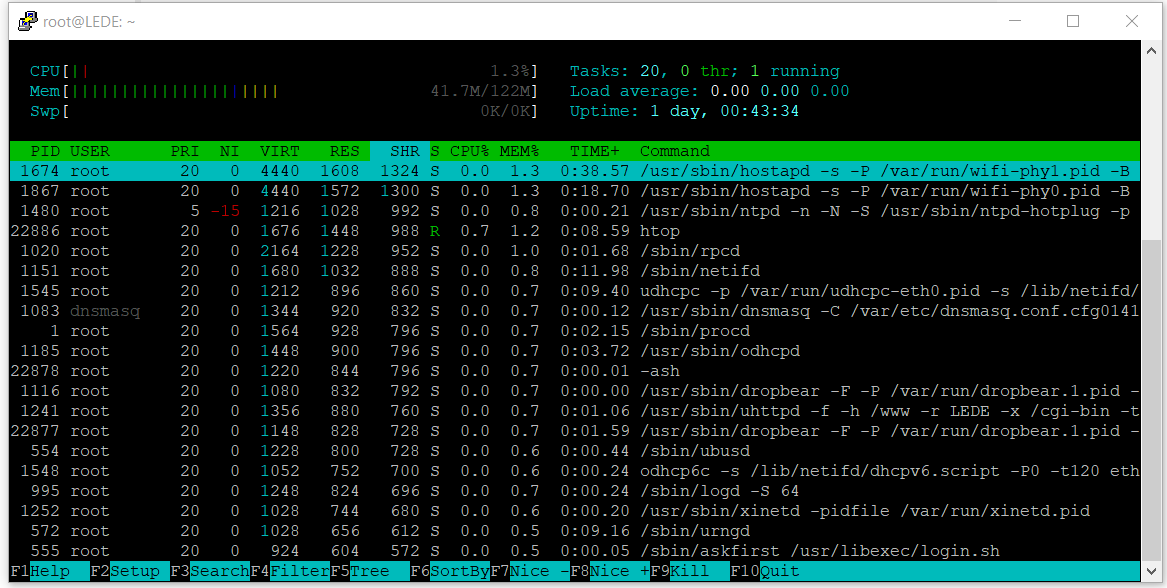
And sorted by SHR and RES:
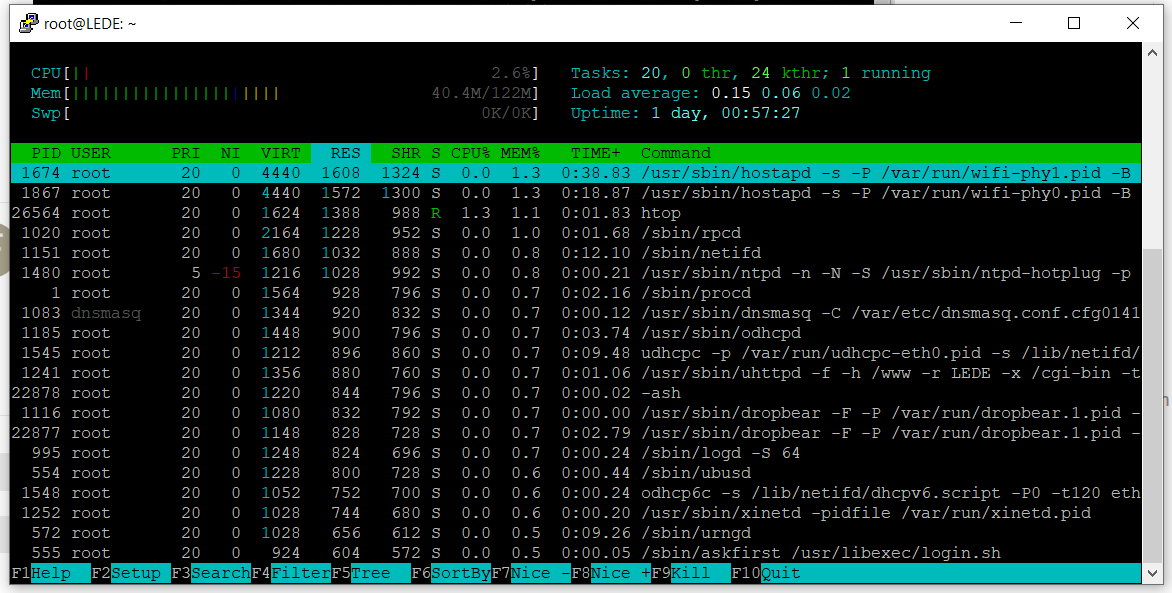
Afterwards I also added the kernel threads - no change
Enable kernel threads as per the instructions earlier in the thread
You are gonna have to wait until almost all memory is leaked to get a proper reading.
1 Like
Yogi43
February 29, 2020, 3:57pm
19
OK, I will just wait and send new images
Is option ieee80211w of the wireless config in play.