How to manually create an rrd file with rrdtool

I'm facing issues with some LuCI statistics (some broken graphs because missing related.rrd data). To workaround the issue (haven't found how to tweak what to plot or not for the nut plugin), I would like to create an empty rrd file with 30s sampling interval, and 1 dataset with the default settings of 2h average, 1d avg, 1w avg, 1mo avg, and 1y avg. I'm not sure about the time base for the high order averages, whether is supposed to be 1d or other period. Assuming 1d, I suppose the creation command it should be something like:

rrdtool create temperature-ups.rrd --step 30 \
  DS:temperature:GAUGE:7200:0:100 \
  RRA:AVERAGE:0.5:1:240 \
  RRA:AVERAGE:0.5:2:1440 \
  RRA:AVERAGE:0.5:2880:7 \
  RRA:AVERAGE:0.5:2880:30 \
  RRA:AVERAGE:0.5:2880:365

This generates a 17992B rrd database, while the other rrd's are 12856B of size. After refreshing, the statistics page still doesn't plot the data:

On the other hand, if I just make a copy of another database, the graph is correctly generated:

So how I should define this provisional rrd?

I did a bit of RRA and graphing config customization back when it was version 0.9 something, lol. Also I think I found scripts on my router a year or so ago that did the RRA/RRD creation so you could look around on your device.

There is some OpenWrt documentation. Try here and do some browsing/searching:

Be sure to refer to documentation specific to the RRDTool version on your system.

That linked doc page also shows how to create a graph image via command line. Try that on your custom RRD. Maybe the failure to show a graph is a luci or integration issue rather than an RRDTool issue.
For more info on RRDtool usage, check out the RRDTool site docs:
https://oss.oetiker.ch/rrdtool/doc/rrddump.en.html
The rrddump page I linked shows how to export the config and data from an RRD file. It could be used to glean info on the settings collectd uses and expects. You could als edit a dump to strip out unwanted data and you could set values you want to test with and import your edited file into a new rrd. Again, since there are different versions of RRD that differ quite a bit, look at the docs for the version you use.

I checked my router and it has rrdtool version 1.0.50.

1 Like

The broken statistics graphs of the 22.03.3 release is because a defective nut plugin logic. After some javascript improvement, it will be fixed for the upcoming snapshot.

Therefore my question now becomes academic. And in that sense, there are so many combinations of parameters for creating an rrd, so it's a matter of understanding how it's implemented in OpenWrt.

I already read the wiki you linked, but it didn't give me enough clues on how the statistics is expecting the rrd in order to be processed. On the other hand, another doc from the same author provided me more hints on how to specify the creation parameters, and in fact, after some guessing comparing collectd/rrdtool config with that doc, and guessing that a constant-resolution graphs would make more sense, I managed to create an rrd of the same size as expected (12856B):

rrdtool create temperature-ups.rrd --step 30 \
  DS:temperature:GAUGE:300:0:100 \
  RRA:AVERAGE:0.1:1:288 \
  RRA:AVERAGE:0.1:10:288 \
  RRA:AVERAGE:0.1:70:288 \
  RRA:AVERAGE:0.1:300:288 \
  RRA:AVERAGE:0.1:3650:288

It wasn't plotted by LuCI statistics, though, but at least it got me closer

FWIW: this is how collectd has configured rrdtool:

LoadPlugin rrdtool
<Plugin rrdtool>
	DataDir "/tmp/rrd"
	RRARows 288
	RRASingle true
	RRATimespan 7200
	RRATimespan 86400
	RRATimespan 604800
	RRATimespan 2678400
	RRATimespan 31622400
</Plugin>

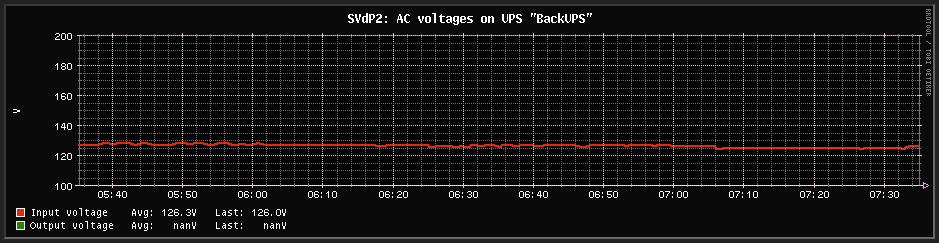
I hadn't paid attention to the dump option of rrdtool. That could help. This build is running rrdtool1 - 1.0.50-5, and I'm looking at the dump of the AC voltage, data source and the first rra:

<!-- Round Robin Database Dump -->
<rrd>
        <version> 0001 </version>
        <step> 30 </step> <!-- Seconds -->
        <lastupdate> 1680604961 </lastupdate> <!-- 2023-04-04 06:42:41 -04 -->

        <ds>
                <name> value </name>
                <type> GAUGE </type>
                <minimal_heartbeat> 60 </minimal_heartbeat>
                <min> NaN </min>
                <max> NaN </max>

                <!-- PDP Status -->
                <last_ds> UNKN </last_ds>
                <value> 1.3970000000e+03 </value>
                <unknown_sec> 0 </unknown_sec>
        </ds>

<!-- Round Robin Archives -->
        <rra>
                <cf> AVERAGE </cf>
                <pdp_per_row> 1 </pdp_per_row> <!-- 30 seconds -->
                <xff> 1.0000000000e-01 </xff>

                <cdp_prep>
                        <ds><value> NaN </value>  <unknown_datapoints> 0 </unknown_datapoints></ds>
                </cdp_prep>
                <database>
                        <!-- 2023-04-04 04:19:00 -04 / 1680596340 --> <row><v> 1.2736666667e+02 </v></row>
                       [and many other time/volt entries for this rra]

Some things are clear from the dump, others need more thinking.

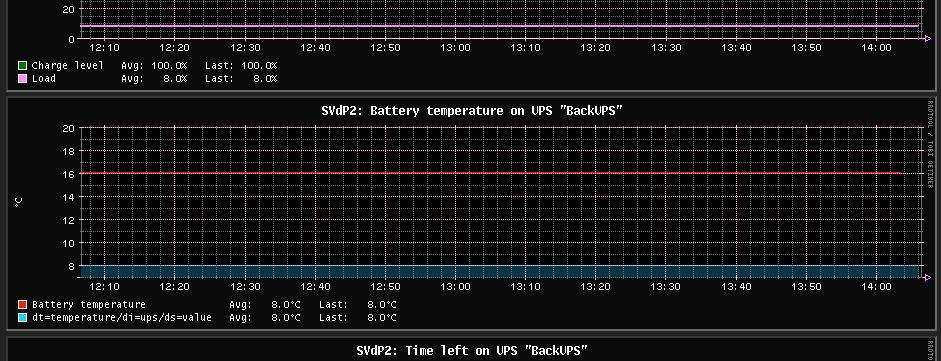
For comparison, here is the dump of the last rrd I've created:

<!-- Round Robin Database Dump -->
<rrd>
        <version> 0001 </version>
        <step> 30 </step> <!-- Seconds -->
        <lastupdate> 1680603679 </lastupdate> <!-- 2023-04-04 06:21:19 -04 -->

        <ds>
                <name> temperature </name>
                <type> GAUGE </type>
                <minimal_heartbeat> 60 </minimal_heartbeat>
                <min> 0.0000000000e+00 </min>
                <max> 1.0000000000e+02 </max>

                <!-- PDP Status -->
                <last_ds> UNKN </last_ds>
                <value> 0.0000000000e+00 </value>
                <unknown_sec> 19 </unknown_sec>
        </ds>

<!-- Round Robin Archives -->
        <rra>
                <cf> AVERAGE </cf>
                <pdp_per_row> 1 </pdp_per_row> <!-- 30 seconds -->
                <xff> 1.0000000000e-01 </xff>

                <cdp_prep>
                        <ds><value> NaN </value>  <unknown_datapoints> 0 </unknown_datapoints></ds>
                </cdp_prep>

EDIT:
NaN can be entered manually during the creation if the range is unknown, and the datasource seems to be named "value" for all the databases.

Ok, so the following can do the trick, if someone is using the default 2h, 1d, 1w, 1mo, 1y, and doesn't want to wait for the following snapshot or release:

rrdtool create voltage-output.rrd --step 30 \
  DS:value:GAUGE:60:NaN:NaN \
  RRA:AVERAGE:0.1:1:288 \
  RRA:AVERAGE:0.1:10:288 \
  RRA:AVERAGE:0.1:70:288 \
  RRA:AVERAGE:0.1:310:288 \
  RRA:AVERAGE:0.1:3660:288


Something similar can be done for the remaining databases nut plugin is expecting (in my case, my UPS was providing 5 of the 12 measurements grouped in 8 graphs).

For other scenarios, as spence suggested, rrdtool dump xyz.rrd |more can help.

EDIT: updated timespans.

1 Like

This topic was automatically closed 10 days after the last reply. New replies are no longer allowed.