I've got two Xiaomi AX3600 running latest OpenWrt snapshot. One of them has ~ 130 MB more RAM usage than the other. Okay, this one has some additional packages installed and running. But if I stop them, I only reclaim about 20 MB RAM back. Running "ps w" and "htop" doesn't give me a clue what is causing this. /tmp partition is filled with 7 MB at max.
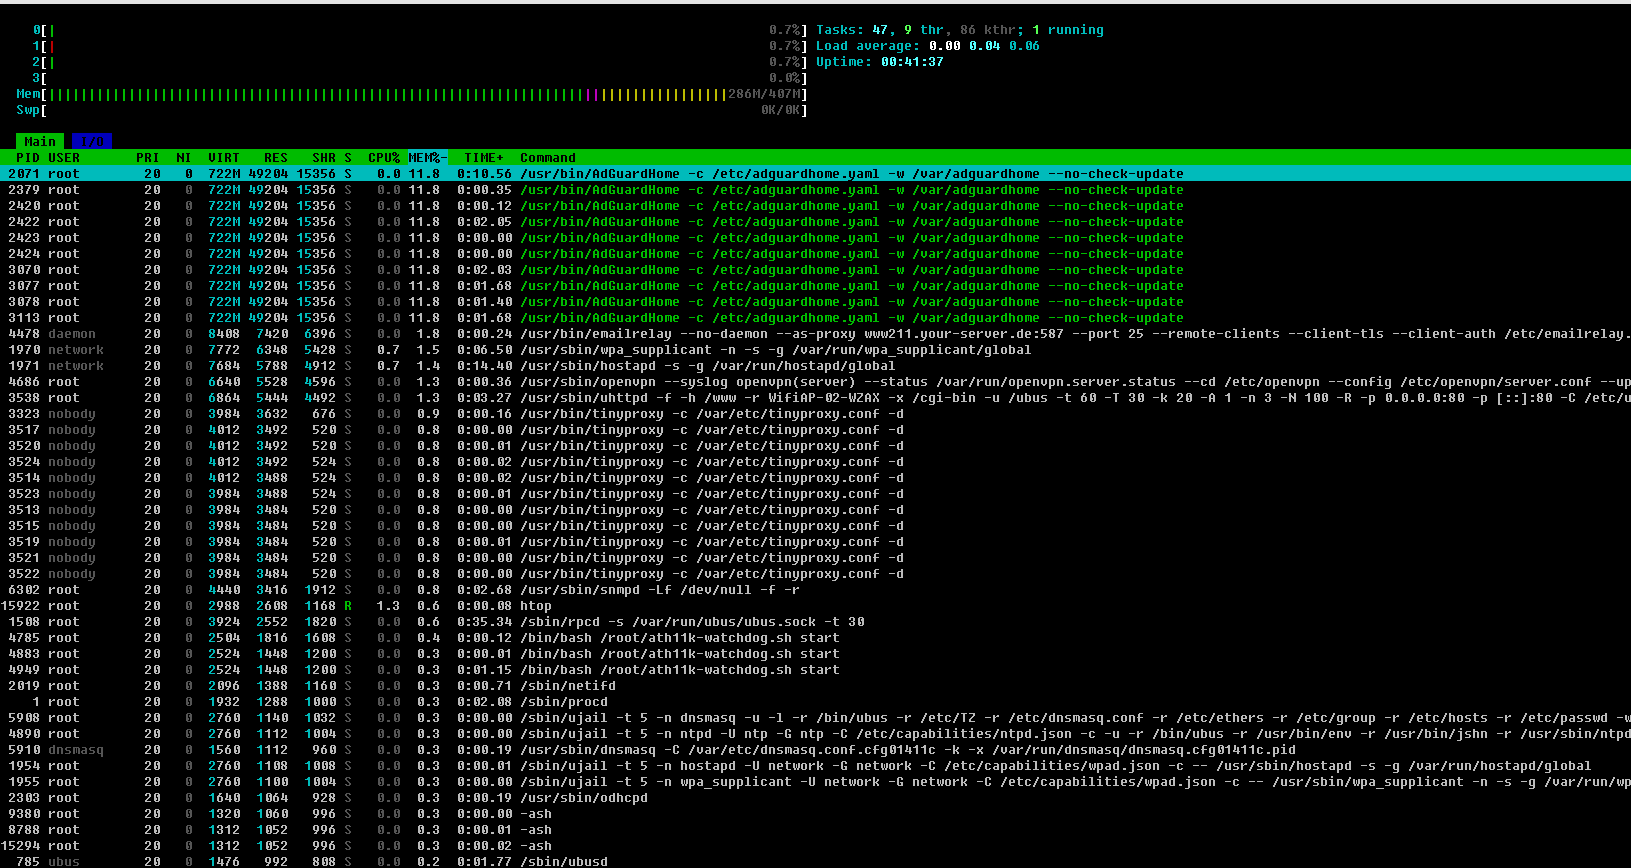
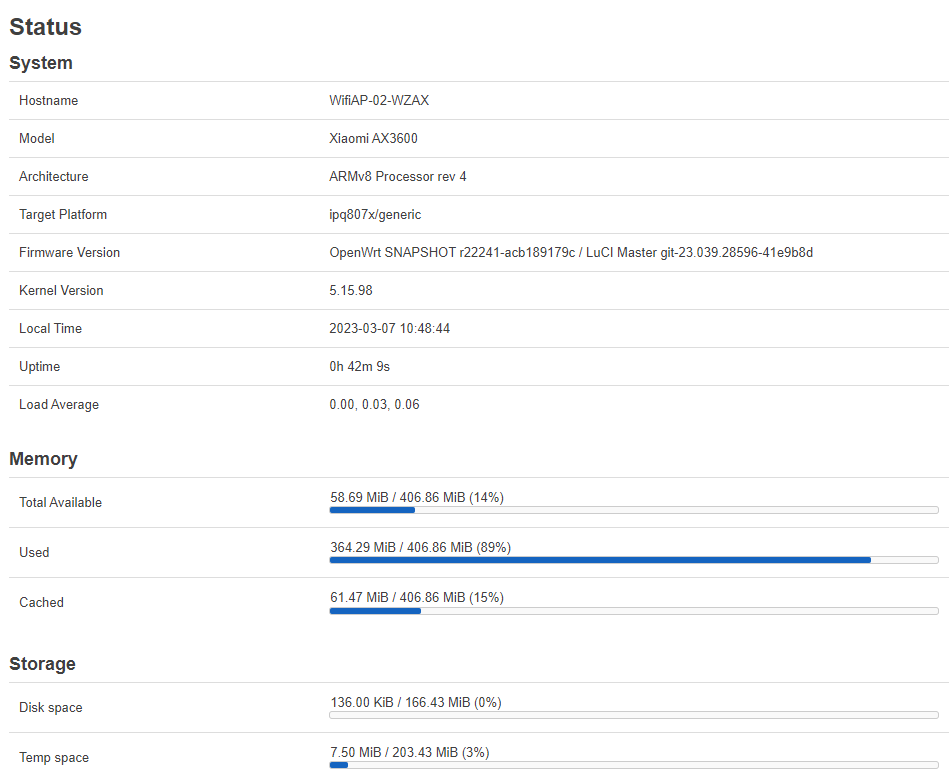
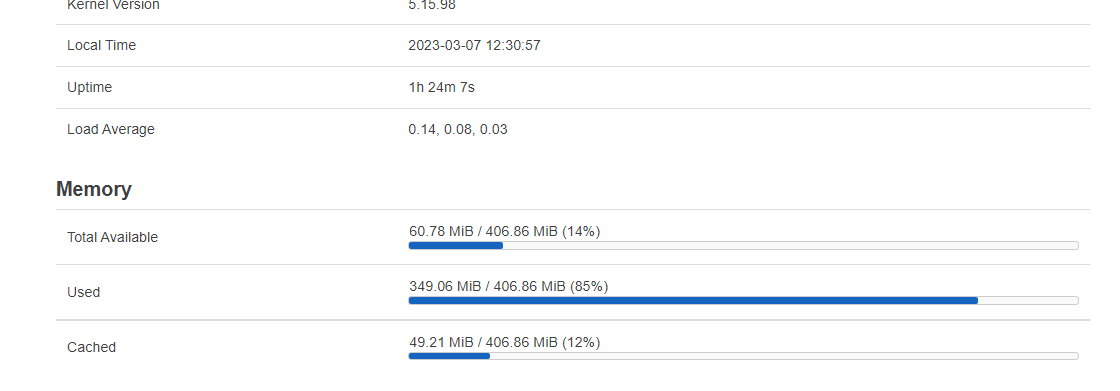
Here are screenshots of the device with low RAM free:
How can I diagnose what's causing the RAM usage on device 1? Stopping all services like adguardhome, tinyproxy, emailrelay, openvpn does only give RAM back so I have ~ 70 MB free.
Are there good commands for SSH to deep dive into this?
Also look at the size of /tmp/ (e.g. adblock and opkg). ath11k is very memory hungry, so the number of connected clients and what they're doing also plays a huge role (furthermore ath11k doesn't immediately release the RAM, so for comparisons better disable all wlan interfaces and reboot with them disabled).
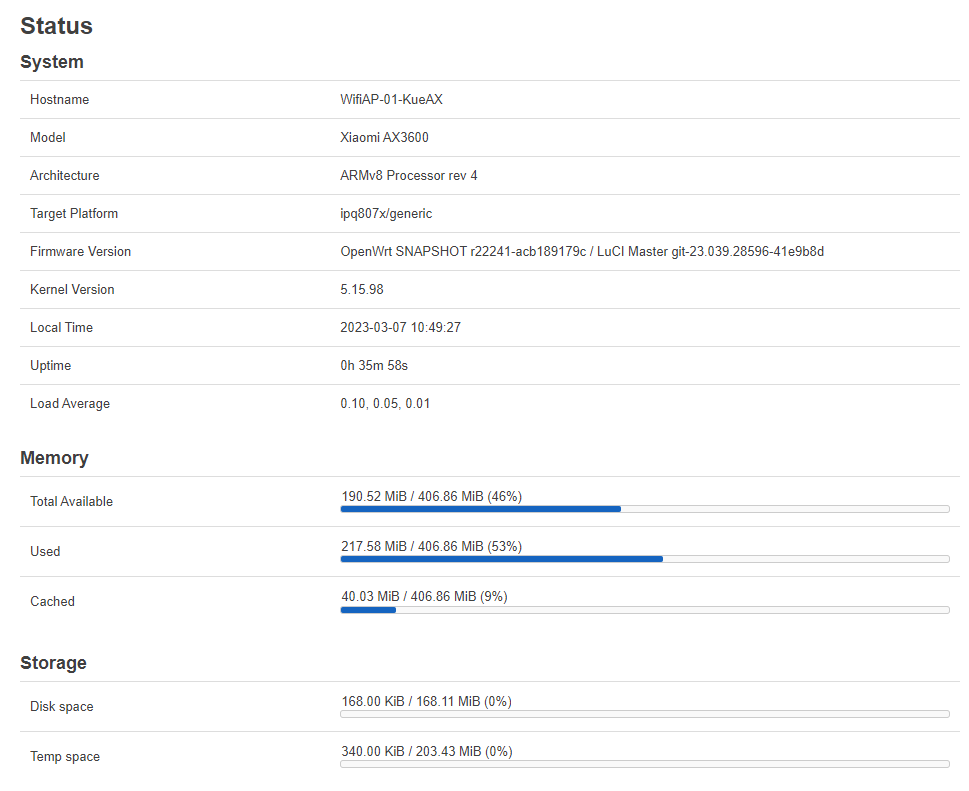
Great advice! Thanks. I've disabled adguardhome and the other packages temporarily and found out, the RAM consumption seems to correlate to the role of the device. The device with lower free RAM (and counting lower and lower) ist the NAT+gateway device of my network. (The other is just a dumb AP which has a lot of free RAM.)
I can reproduce the free RAM going down fast if I reboot with services disabled, connect via LAN cable (instead of ath11k driven WiFi SSID) and start a speed test (Waveform Test) to transfer a lot of data via NAT from/to the internet. This allocates about ~ 60 (64?) MB of RAM in the short time the test is running and then it seems not to be released.
Summary: Before speed test on NAT device: ~ 180 MB RAM free. After speed test: ~ 115 MB free.
So I guess this is normal behaviour of the NAT software or driver?
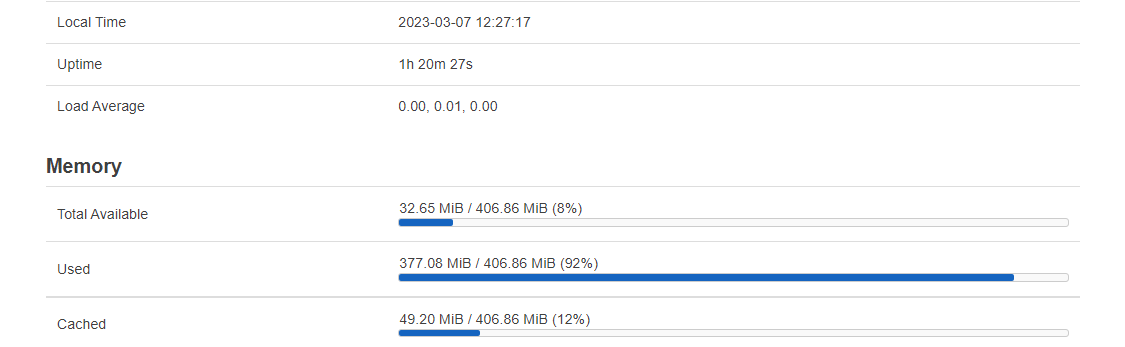
I don't know if this is not triggered by some bug like memory leak anywhere or if it's really normal behaviour. From 170 MB RAM free it dropped during the last 80 minutes to 33 MB RAM free.