I am struggling with the collecd-mod-exec plugin to add rrd data to luci-app-statistics.
What I would like to do, is to find out how to output a value from an arbitrary python skript in to luci-app-statistics graph.
I read that the user has to be setup correctly to execute the script so i have installed opkg install shadow and setup an user myusr that has execution rights on that file /home/myusr/script.py as described here.
I read that python print() by default writes to stdout, so the script could look like this to make it simple:
import time

timestamp = time.time()
value = '23.1'
sensor = '1'
print(f'PUTVAL {timestamp}, {sensor}:{value}')
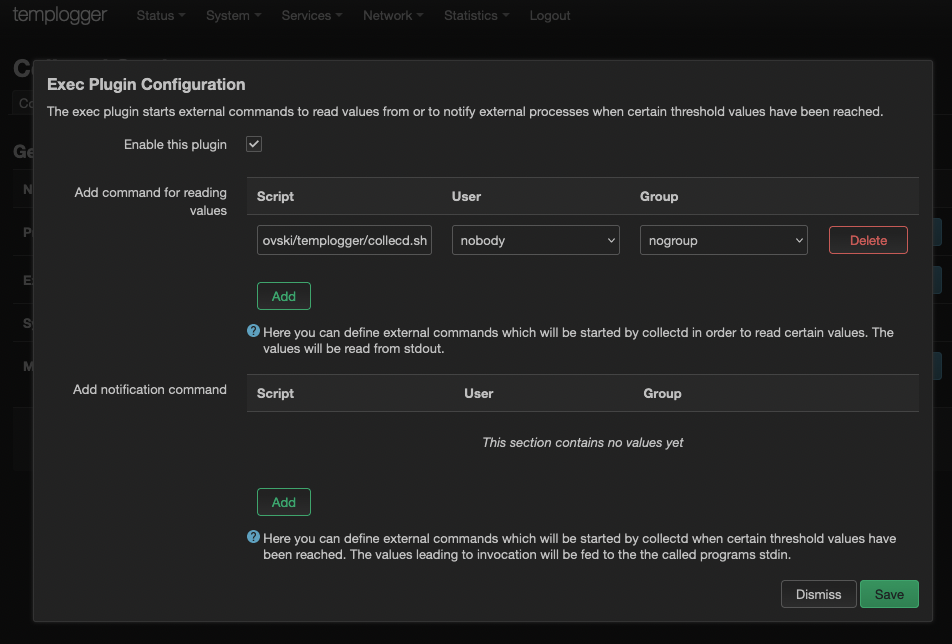
How do I have to configure collectd-mod-exec to take the time and value and add it to the graph?
usualy yes, but not for collectd-mod-exec as described in the doc's it says:
The security concerns are addressed by forcing the plugin to check that custom programs are never executed with superuser privileges. If the daemon runs as root, you have to configure another user ID with which the new process is created. To circumvent missing access privileges to files, you need to lean on the unix group concept. I.e. your script requires access to /var/log/messages, which is owned by root, its common practice to have this file being group readable by the admin-group. Given the used ID corrosponds to MyWatcherUser, you need to add that user to the admin group via /etc/group (or what else manages users / groups on your system).
That's why I did all that user stuff.
My question is how to address luci-app-statistics graph trough collectd-mod-exec.
Look for the SQM stats module for example.
It has config and the graph definition in the Luci stats, but the main SQM stats collection script is in collectd
I was able to find system log entries that said: daemon.err collectd[5408]: exec plugin: exec_read_one: error = exec plugin: Failed to execute ``/home/iart/templogger/collectd.sh'': Exec format error
And figured out that i had forgotten the entry of #!/bin/sh on the first line.
That let the error disappear.
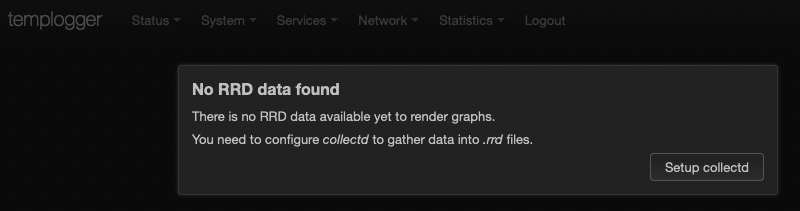
Still, i don't have a graph, and I am puzzled about how this system works.