My system load never (NEVER!) goes below 1.0 (single core CPU). Previously I was using LEDE and the load average used to be around 0.1 generally. My usage pattern has not changed.
How to troubleshoot this? I understand that the load average has no relation to CPU usage. How to know what is causing this load?
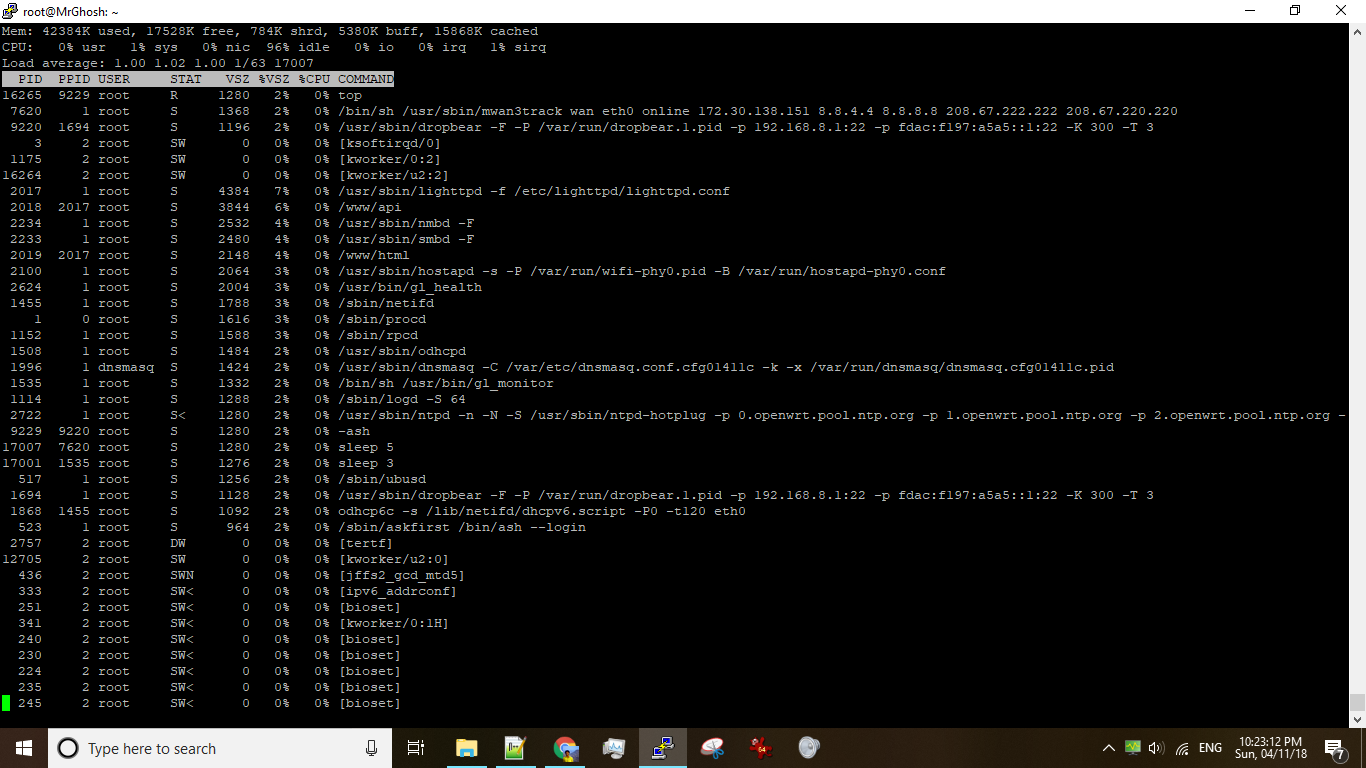
How to sort top results by CPU usage and Memory usage. This is busybox top and -O switch or SHIFT+m are not working.
I am using GL-AR150 router and their firmware version 3.0.5
Load is not only CPU dependent. It could also be a slow storage medium or other random IO.
You'll have to give us some more info about what target you're using and which packages are installed.
If you have a process that writes data to a storage medium it will also cause the LOAD indicators to rise, or when either you're looking at LuCI and have autorefresh on which causes network load.
Your best bet is probably to disable a bunch of processes(services) until the 1m LOAD indicator drops. More like try and error.
I've seen something similar on Linux system, which was caused by processes rapidly creating and dying. That would cause the loadavg to go high while the CPU usage is low because top didn't include the statistics of those dead process. htop could capture that and show you the exact process causing the problem.
Also, from the screenshot, it seems there are 2 new born sleep processes which were created by mwan3track and gl_monitor. See if you could stop one of them to see if the loadavg goes down.
I've had problems with mwan3 doing weird stuff. Try stopping it and see if it helps. If that fixes it then you can try to manually copy the newest version from git. There has been a lot of fixes and changes compared to the version in 18.06.1.
Thank you @jeff for your comment. OpenWRT forum didn't send any notification email about your reply. I thought that nobody replied. I got notified today about the new replies.
@rtauHow did you know which parent processes created the sleep processes? I don't have detailed knowledge. So, I want to learn.
@sammo Yes, I am using GL-inet AR-150. The current firmware is in the testing stage. There are quite a few optimization problems IMHO. And @Per Thank you for your comment but it was not a mwan3 issue in my case.
Solution:
GL-inet adds some of their own software on top of the OpenWRT for their admin panel. It loads a module after boot (/etc/rc.d/S99gl_tertf), named ter-traffic which had D (Uninterruptible sleep) process state in the top output. (You can see the process tertf in my top output screenshot on my question). However, the D flag raised my suspicion and I unloaded it: rmmod ter-traffic. The load eventually decreased to about 0.2. I was informed later, it is a traffic statistics module for each client. I don't have their source code, so, I don't know why the module was in D state and whether it would have affected my router performance; but I don't need to see client statistics. So, I have permanently removed the init.d script.
Thank you @lleachii. I will remember that. I edited my current post to include the info.
I wanted to know about 'how to troubleshoot load issues'. i.e., if there is any general way to find out which process is causing the load even when they are not using much CPU. And how to sort the busybox top output. Thus, I omitted the custom firmware part.