Help me figure out why I have gaming latency

So you've got cake-autorate running now. But my idea here is not so much for you to use cake-autorate, but more to use cake-autorate's network monitoring capability to see what went on in your network during times in your game where you encounter lag.

So I would actually set cake fixed to say 15 Mbit/s download and 10 Mbit/s upload and disable cake-autorate changes using:

adjust_dl_shaper_rate=0 # enable (1) or disable (0) actually changing the dl shaper rate
adjust_ul_shaper_rate=0 # enable (1) or disable (0) actually changing the ul shaper rate

Then log out to USB using:

log_to_file=1             # enable (1) or disable (0) output logging to file (/tmp/cake-autorate.log)
log_file_path=/mnt/usb   # log file path
log_file_max_time_mins=120 # maximum time between log file rotations
log_file_max_size_KB=20000 # maximum KB (i.e. bytes/1024) worth of log lines between log file rotations

Then play your game, and write down the times where you experienced lag.

And we see what the ICMPs to the relevant reflectors were at the time you encountered the lag.

So that leaves choosing the right reflectors and setting using:

reflectors=("1.1.1.1" "1.0.0.1" "8.8.8.8" "8.8.4.4" "gamerz_lolz.com" "EA-gaming-server.com")

I would try to get this up and running in the background. Make sure:

  • the cake settings are being held at the correct values using 'tc qdisc ls'
  • the logging is working to usb using 'tail -f /mnt/usb/cake-autorate.log'

Then play your game and write down exact times when you see lag. Then we look at the plots of RTT to the different reflectors including game servers and see if there is indeed lag to those servers at the times you encountered game lag.

Make sense?

1 Like

With autorate running these are only the starting points, and autorate will take over and change these (for the running cake instances, autorate will NOT change the values in /etc/config/sqm).

Can you give me an example for each of your suggested settings?
I don't understand where to insert the values nor to stop autorate, I have to put a translator and I'm afraid I don't understand for these reasons... it seems logical and sensible for you but not for me... sorry

Something like this:

  • setup USB stick in OpenWrt on your router around say 10-20GB

  • set CAKE rates to 15 Mbit/s download and 10 Mbit/s upload

  • set cake-autorate ONLY FOR MONITORING with config file like:

#!/bin/bash

# cake-autorate automatically adjusts bandwidth for CAKE in dependence on detected load and RTT

# cake-autorate_config.sh is a script that sets up defaults for cake-autorate

# Author: @Lynx (OpenWrt forum)
# Inspiration taken from: @moeller0 (OpenWrt forum)

cake_autorate_version="1.1.0"

# *** OUTPUT AND LOGGING OPTIONS ***

output_processing_stats=1 # enable (1) or disable (0) output monitoring lines showing processing stats
output_load_stats=1       # enable (1) or disable (0) output monitoring lines showing achieved loads
output_cake_changes=0     # enable (1) or disable (0) output monitoring lines showing cake bandwidth changes
debug=1 		  # enable (1) or disable (0) out of debug lines

# ** Take care with these settings to ensure you won't run into OOM issues on your router ***
# every write the cumulative write time and bytes associated with each log line are checked
# and if either exceeds the configured values below, the log log file is rotated
log_to_file=1               # enable (1) or disable (0) output logging to file (/tmp/cake-autorate.log)
log_file_path=/mnt/usb      # log file path
log_file_max_time_mins=120  # maximum time between log file rotations
log_file_max_size_KB=5000000 # maximum KB (i.e. bytes/1024) worth of log lines between log file rotations

# *** STANDARD CONFIGURATION OPTIONS ***

dl_if=ifb4wan # download interface
ul_if=wan     # upload interface

# pinger selection can be any of:
# fping - round robin pinging (rtts)
# ping - (iputils-ping) individual pinging (rtts)
# hping3 - individidual pinging (owds)
pinger_binary=fping

reflector_ping_interval_s=0.2 # (seconds, e.g. 0.2s or 2s)

# list of reflectors to use and number of pingers to initiate
# pingers will be initiated with reflectors in the order specified in the list 
# additional reflectors will be used to replace any reflectors that go stale
# so e.g. if 6 reflectors are specified and the number of pingers is set to 4, the first 4 reflectors will be used initially
# and the remaining 2 reflectors in the list will be used in the event any of the first 4 go bad
# a bad reflector will go to the back of the queue on reflector rotation
reflectors=("1.1.1.1" "1.0.0.1" "8.8.8.8" "8.8.4.4" "9.9.9.9" "9.9.9.10")
no_pingers=4

# delay threshold in ms is the extent of OWD increase to classify as a delay
# these are automatically adjusted based on maximum on the wire packet size
# (adjustment significant at sub 12Mbit/s rates, else negligible)  
dl_delay_thr_ms=5 # (milliseconds)
ul_delay_thr_ms=5 # (milliseconds)

# Set either of the below to 0 to adjust one direction only 
# or alternatively set both to 0 to simply use cake-autorate to monitor a connection
adjust_dl_shaper_rate=0 # enable (1) or disable (0) actually changing the dl shaper rate
adjust_ul_shaper_rate=0 # enable (1) or disable (0) actually changing the ul shaper rate

min_dl_shaper_rate_kbps=5000  # minimum bandwidth for download (Kbit/s)
base_dl_shaper_rate_kbps=20000 # steady state bandwidth for download (Kbit/s)
max_dl_shaper_rate_kbps=80000  # maximum bandwidth for download (Kbit/s)

min_ul_shaper_rate_kbps=5000  # minimum bandwidth for upload (Kbit/s)
base_ul_shaper_rate_kbps=20000 # steady state bandwidth for upload (KBit/s)
max_ul_shaper_rate_kbps=35000  # maximum bandwidth for upload (Kbit/s)

# sleep functionality saves unecessary pings and CPU cycles by
# pausing all active pingers when connection is not in active use
enable_sleep_function=1 # enable (1) or disable (0) sleep functonality 
connection_active_thr_kbps=250 # threshold in Kbit/s below which dl/ul is considered idle
sustained_idle_sleep_thr_s=600  # time threshold to put pingers to sleep on sustained dl/ul achieved rate < idle_thr (seconds)

startup_wait_s=0 # number of seconds to wait on startup (e.g. to wait for things to settle on router reboot)

# *** ADVANCED CONFIGURATION OPTIONS ***

# cake-autorate facilitates triggering an export of the log file either within or outside cake-autorate
# namely, to trigger a log file export:
# send a USR1 or USR2 signal to $maintain_log_file_pid: "kill -USR1 $maintain_log_file_pid"
# $maintain_log_file_pid can be read from /var/run/cake-autorate/maintain_log_file_pid
# a USR1 signal will trigger an export to path: /var/log/cake-autorate_$datetime.log
# a USR2 signal will trigger an export to the path set in $log_file_export_alternative_path below
# in either case both the current .log and previously rotated .log.old (if it exists) will be exported
log_file_export_alternative_path="/var/log/cake-autorate_export.log"
log_file_export_compress=1 # compress the exported log file with its default/override path using gzip and append .gz to export filename

# extra arguments for ping
# e.g., when using mwan3, set up the correct outgoing interface and the firewall mark
# ping_extra_args=(-I wwan0 -m $((0x300)))
ping_extra_args=()

# interval in ms for monitoring achieved rx/tx rates
# this is automatically adjusted based on maximum on the wire packet size
# (adjustment significant at sub 12Mbit/s rates, else negligible)  
monitor_achieved_rates_interval_ms=200 # (milliseconds) 

# bufferbloat is detected when (bufferbloat_detection_thr) samples
# out of the last (bufferbloat detection window) samples are delayed
bufferbloat_detection_window=4  # number of samples to retain in detection window
bufferbloat_detection_thr=2      # number of delayed samples for bufferbloat detection

# RTT baseline against which to measure delays
# the idea is that the baseline is allowed to increase slowly to allow for path changes
# and slowly enough such that bufferbloat will be corrected well before the baseline increases,
# but it will decrease very rapidly to ensure delays are measured against the shortest path
alpha_baseline_increase=0.001 # how rapidly baseline RTT is allowed to increase
alpha_baseline_decrease=0.9   # how rapidly baseline RTT is allowed to decrease

# rate adjustment parameters 
# bufferbloat adjustment works with the lower of the adjusted achieved rate and adjusted shaper rate
# to exploit that transfer rates during bufferbloat provide an indication of line capacity
# otherwise shaper rate is adjusted up on load high, and down on load idle or low
# and held the same on load medium
achieved_rate_adjust_down_bufferbloat=0.9 # how rapidly to reduce achieved rate upon detection of bufferbloat 
shaper_rate_adjust_down_bufferbloat=0.9   # how rapidly to reduce shaper rate upon detection of bufferbloat 
shaper_rate_adjust_up_load_high=1.01      # how rapidly to increase shaper rate upon high load detected 
shaper_rate_adjust_down_load_low=0.9      # how rapidly to return down to base shaper rate upon idle or low load detected 
shaper_rate_adjust_up_load_low=1.01       # how rapidly to return up to base shaper rate upon idle or low load detected 

# the load is categoried as low if < medium_load_thr, medium if > medium_load_thr and high if > high_load_thr relative to the current shaper rate
medium_load_thr=0.75 # % of currently set bandwidth for detecting medium load
high_load_thr=0.75   # % of currently set bandwidth for detecting high load

# refractory periods between successive bufferbloat/decay rate changes
# the bufferbloat refractory period should be greater than the 
# average time it would take to replace the bufferbloat
# detection window with new samples upon a bufferbloat event
bufferbloat_refractory_period_ms=300 # (milliseconds)
decay_refractory_period_ms=1000 # (milliseconds)

# interval for checking reflector health
reflector_health_check_interval_s=1 # (seconds)
# deadline for reflector response not to be classified as an offence against reflector
reflector_response_deadline_s=1 # (seconds)

# reflector misbehaving is detected when $reflector_misbehaving_detection_thr samples
# out of the last (reflector misbehaving detection window) samples are offences
# thus with a 1s interval, window 60 and detection_thr 3, this is tantamount to
# 3 offences within the last 60s 
reflector_misbehaving_detection_window=60
reflector_misbehaving_detection_thr=3

# stall is detected when the following two conditions are met:
# 1) no reflector responses within $stall_detection_thr*$ping_response_interval_us; and
# 2) either $rx_achieved_rate or $tx_achieved_rate < $connection_stall_thr
stall_detection_thr=5
connection_stall_thr_kbps=10

global_ping_response_timeout_s=10 # timeout to set shaper rates to min on no ping response whatsoever (seconds)

if_up_check_interval_s=10 # time to wait before re-checking if rx/tx bytes files exist (e.g. from boot state)

# Starlink satellite switch (sss) compensation options
sss_compensation=0 # enable (1) or disable (0) Starlink handling
# satellite switch compensation start times in seconds of each minute
sss_times_s=("12.0" "27.0" "42.0" "57.0")
sss_compensation_pre_duration_ms=300
sss_compensation_post_duration_ms=200

# verify these are correct using 'cat /sys/class/...'
case "${dl_if}" in
    \veth*)
        rx_bytes_path="/sys/class/net/${dl_if}/statistics/tx_bytes"
        ;;
    \ifb*)
        rx_bytes_path="/sys/class/net/${dl_if}/statistics/tx_bytes"
        ;;
    *)
        rx_bytes_path="/sys/class/net/${dl_if}/statistics/tx_bytes"
        ;;
esac

case "${ul_if}" in
    \veth*)
        tx_bytes_path="/sys/class/net/${ul_if}/statistics/rx_bytes"
        ;;
    \ifb*)
        tx_bytes_path="/sys/class/net/${ul_if}/statistics/rx_bytes"
        ;;
    *)
        tx_bytes_path="/sys/class/net/${ul_if}/statistics/tx_bytes"
        ;;
esac

config_file_check="cake-autorate"
  • you need to change the lines:
reflectors=("1.1.1.1" "1.0.0.1" "8.8.8.8" "8.8.4.4" "9.9.9.9" "9.9.9.10")
no_pingers=4

to something like:

reflectors=("1.1.1.1" "1.0.0.1" "8.8.8.8" "XX" "YY" "ZZ")
no_pingers=6

where XX, YY, ZZ are your game servers or something close to it.

  • now verify that CAKE rates are correct by outputting 'tc qdisc ls' to check that the CAKE rates are 15 Mbit/s download and 10 Mbit/s upload

  • now verify logging to USB is working using 'tail -f /mnt/usb/cake-autorate.log'

  • now play your game and wait for lag

  • record times when lag occurs, e.g. 14:14 and 14:32

  • now copy log file using 'cp /mnt/usb/cake-autorate.log /tmp/X' and then get log file onto your computer

  • then check log file at times 14:14 and 14:32 to see what happened at the times you experienced lag

  • so you will see lines like this:

DATA; 2022-11-05-17:09:22; 1667668162.568659; 1667668162.568142; 17062; 160; 94; 2; 1667668162.551110; 8.8.4.4; 13045; 18410; 22700; 4293; 13194; 18410; 22700; 4293; 14497; 0; 0; dl_high; ul_idle; 18329; 6377
DATA; 2022-11-05-17:09:22; 1667668162.607305; 1667668162.606921; 17062; 160; 93; 2; 1667668162.586900; 1.1.1.1; 13046; 14909; 15500; 591; 13187; 14909; 15500; 591; 14497; 0; 0; dl_high; ul_idle; 18512; 6377
DATA; 2022-11-05-17:09:22; 1667668162.667493; 1667668162.667117; 17062; 160; 92; 2; 1667668162.647390; 1.0.0.1; 13046; 15059; 19400; 4344; 13181; 15059; 19400; 4344; 14497; 0; 0; dl_high; ul_idle; 18697; 6377
DATA; 2022-11-05-17:09:22; 1667668162.723769; 1667668162.723242; 17062; 160; 91; 2; 1667668162.701780; 8.8.8.8; 13046; 18258; 21550; 3294; 13174; 18258; 21550; 3294; 14497; 0; 0; dl_high; ul_idle; 18883; 6377

We can do things like:

  • plot RTT to different servers ("1.1.1.1" "1.0.0.1" "8.8.8.8" "XX" "YY" "ZZ") over very large time period

  • look at times that you experienced lag in game to see if there are corresponding RTT spikes when you experienced your game lag

This way we use 'cake-autorate' like a flight recorder on an airplane. It is always running in the background and you can use it to diagnose problems in the network over time periods of interest. It will show whether there are lag spikes throughout the day and in particular whether there are RTT spikes to the serves you game on.

@moeller0 does this recipe make sense? Any changes?

1 Like

I see a feature request here, where the plotting function can take time of day start and end indices and translates them into its internal indices... sounds useful for post hoc debugging, no ETA though on when I might actually implement that...

1 Like

Thanks for your explanations, I will try to put it into practice.
I want to specify that my latency is not sporadic ... it is permanent, it is perhaps not necessary to make a recording to detect that? If I had fluidity and that suddenly I had a lag yes you are right, it would be necessary to record that...
but I repeat my latency my heaviness no reactivity is a permanent phenomenon!

Note : Having responsiveness and fluidity is a phenomenon that happens 3 times a year and lasts 15 minutes

Is it because there are 3 server maintenance? Or 3 server swaps in a year on the network? I don't know but it could be an idea !

Well please upload to this thread your cake-autorate log for the last few hours whilst playing the game and indicate times you experienced lag. I'd like to see how that looks.

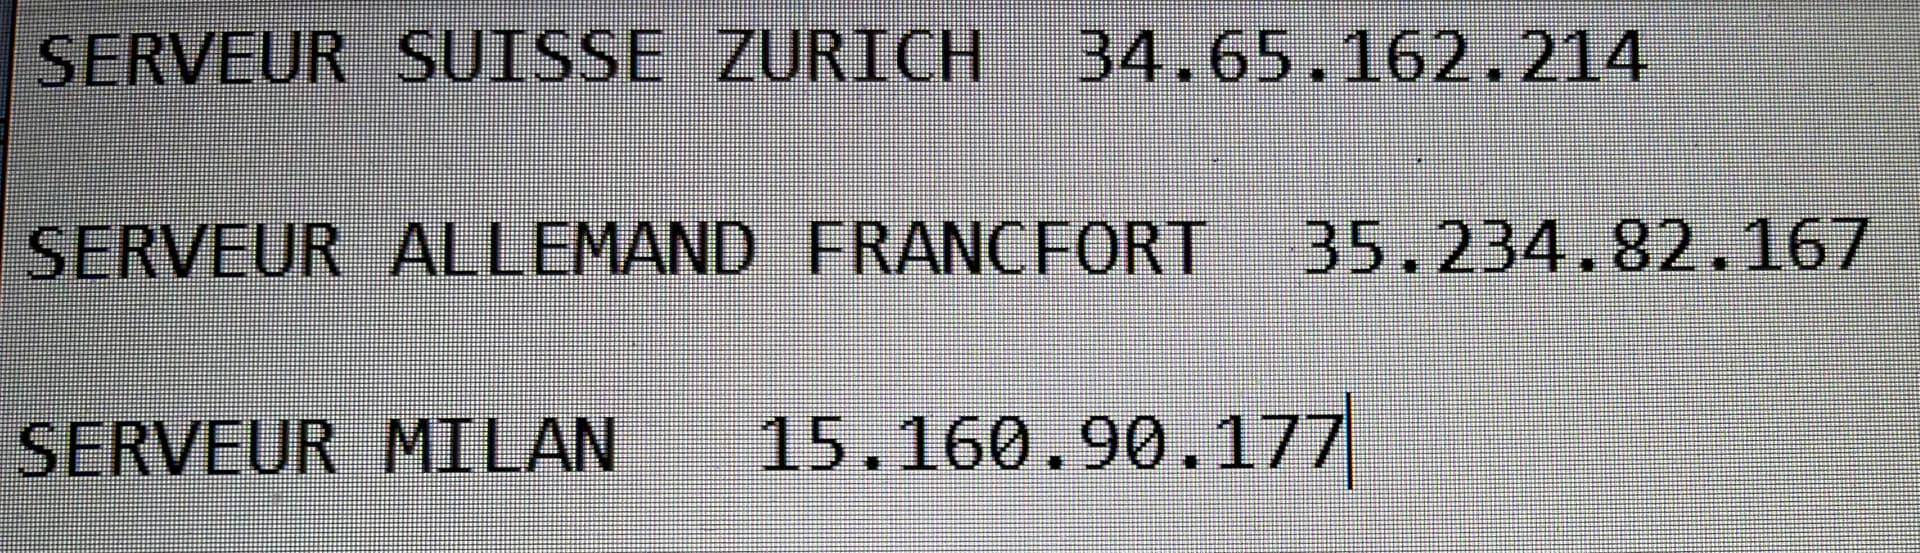
Did you find a game server to use as a reflector?

I really think you should work out the game servers that correspond to those you are playing on (you can work this out using 'tcpdump' on a live gaming session) and see if you can ping them, and if so you can add them to the reflectors list here:

reflectors=("1.1.1.1" "1.0.0.1" "8.8.8.8" "XX" "YY" "ZZ")
no_pingers=6

Let the cake-autorate service run for a few hours including a time you are playing the game and record what time you are playing the game.

Then upload the log file and let us know what time you played the game (and encountered lag).


|------------------------------------------------------------------------------------------|
|                                      WinMTR statistics                                   |
|                       Host              -   %  | Sent | Recv | Best | Avrg | Wrst | Last |
|------------------------------------------------|------|------|------|------|------|------|
|                             192.168.2.1 -   27 |  345 |  253 |    0 |   77 |  482 |    1 |
|                    lns20.edge.init7.net -   97 |  147 |    5 |    6 |   20 |   76 |    6 |
|                  r1zrh11.core.init7.net -   97 |  147 |    5 |    6 |   20 |   76 |    7 |
|                   No response from host -  100 |  143 |    0 |    0 |    0 |    0 |    0 |
|                   No response from host -  100 |  143 |    0 |    0 |    0 |    0 |    0 |
|                   No response from host -  100 |  143 |    0 |    0 |    0 |    0 |    0 |
|                   No response from host -  100 |  143 |    0 |    0 |    0 |    0 |    0 |
|                   r2zrh8.core.init7.net -   97 |  147 |    5 |    8 |   27 |   76 |    8 |
|                            74.125.49.54 -   97 |  147 |    5 |    7 |   27 |   76 |    7 |
|                   No response from host -  100 |  143 |    0 |    0 |    0 |    0 |    0 |
|                   No response from host -  100 |  143 |    0 |    0 |    0 |    0 |    0 |
|                   No response from host -  100 |  143 |    0 |    0 |    0 |    0 |    0 |
|                   No response from host -  100 |  143 |    0 |    0 |    0 |    0 |    0 |
|                   No response from host -  100 |  143 |    0 |    0 |    0 |    0 |    0 |
|                   No response from host -  100 |  143 |    0 |    0 |    0 |    0 |    0 |
|                   No response from host -  100 |  143 |    0 |    0 |    0 |    0 |    0 |
|                   No response from host -  100 |  143 |    0 |    0 |    0 |    0 |    0 |
|                   No response from host -  100 |  143 |    0 |    0 |    0 |    0 |    0 |
|                   No response from host -  100 |  143 |    0 |    0 |    0 |    0 |    0 |
|                   No response from host -  100 |  143 |    0 |    0 |    0 |    0 |    0 |
|                   No response from host -  100 |  143 |    0 |    0 |    0 |    0 |    0 |
|                   No response from host -  100 |  143 |    0 |    0 |    0 |    0 |    0 |
|                   No response from host -  100 |  143 |    0 |    0 |    0 |    0 |    0 |
|                   No response from host -  100 |  143 |    0 |    0 |    0 |    0 |    0 |
|                   No response from host -  100 |  143 |    0 |    0 |    0 |    0 |    0 |
|                   No response from host -  100 |  143 |    0 |    0 |    0 |    0 |    0 |
|                   No response from host -  100 |  143 |    0 |    0 |    0 |    0 |    0 |
|                   No response from host -  100 |  143 |    0 |    0 |    0 |    0 |    0 |
|                   No response from host -  100 |  143 |    0 |    0 |    0 |    0 |    0 |
|                   No response from host -  100 |  143 |    0 |    0 |    0 |    0 |    0 |
|________________________________________________|______|______|______|______|______|______|

Do you have an opinion on this MTR test?

Is 192.168.2.1 your router? Is this a wired connection or over WiFi?

I really would like to see the cake-autorate log.

Yes 192.168.2.1 is the ISP router, this test was requested by my ISP, they asked me to use only their router and only one pc connected for the test ... to rule out any network problems in the home

Its not possible with this configuration now..

Can you repeat the test for destination 1.1.1.1?

If I do the test with 8.8.8.8, 9.9.9.9 or 1.1.1.1 I don't have any loss... I am at work and I can’t to give you the proof. Please believe me!

The test is always by cable rj45 never in wifi

That's a weird MTR, why is your router only responding to 27% of pings?

Unfortunately I have no idea, but that doesn't stop me from watching Netflix, surfing the web or sending emails... apart from gaming everything is fine!

Yes, someone gave you the IP address of a device that is configured to not respond. Which IP address did you try to reach?

What Rate did you mtr at? If you quadrupel the ping interval, whst loss do you see then?

Its server game

So not all end points are configured to respond to latency probes, my hunch is game servers will generally not be configured to respond,

123-1234567:~ user$ sudo mtr -ezb4w -c 150 lns20.edge.init7.net
Start: 2022-11-07T19:51:27+0100
HOST: 123-1234567.local                                                           Loss%   Snt   Last   Avg  Best  Wrst StDev
  1. AS???    192.168.42.1                                                        30.0%   150    0.7   0.7   0.5   1.0   0.1
  2. AS6805   loopback1.0001.acln.06.ham.de.net.telefonica.de (62.52.201.198)      0.0%   150   10.3  14.7   9.9  56.6   9.8
  3. AS6805   bundle-ether8.0001.dbrx.06.ham.de.net.telefonica.de (62.53.1.232)    0.7%   150   10.5  10.6  10.1  11.4   0.2
  4. AS6805   ae6-0.0001.corx.06.ham.de.net.telefonica.de (62.53.14.250)           0.0%   150   17.5  18.2  16.8  46.0   3.9
       [MPLS: Lbl 16602 TC 0 S u TTL 1]
  5. AS6805   ae6-0.0002.corx.02.fra.de.net.telefonica.de (62.53.0.49)             0.0%   150   17.5  18.7  17.0  45.1   4.3
       [MPLS: Lbl 16602 TC 0 S u TTL 1]
  6. AS6805   bundle-ether1.0003.dbrx.02.fra.de.net.telefonica.de (62.53.14.163)   0.0%   150   17.0  17.5  16.9  20.9   0.4
       [MPLS: Lbl 16602 TC 0 S u TTL 1]
  7. AS6805   bundle-ether1.0005.prrx.02.fra.de.net.telefonica.de (62.53.10.51)    0.0%   150   18.2  17.6  17.2  19.5   0.3
  8. AS13030  r1fra3.core.init7.net (5.180.135.128)                                0.0%   150   19.7  22.1  19.4  47.0   5.0
  9. AS13030  r2zrh2.core.init7.net (5.180.135.172)                                0.0%   150   26.6  26.5  24.8  45.4   3.5
 10. AS13030  r1zrh9.core.init7.net (5.180.132.229)                                0.0%   150   25.6  25.7  25.2  33.0   0.8
 11. AS13030  r1zrh7.core.init7.net (5.180.135.109)                                0.0%   150   25.6  25.7  25.0  27.2   0.3
 12. AS13030  r1zrh11.core.init7.net (5.180.132.228)                               0.0%   150   25.5  25.9  25.3  45.6   1.8
 13. AS13030  lns20.edge.init7.net (5.180.132.202)                                 0.0%   150   24.7  24.9  24.4  27.7   0.3

I can reach your ISP's nodes quite well,

15.160.90.177

123-1234567:~ user$ sudo mtr -ezb4w -c 150 15.160.90.177
Start: 2022-11-07T20:05:46+0100
HOST: 123-1234567.local                                                          Loss%   Snt   Last   Avg  Best  Wrst StDev
  1. AS???    192.168.42.1                                                       37.3%   150    0.7   0.7   0.4   1.2   0.1
  2. AS6805   loopback1.0001.acln.06.ham.de.net.telefonica.de (62.52.201.198)     0.0%   150   38.5  15.1   9.8  51.4  10.2
  3. AS6805   bundle-ether8.0001.dbrx.06.ham.de.net.telefonica.de (62.53.1.232)   0.7%   150   10.4  10.7  10.2  12.1   0.3
  4. AS6805   bundle-ether1.0002.prrx.06.ham.de.net.telefonica.de (62.53.2.129)   0.0%   150   11.1  10.9  10.2  14.6   0.4
  5. AS???    99.83.64.38                                                         0.0%   150   10.2  11.4   9.6  26.4   2.7
  6. AS???    150.222.86.116                                                      0.0%   150   10.9  11.6  10.0  29.2   2.6
       [MPLS: Lbl 30876 TC 0 S u TTL 1]
       [MPLS: Lbl 400000 TC 0 S u TTL 1]
  7. AS???    ???                                                                100.0   150    0.0   0.0   0.0   0.0   0.0
  8. AS???    150.222.86.182                                                      0.0%   150   12.5  11.8   9.9  27.3   2.4
       [MPLS: Lbl 29380 TC 0 S u TTL 1]
  9. AS???    150.222.86.143                                                      0.0%   150   10.2  11.5   9.8  21.2   2.0
 10. AS???    ???                                                                100.0   150    0.0   0.0   0.0   0.0   0.0
 11. AS16509  52.119.153.226                                                      0.0%   150   30.0  31.2  29.1  48.7   2.7
       [MPLS: Lbl 40052 TC 0 S u TTL 1]
 12. AS16509  52.119.153.213                                                      0.0%   150   30.4  30.7  29.6  71.2   3.5
 13. AS16509  52.119.153.144                                                      0.0%   150   29.4  28.4  26.7  57.6   3.1
       [MPLS: Lbl 23908 TC 0 S u TTL 1]
       [MPLS: Lbl 7887 TC 0 S u TTL 1]
 14. AS16509  52.119.153.165                                                      0.0%   150   27.4  27.5  26.8  33.1   0.7
       [MPLS: Lbl 7887 TC 0 S u TTL 1]
 15. AS16509  52.119.154.52                                                       0.0%   150   27.0  27.2  26.4  47.0   2.0
 16. AS???    ???                                                                100.0   150    0.0   0.0   0.0   0.0   0.0

yepp, endpoint does not respond to ICMP probes.

34.65.162.214:

123-1234567

123-1234567:~ user$ sudo mtr -ezb4w -c 150 34.65.162.214
Start: 2022-11-07T20:27:13+0100
HOST: 123-1234567.local                                                          Loss%   Snt   Last   Avg  Best  Wrst StDev
  1. AS???    192.168.42.1                                                       49.3%   150    0.7   0.8   0.5   1.1   0.1
  2. AS6805   loopback1.0001.acln.06.ham.de.net.telefonica.de (62.52.201.198)     0.0%   150   10.5  15.5   9.8  66.1  11.7
  3. AS6805   bundle-ether8.0002.dbrx.06.ham.de.net.telefonica.de (62.53.1.234)   2.0%   150   11.0  10.8  10.2  12.2   0.3
  4. AS6805   bundle-ether2.0001.prrx.06.ham.de.net.telefonica.de (62.53.2.217)   0.0%   150   10.9  10.9  10.4  12.7   0.3
  5. AS15169  72.14.208.60                                                        0.0%   150   10.5  11.6  10.0 140.8  10.6
  6. AS???    ???                                                                100.0   150    0.0   0.0   0.0   0.0   0.0

also does not want to reply...

35.234.82.167:

123-1234567:~ user$ sudo mtr -ezb4w -c 150 35.234.82.167
Password:
Start: 2022-11-07T20:36:40+0100
HOST: 123-1234567.local                                                          Loss%   Snt   Last   Avg  Best  Wrst StDev
  1. AS???    192.168.42.1                                                       39.3%   150    0.9   0.8   0.6   1.3   0.1
  2. AS6805   loopback1.0001.acln.06.ham.de.net.telefonica.de (62.52.201.198)     0.0%   150   10.8  17.2  10.0  70.4  12.8
  3. AS6805   bundle-ether8.0001.dbrx.06.ham.de.net.telefonica.de (62.53.1.232)   0.7%   150   11.1  10.8  10.4  12.8   0.3
  4. AS6805   bundle-ether1.0002.prrx.06.ham.de.net.telefonica.de (62.53.2.129)   0.0%   150   11.1  11.0  10.2  11.7   0.2
  5. AS???    ???                                                                100.0   150    0.0   0.0   0.0   0.0   0.0

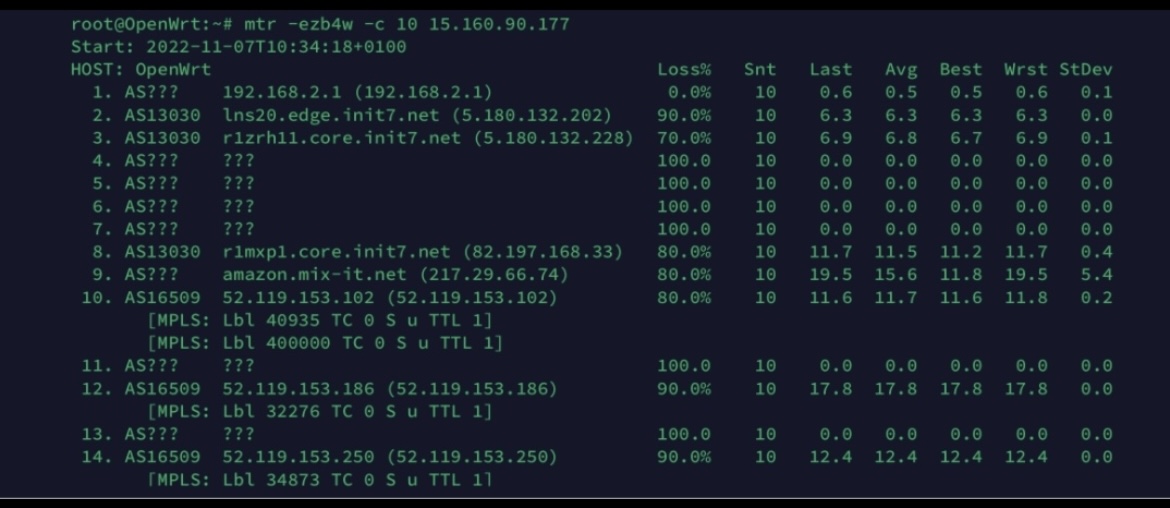
so neither of the end points seems to respond, my router 192.168.42.1 has a rate limit (but that affects only the router so can be ignored), and your traces look really odd with a number of hops replying well to my probes that are 100% loss for you...

What does your ISP say when you send the output of:

mtr -ezb4w -c 100 r2zrh8.core.init7.net

or do they advertise their own speedtest servers you could use as mtr target?

Start: 2022-11-07T12:29:12-0800
HOST: tintin                                                               Loss%   Snt   Last   Avg  Best  Wrst StDev
  1. AS???    pirouter.lan (10.79.1.6)                                      0.0%    15    0.2   0.2   0.2   0.3   0.0
  2. AS???    192.168.1.254                                                 0.0%    15    1.0   1.0   0.9   1.3   0.1
  3. AS7018   162-207-92-1.lightspeed.irvnca.sbcglobal.net (162.207.92.1)   0.0%    15    1.7   1.9   1.7   2.6   0.3
  4. AS7018   70.232.229.68                                                 0.0%    15    3.5   3.5   3.2   4.1   0.3
  5. AS7018   12.242.115.44                                                 0.0%    15    8.1   7.1   3.7  10.6   2.3
  6. AS1299   las-bb1-link.telia.net (80.239.193.213)                       0.0%    15    4.6   4.8   4.5   5.4   0.3
  7. AS1299   lax-b23-link.ip.twelve99.net (62.115.125.192)                 0.0%    15    4.6   4.8   4.2   8.0   0.9
       [MPLS: Lbl 415900 TC 0 S u TTL 1]
  8. AS13030  lns20.edge.init7.net (5.180.132.202)                          0.0%    15  172.3 172.3 172.1 172.6   0.1

I also get 100% response from everything in the path all the way to your doorstep. The 80-100% loss is something very serious I think.

@moeller0 how does mtr know the information about the MPLS link?

1 Like