Just run the command as is, then we can figure outvhow to proced.
Thank you for the quick replies, I will look at the log and post the output as soon as I can. Unfortunately, I had to switch to my 7490 (running Fritz!Os once again) for the time being because my housemates needed the stable internet connection and I will have to wait for another opportunity to plug the 7530 in. I very much appreciate your hints and will follow up asap!
Since you have the FB7490 already connected, please try to use the go-dsl tool:
and
to get an overview of your link (increase the window size of the GUI tool) create a screenshot and post here, so we see how the link presents itself with a non-35b modem.
I included the results both as a screenshot and in textform, so you can look at the one that is more helpful ![]() (they were taken a few minutes apart, but I hope that's fine / maybe even helps)
(they were taken a few minutes apart, but I hope that's fine / maybe even helps)
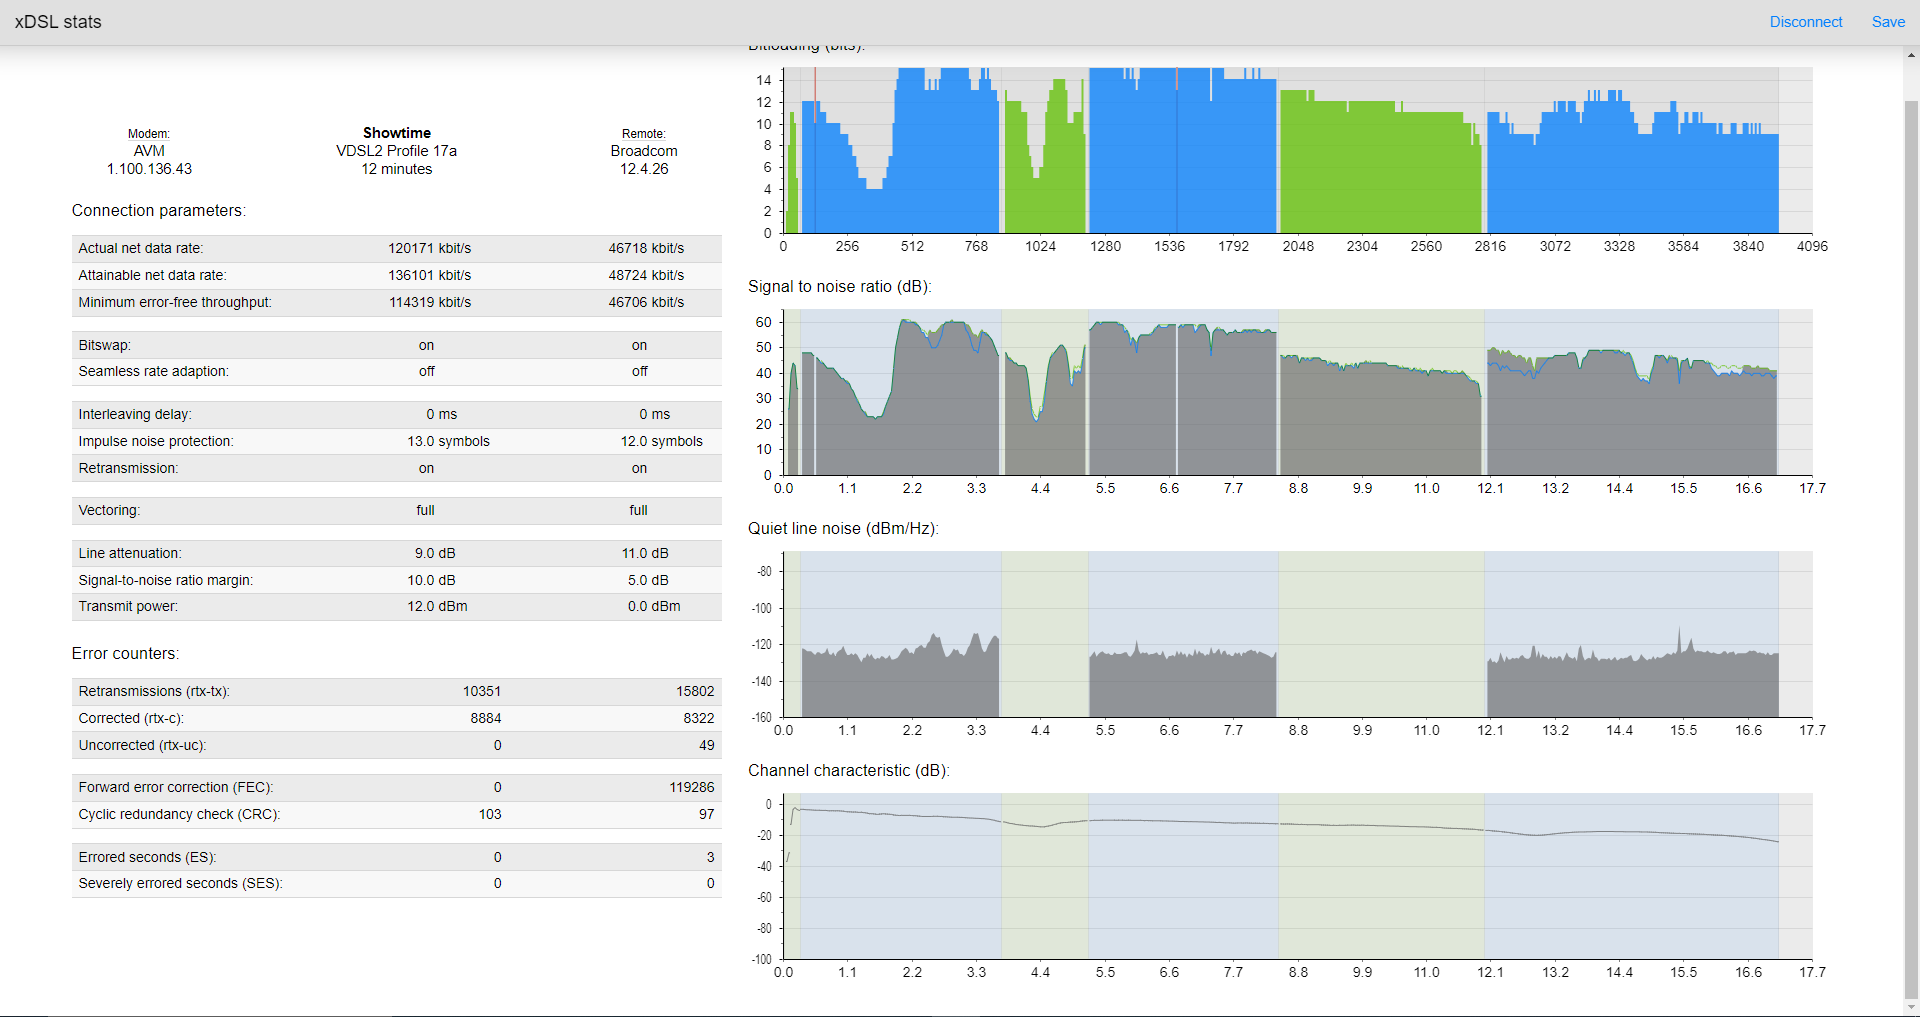
           State:    Showtime
            Mode:    VDSL2 Profile 17a
          Uptime:    5 minutes

          Remote:    Broadcom 12.4.26
           Modem:    AVM 1.100.136.43

     Actual rate:      120171 kbit/s      46718 kbit/s
 Attainable rate:      136806 kbit/s      48472 kbit/s
         MINEFTR:      117049 kbit/s      46706 kbit/s

         Bitswap:          on                on
   Rate adaption:         off               off

    Interleaving:           0 ms              0 ms
             INP:        13.0 symbols      12.0 symbols
  Retransmission:          on                on

       Vectoring:        full              full

     Attenuation:         9.0 dB           11.0 dB
      SNR margin:        11.0 dB            5.0 dB
  Transmit power:        12.0 dBm           0.0 dBm

    RTX TX Count:           -                 -
     RTX C Count:           -                 -
    RTX UC Count:           -                 -

       FEC Count:           0            119234
       CRC Count:         103                97

        ES Count:           0                 3
       SES Count:           0                 0
1 Like
Thanks! The blue and green lines in the SNR plot show maximum and minimum, the longer you let the GUI run and collect data the more informative this is going to be. Assume you only sampled for a short period I would say there is too much happening there and you have a number of deep dips in the second from left Upstream band (green) and in the 3rd from left Downstream band in blue, both in the SNR plot, as well as in the bitloading graph (which is expected you can only more bits on sub carriers with better SNR). Overall I think something on your link is problematic which might explain issues getting sync with OpenWrt. Then again, I assume the FB7530 did work well under FritzOS...
Here is an example from 12 Minutes on my link as reference, note the small differences betwen the green and the blue line in the SNR plot.
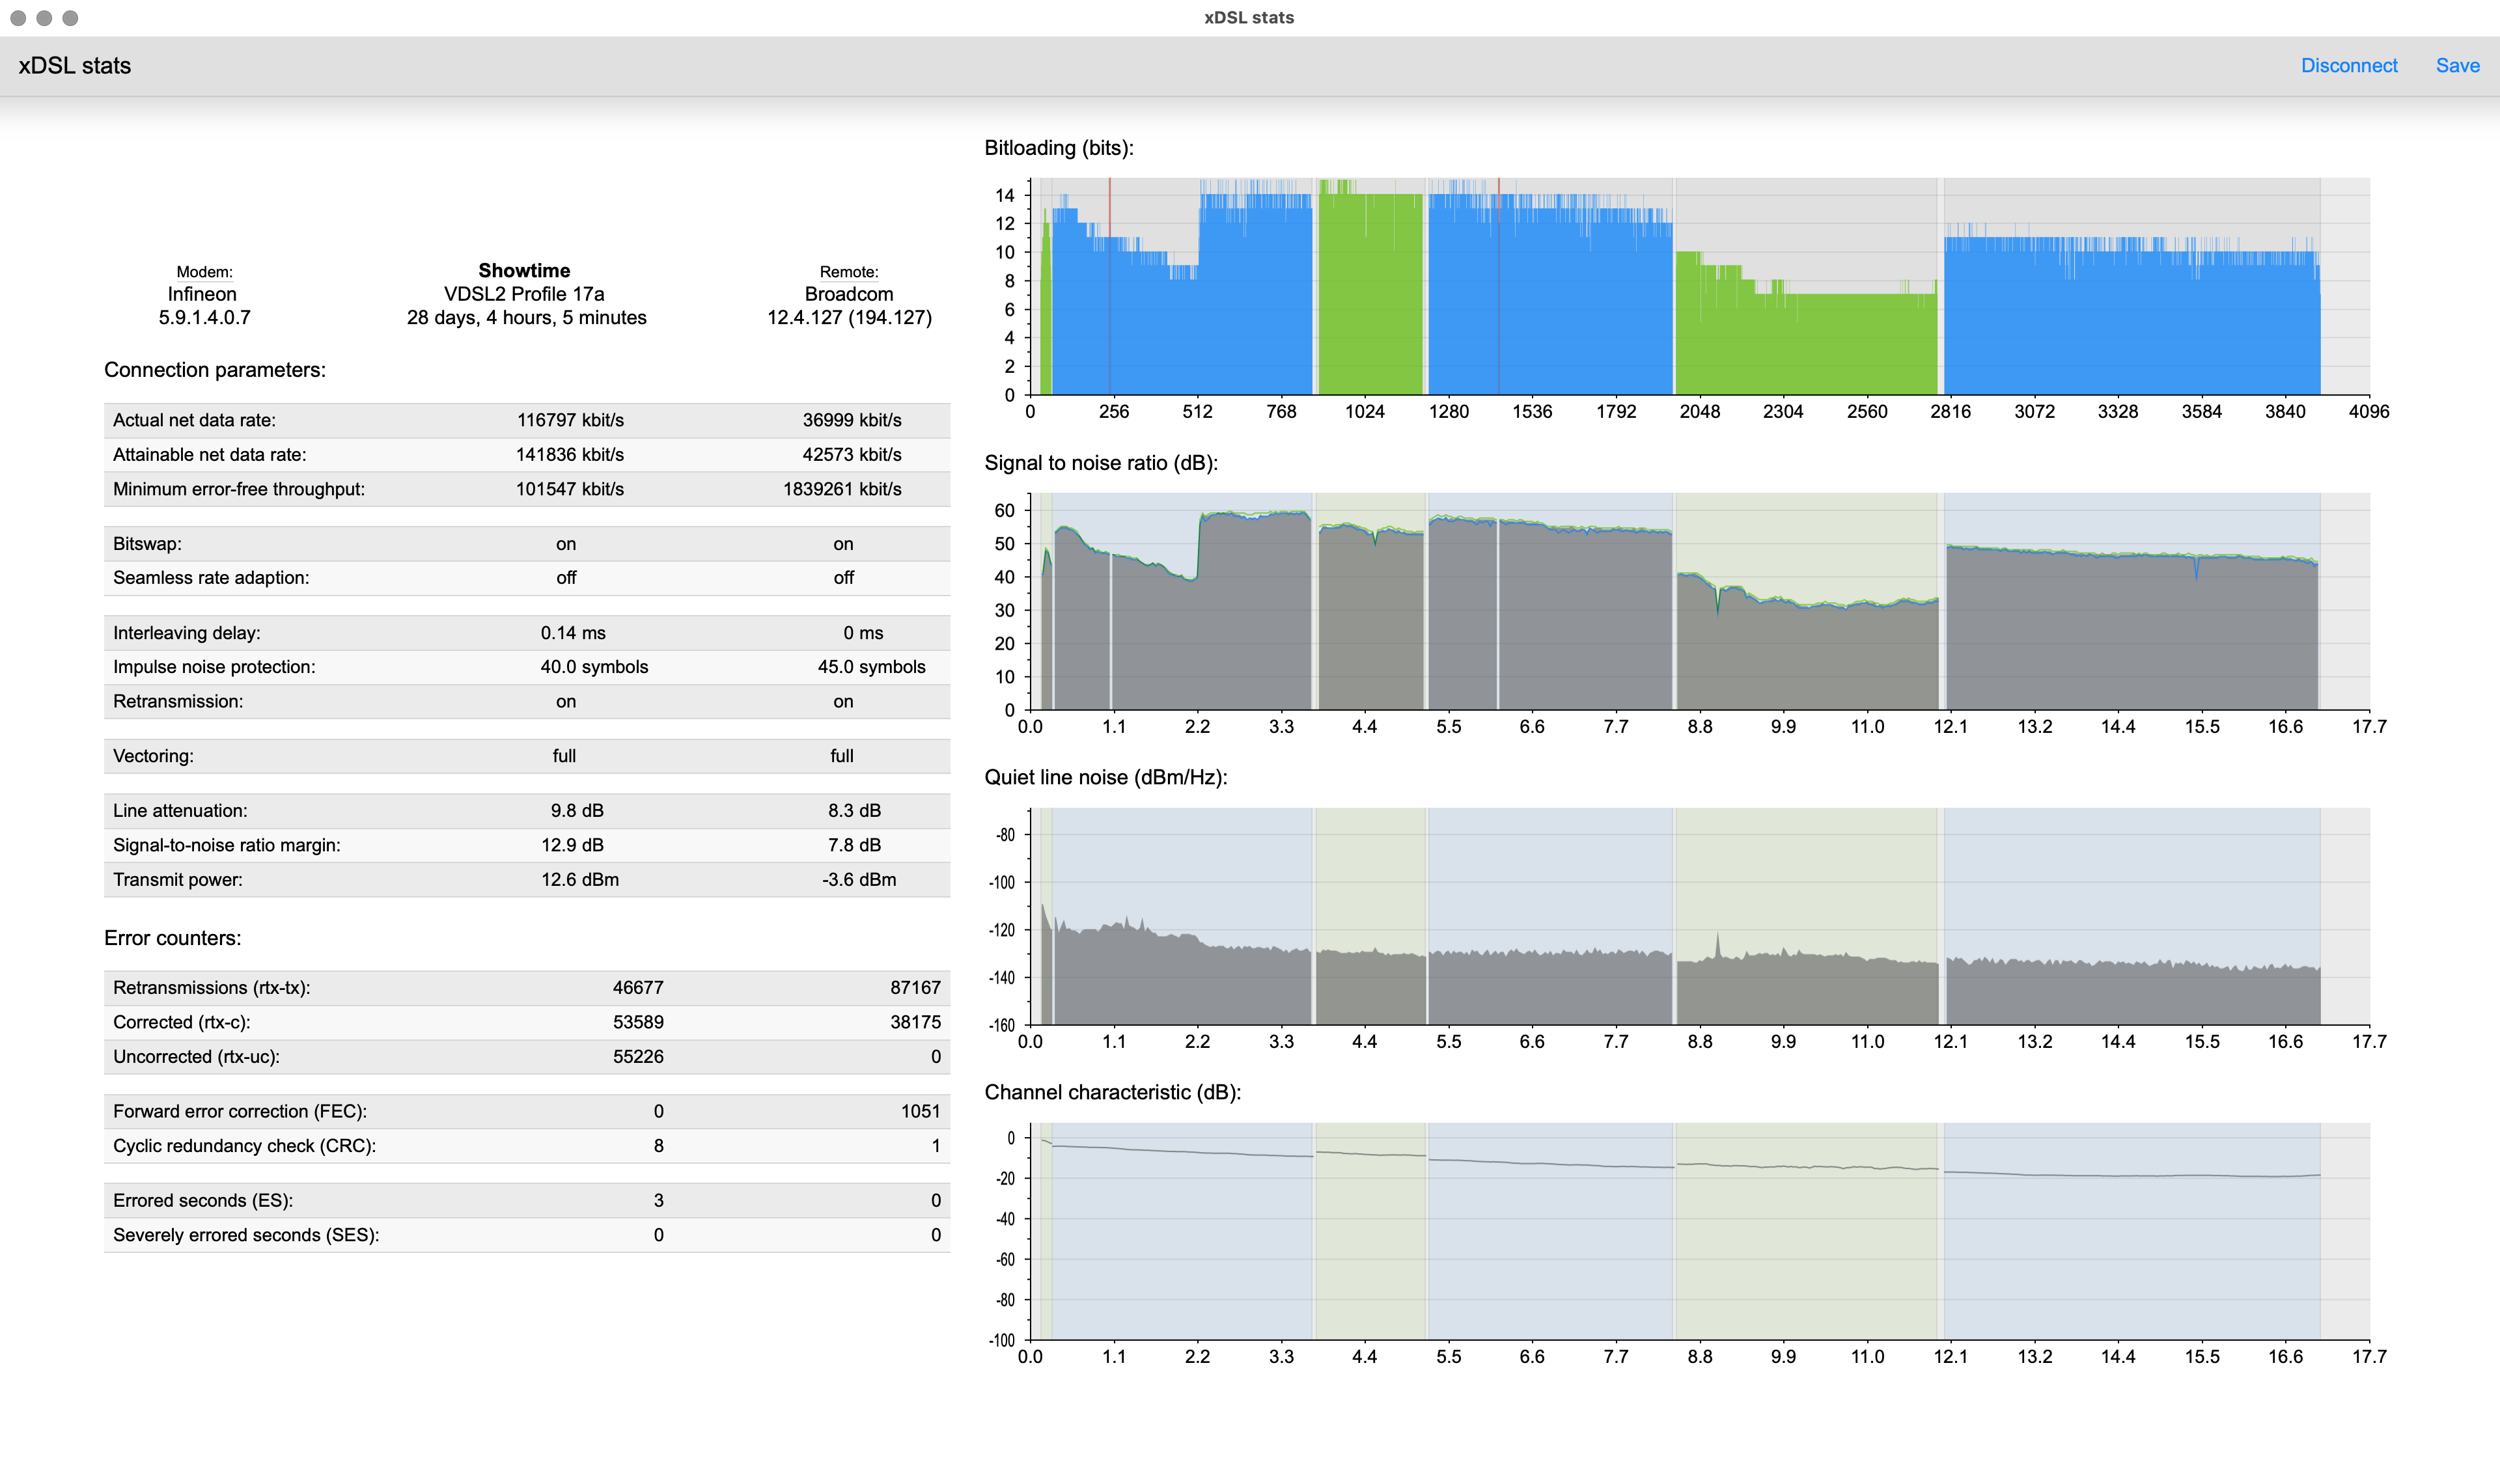
(My Downloads in blue are pretty smooth, but you can see some periodic modulation on the upload SNR plots, that used to be massively worse until I redid my in apartment wiring, moving the modem as close to where the phone-cables enters the apartment).
@moeller0 already mentioned the dips in SNR and bitloading. To monitor minimum/maximum values on the 7490, it probably makes sense to also use the corresponding option in the vendor web interface (because monitoring via the external tool may not be as accurate).
Another thing to note here are the two dips in Hlog. While they don't appear very large, it still indicates that something is probably not quite right with the line. Do you happen to have more than one phone socket? If yes, they might be connected in parallel, which negatively affects the DSL connection.
I actually think it might make sense to scale the y-axis of the QLN and Hlog plots somewhat better to focus on the actual data range better?
Should I just leave go-dsl open for a longer time, will it automatically sample as long as it's running? It looked to me like the graphs weren't changing after they were first plotted.
When using the FB7530 on stock firmware, the sync first occasionally broke. I contacted the support several times and a technician was supposed to come two times to fix it. They never came into the house but just checked out the cables / boxes on the streets and said they fixed any issues. I once had a good talk with a remote technician from 1&1 who made the same assumption (two phones sockets) and mentioned the dips, but I'm pretty sure there's only one phone socket (can't say it with 100% certainty, but I've searched everywhere). However, the cables are pretty old, so that might be an issue. But the DSL sync is currently completely stable (according to the FB7490), only the internet connection is sometimes disconnecting.
How can I do this the best way? Should I leave go-dsl running for longer, send a screenshot from the FB7490 interface or plot the data in a different way? I'm sorry for needing such detailed guidance, but I don't really know what information is the most helpful for you to be able to help me.
It should automatically update every 10 seconds (when using the GUI), and adjust the SNR minimum/maximum lines. However, the interval could be much longer with a Fritzbox when loading support data is enabled (because the device takes a long time to generate it). Support data is only needed for some error counters and QLN/Hlog (which don't change while the DSL connection is active).
But as you are currently using the 7490 with vendor firmware you might as well just enable the minimum/maximum option in the DSL spectrum page of its web interface. This may provide better data than the tool is able to create by polling from the outside (the tool does not use the min/max data provided by the device, so you would have to check the web interface then).
I think @moeller0's comment was targeted at me as the developer of the tool.
1 Like
Sorry for the lack of replies for the past two days. The DSL sync was finally stable again, the following screenshot is after ~22 hours (I would guess the MinMax values in the plot are over the course of the entire sync period?). The differences are looking pretty big to me but then again, I have no idea what a typical chart would look like. Regarding that, if it doesn't take too much effort I would really appreciate if you could briefly explain what conclusions you draw from what part of these charts, I'm always eager to learn to be able to spot problems myself further down the line.
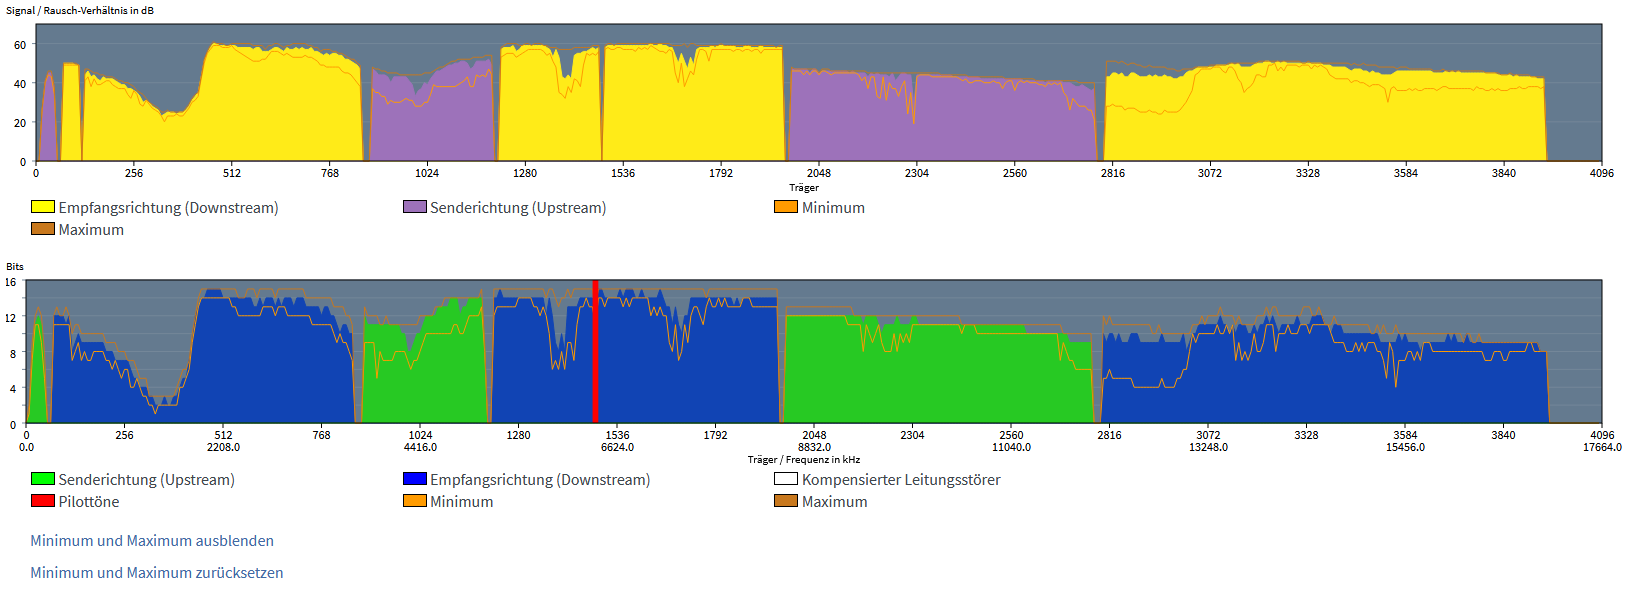
So the differences between min and mx are pretty obvious, which is never a good sign....
The lower plot shows the bitloading, that is how many bits are transmitted per "clock", higher bitloading requires coding schemes with more constellations and to be able to disentable these constellations the signal needs to be clean, that is the Signal to Noise Ratio (SNR) needs to be high, which is what the upper plot shows. notice how the bitloading mimum curve looks similar to the SNR minimum curve? This is because they are coupled and it is easy to get high bitloading with high SNR.
About the general trend I think min and max differ too much, but I lack the experience to tell why exactly.
Potential causes often are:
a) bad power supply unit either on the modem or any other device, often LED lights
b) bad internal wiring, either wrong wire type and or sub-optimal wire typology, there should be no branches
c) Powerlan /PLC devices used in the neighborhood (e.g. in one's own network or in flats/houses near by)
d) any other external noise source
e) HAM radio afficinados in the neighbourhood (often responsible for sharp notches, the two notches between bin 1280 and 1536 and between 1536 and 1792 might be caused by this)
f) bad contacts (e.g. corrosion) or only one of the two wires connected, this can e.g. happen when the telco has work done on outside connection boxes or he in-house primary line termination point (APL in Germany). Thanks to @andyboeh for bringing this up!
out of these only e) is unfixable ![]() (amateur radio operators are licensed users of the frequencies, DSL is only allowed to use them if the rf emissions stay below certain limits, radio operators are legally allowed to interfere with DSL (within limits)).
(amateur radio operators are licensed users of the frequencies, DSL is only allowed to use them if the rf emissions stay below certain limits, radio operators are legally allowed to interfere with DSL (within limits)).
Oh wow - thanks for the comprehensive answer! To be quite honest, I believe I'm using
a) the wrong power supply for the Modem
b) very old cables throughout the house and the telephone line to the house
c) Devolo Powerlan devices directly next to the modem
I'm going to fix a) and c) for now and post another measurement of the graphs MinMax when I have results.
Edit: To be fair to myself, I accidentally swapped the powersupplies of two routers when connecting both - don't know if that makes a big difference, but we shall see.
I think this might've made a difference! While the graphs still look a bit ... choppy, the minimum and maximum curves are much closer together. However, this was after a shorter time period - I will take another screenshot again this evening.

1 Like
What I did, is to move the bridged-modem as close to the point where the phone-cable enters my flat, which allowed me to replace 12 meters of fixed bad wiring and 2 meter okayish TAE-to-modem cable with 0.3m fixed cable, a 8P2C socket (old ISDN socket) and a 0.5m cat6 patch cable. This did wonders for the line stability as I now "collect" considerably less noise. Since that place isn't where I wanted my router, I ran a cat5e ethernet cable to the router.
Pretty much the same here, rewarded by a significant speed-up.
1 Like
I did a very similar thing, a few meters less of old (bad) cabling can make a huge difference. In addition, my bridge-modem is now hidden in the multimedia distribution box.
1 Like
As an aside, 35b Supervectoring is considerably more sensitive to "bad" cabling. The point is not that the cables are "bad" per se, but really that the cables often used are fine for low frequencies like used on plain old analog telephony, but are really not suited to higher frequencies, and the higher the frequencies used the more problematic this becomes. The result is cabling that works acceptable up to 17 MHz (vdsl2 profile 17b) can become problematic with profile 35a's upper half of the spectrum from 17 to 35 MHz.
For cable selection
https://telekomhilft.telekom.de/t5/Telefonie-Internet/Das-richtige-Kabel-zwischen-APL-und-TAE-Dose/ta-p/3499089
and
https://termin.telekom.de/endleitung/
contain information from the German incumbent telco which cables to use, but many users report decent results with Cat6-Cat8 cables as well in case the special telekom cable is hard to get.
IMHO this is orthogonal to trying to reduce the length of the analog-side wiring as much as realistically/economically/comfortably feasible.
1 Like
This is a great idea, because e.g. PLC devices tend to cause issues when they transfer data and might be relatively mild when idling, so what can happen is that some PLC devices in the neighborhood only get used in the afternoon/evening so colecting min/max data for >= 24 hours seems wise.
Great links! Unfortunately, it's often not easily possible to replace the cables if you're either living for rent or if the cables are not run in cable ducts. Or if the cables leading to the house are old.
A few years back we had massive sync problems (modem would only sync at 1MBit) and it turned out that one of the contacts in an outside distribution box on the wall of our house was corroded.
1 Like
Yes, I agree. This is why I did not replace the cable from my flat to the house's APL or placed my modem closer to the APL; that wire simply is inaccessible enough and since it works I have no good argument to bother my land-lord.
Yes, good point I added bad/missing contact to the list above.