Are there any packages that may add visibility into firewall rule events (deny, allow) similar to the below?
Yes but it isn't necessarily what my question was because I was looking for a visual (luci based) view of the fw log.
Looks like there isn't a simple way, unless I want to deploy ELK stack and ship logs to somewhere.
Logs take up space. A lot of space. It would be challenging to say the least to store and process the logs directly on the device itself. Of course, that depends on the hardware you're running OpenWRT on. But an external log receiver and processor is probably going to be the way to go.
If you don't want log retention, and only want immediate real-time visibility, with logs older than a couple of seconds discarded, then it may be possible to achieve what you want directly on the device itself without needing an external log processor.
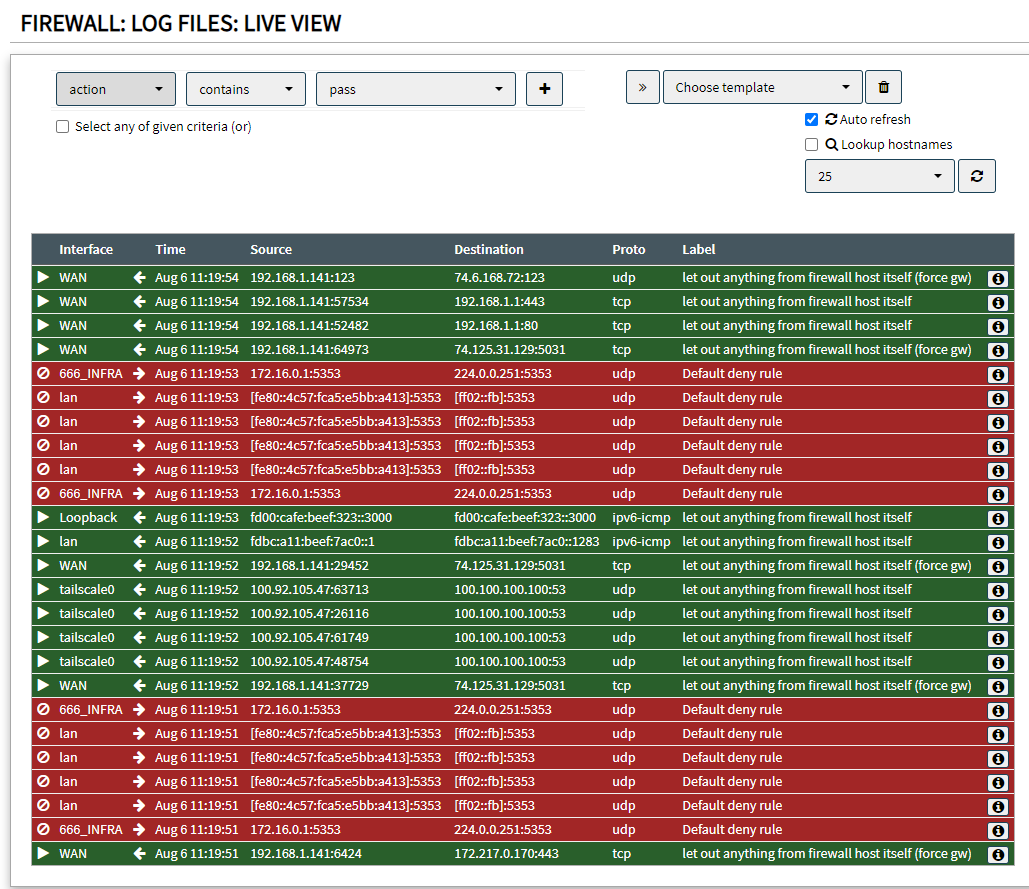
Hello everyone, I hope you are well? So I would also like this function where I can see every request or for example a live "ping" whether it is blocked or not. This would be very useful for any analysis. I used to have an Astaro (now Sophos) hardware firewall where I could see in real time exactly what was going on in the network.
I did the settings that iplaywithtoys recommended but I don't see any "ping" attempt in the logs. Do I understand correctly that it does not work with OpenWrt as it does with Astaro? Thanks for any clarification.
Best regards, Elena
Agreed. We need a logging UI.
Space isn't a issue in 2024. We have multi core CPU, 256-1024 mem, and 128+mb of storage plus USB / micro SD.
Most definately needed.
GUI view is prefered.
Thanks.
Hello,
As a newcomer to the world of openwrt, I'm surprised not to find any modules for tracking live traffic. It seems to me that with fw4 and netfilter it should be possible to activate traces on demand without consuming too many resources. Am I wrong?
Is this feature planned?
$ conntrack -E -o extended,labels
nfct_labelmap_new: No such file or directory
I don't understand. What's the ask / function?
I think that accessible/simple to use (live) firewall logging would be a really big improvement so let´s reignite the discussion as to how we cloud implement it with some rough ideas.
It seems OPNSense uses the log statement of pf that logs to a userspace readable pflog file. Fortunately nft has something similar to offer with log groups which can be used by appending “group ” to the log statement (so something like “log group 1”). This leads to the packet being logged to the corresponding log group that can be read by an application using libnetfilter_log. There is already ulogd that supports this and can be used to for example log these firewall packets to a different logfile so it is separate from syslog and as the packet isn´t also logged to syslog when it is logged to a log group we also have less clutter there. In the future we could then have a custom application that holds the last n packet logs (where n is user configurable based on hardware resources) that can be queried, perhaps by ubus, and then display the logs in luci.
One disadvantage of nft log groups in comparison to pf log is that with pf the action of the packet (accept/deny) is also logged, which doesn´t seem to be the case with nft so we would have to somehow get that information.
One idea would be to have a dedicated logging group for each firewall action (group 1=deny, group 2=drop, group 3=accept…), another one to use the “prefix” log option currently used to describe the rule in the syslog to add the action and possible parameters like zone in JSON. Finally we could also use the prefix to log the firewall rule id and the application collecting the packet log uses that to get the relevant info from the firewall rule, but one issue I could see here is that the “zone rules” aren´t just firewall rules with an id in uci.
What do you think of this way to implement this feature? If you have different ideas or improvements please share them.
It is not that straightforward or 1:! with FreeBSD. There is final action taken in each hook x (10 labels over int16)priority and packet follows to the next.
Annother trace facility is https://wiki.nftables.org/wiki-nftables/index.php/Ruleset_debug/tracing
eg trace new connection dispatch - place into /etc/nftables.d/something.nft
 chain trace_prerouting {
  type filter hook prerouting priority mangle - 1
  counter goto trace_chain
}
 chain trace_output {
  type route hook output priority mangle - 1
  counter goto trace_chain
}
 chain trace_chain {
  ct state new meta nftrace set 1
}
then read traces…