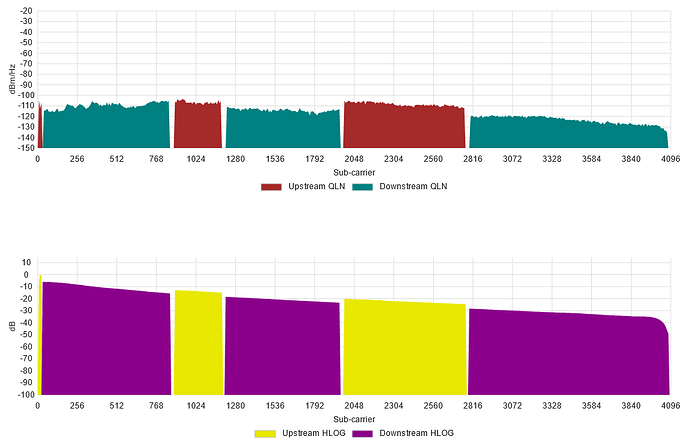
Can someone explain what those graphs mean for regular users?
The same they mean for experienced users... ![]() These tend to be helpful in diagnosing DSL problems, if your link has no issues, you can safely ignore these...
These tend to be helpful in diagnosing DSL problems, if your link has no issues, you can safely ignore these...
These show 4 different measures for each of the (up to) 4096 (or 8192 for profile 35b) individual sub-carriers. These plots also mark (by color) which sub-carriers are used for the internet-download and which are used for the internet-upload direction.
The 4 measures are described in T-REC-G.997.1 and are:
-
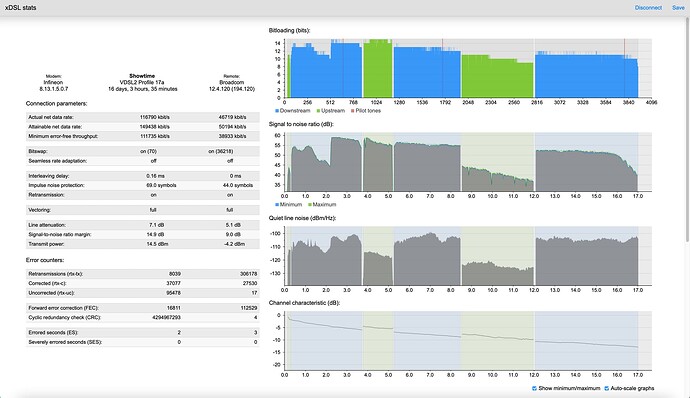
dB: Signal-to-noise ratio (SNR) in deci-Bell [dB]; this shows how usable the individual sub carriers currently are to carry bits, the higher the better (we have to accept a slow decrease with increasing frequency/sub-carrier number as attenuation increases with frequency in telephony wiring). This can be helpful to diagnose DSLAM issues with e.g. vectoring units or fall back profiles.
-
bits: Bit allocation in bit [bit]; different DSL standards have different maximal numbers of bits possible per sub-carrier but this shows which of the sub-carriers currently carry how many bits (per cycle)
-
dBm/Hz: Quiet line noise in dB referenced to 1mW/Hz; this is a one-off measurement from before sync is acquired, it measured the amount of noise in each carrier without any signal. This can be useful to quantify e.g. radio interference.
-
dB: Channel characteristics function (HLOG) in dB; this is a one-off measurement from before sync is acquired, it should be a smoothly decreasing line, deviations from that form can allow to diagnose issues, see https://www.ausnog.net/sites/default/files/ausnog-2018/presentations/1.10_Stefan_Keller-Tuberg_AusNOG2018.pdf for what can be lwarned from looking at this line.
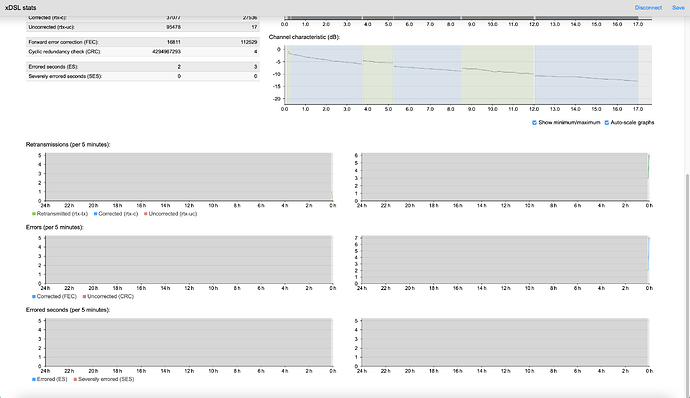
While I think that having these as part of the luci GUI is excellent, often when I want more concise information I reach for go-dsl as that offers a really nice an concise overfew combining these four graphs with the most important numbers (and if you let it run for some time, it will also show how the error counters change in intervals of 5 minutes). It also allows to scale the graphs automatically, which especially for the Hlog and the QLN reveals relevant details, and finally it can show maximum and minimum od SNT and bitloading, aggregated over the run time of go-dsl. This then looks like this:
and the second part
Note, I just started this so the error counter im 5 minute blocks contain nothing, and maximum and minimum graphs are really close by...
P.S.: The ADSL/VDSL2 ITU standards define the exact measures better, but they do not explain explicitly why one would like to look at them and what diagnostic values they have...
@moeller0 Wow! Thank you for taking the time to write such a thorough explanation.
This topic was automatically closed 10 days after the last reply. New replies are no longer allowed.


