thank -you Jow for the response -
I think i figured out how to insert multiple graphs. i was doing its sorting from multiple "if" statement to sort the differing graphs ( but that only works for differing plugin_incidences), but I see if you have to place all similar incidences with in the one "if" statement then it will work-- it seams that if you have similar if statement it just ignores the the next one --
module("luci.statistics.rrdtool.definitions.exec", package.seeall)
function rrdargs(graph, plugin, plugin_instance)
-- For $HOSTNAME/exec-foo-bar/temperature_baz-quux.rrd, plugin will be
-- "exec" and plugin_instance will be "foo-bar". I guess graph will be
-- "baz-quux"? We may also be ignoring a fourth argument, dtype.
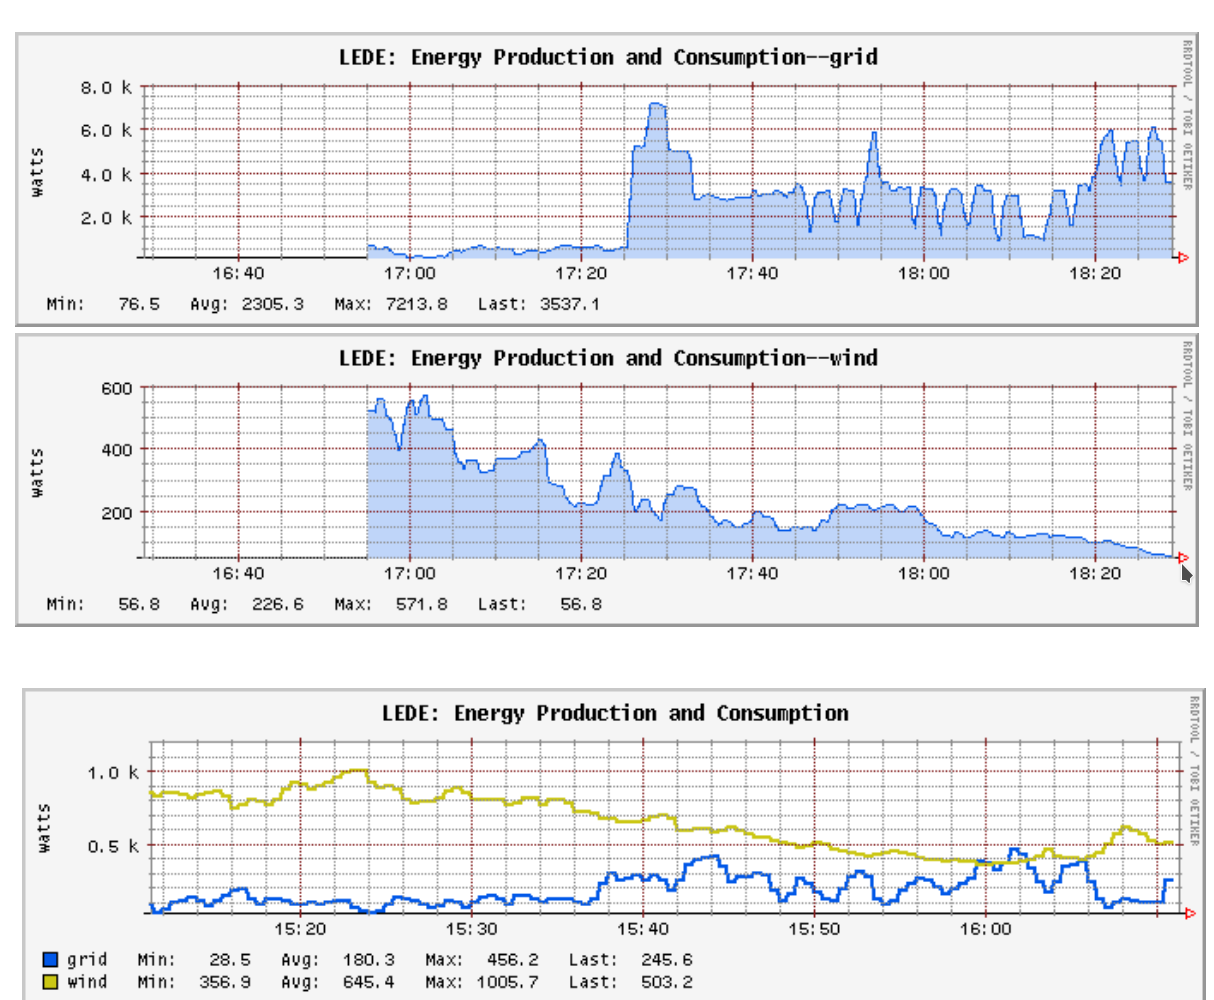
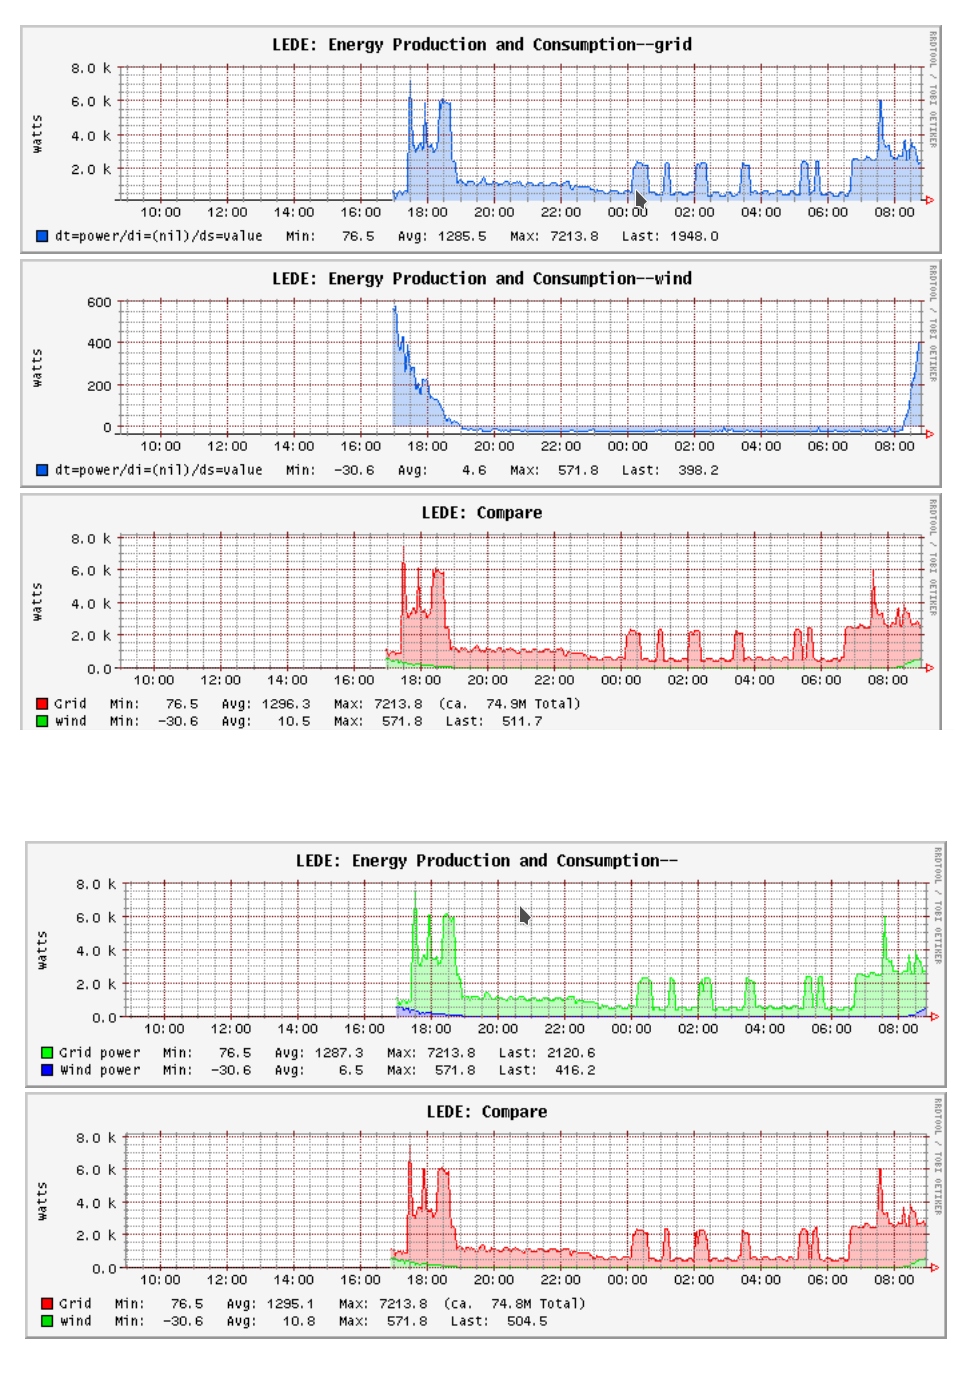
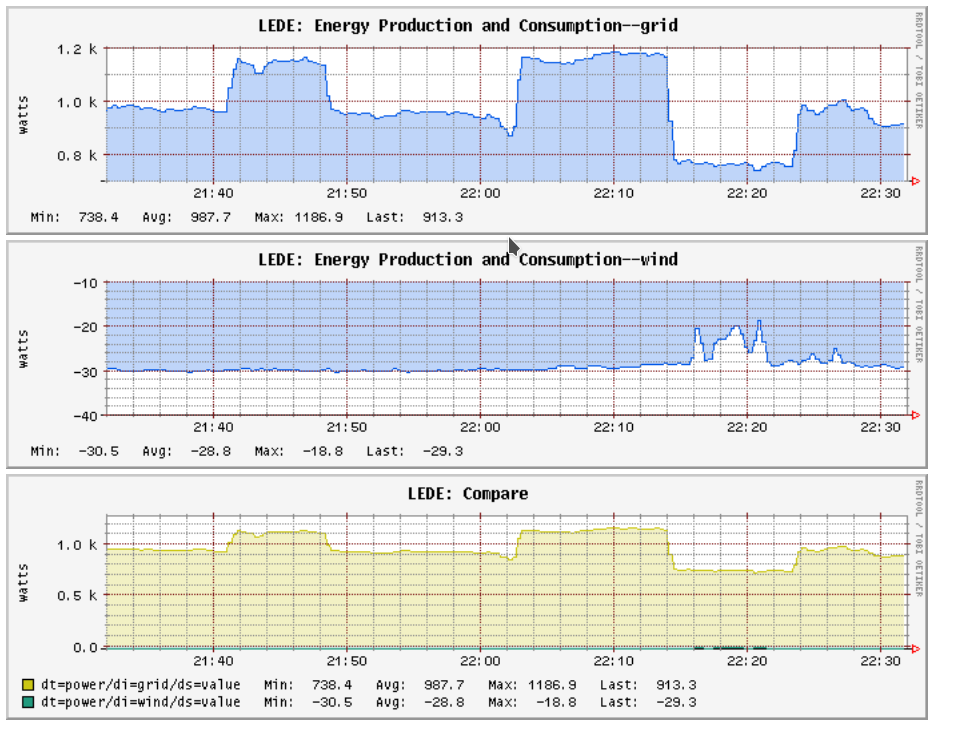
if "Energy" == plugin_instance then
--
-- Energy diagram
--
local energy = {
-- draw this diagram for each plugin instance
per_instance = true,
title = "%H: Energy Production and Consumption--%di",
vlabel = "watts",
-- diagram data description
data = {
-- defined sources for data types, if ommitted assume a single DS named "value" (optional)
sources = {
power = { "value" }
},
-- special options for single data lines
options = {
power__value = {
-- total = true, -- report total amount
-- color = "0000ff", -- rx is blue
-- noarea = true,
-- overlay = true,
title = "%di"
-- title = "Energy Production"
}
}
}
}
local test ={
title = "%H: Compare",
y_min = "0",
alt_autoscale_max = true,
vlabel = "watts",
-- number_format = "%5.1lf%%",
data = {
instances = {
power = { "grid", "wind" }
},
options = {
power_grid = { color = "ffffff", title = "Grid" },
power_wind = { color = "00e000", title = "wind" }
}
}
}
return { energy, test }
end
if "Temp" == plugin_instance then
--
-- Temperature diagram
--
local temp = {
-- draw this diagram for each plugin instance
-- per_instance = true,
title = "%H: Temperature %di",
vlabel = "celsius",
-- diagram data description
data = {
-- defined sources for data types, if ommitted assume a single DS named "value" (optional)
sources = {
temperature = { "value" }
},
-- special options for single data lines
options = {
power__value = {
-- total = true, -- report total amount
-- color = "0000ff", -- rx is blue
noarea = true,
overlay = true,
title = "%di"
-- title = "Energy Production"
}
}
}
}
return { temp }
end
if "Energy" == plugin_instance then
return {
title = "%H: Compare",
y_min = "0",
alt_autoscale_max = true,
vlabel = "watts",
-- number_format = "%5.1lf%%",
data = {
instances = {
power = { "grid", "wind" }
},
options = {
cpu_grid = { color = "ffffff", title = "Grid" },
cpu_wind = { color = "00e000", title = "wind" }
}
}
}
end
end
though the name is not displayed correctly for some reason