![]() I really hope nothing bad happened to lynx, this project has been really innovative and its been amazing so far~ I was really looking forward to the progress
I really hope nothing bad happened to lynx, this project has been really innovative and its been amazing so far~ I was really looking forward to the progress
Wow, that was abrupt, and apparently without any explanation, so it's hard to know why. I do hope he comes back, he's been driving a lot of interesting stuff.
Sometimes you need to step away from things like this, but I think it's no biggie to just say "hey I'm taking a break from this for a few months" rather than anonymizing his account etc.
Without rehashing the original topic, he was outspoken in this thread and decided to leave on his own. He’s been active on Github since then, but hard to maintain a community project without interacting with the community.
Gotcha. I've never been a fan of terminology wars of any kind. Hope he decides to come back.
@rb1 I felt I needed to say thanks besides the ![]() ...
...

(I tried to do a full page screenshot in Firefox but somehow I'm missing something...)
1 Like
Good to see you got it going. To get the full webpage screenshot, I used "GoFullPage" chrome extension.
Just wondering, did you have Prometheus and Grafana installed before setting up the Cake-Autorate dashboard?
Yes, I did. Besides autorate, I'm already monitoring cake itself, but went on a slightly different path from this, since I had already an "exporter" that I chose to keep. But I digress...
And thanks for the tip on the chrome extension.
Nice, so if I understand correctly, you managed to get cake statistics into Prometheus? Could you describe how you set this up or have a link to a guide? When I tried getting cake into Prometheus, I think there was a cake collectd package but had trouble getting Prometheus to scrape collectd Plugin:Write Prometheus.
First a disclaimer: my router isn't running OpenWrt, but Debian (it's an x86/64 small PC)
Actually, I first tried the collectd route, but I had issues getting it working, and I was eager to see cake stats on Grafana, so I ended up using a script I used to pull cake statistics into Cacti.
It simply outputs tc qdisc in json, and runs each 10 seconds.
Then I put in place a json api to publish the stats so that Prometheus could grab them thru json-exporter.
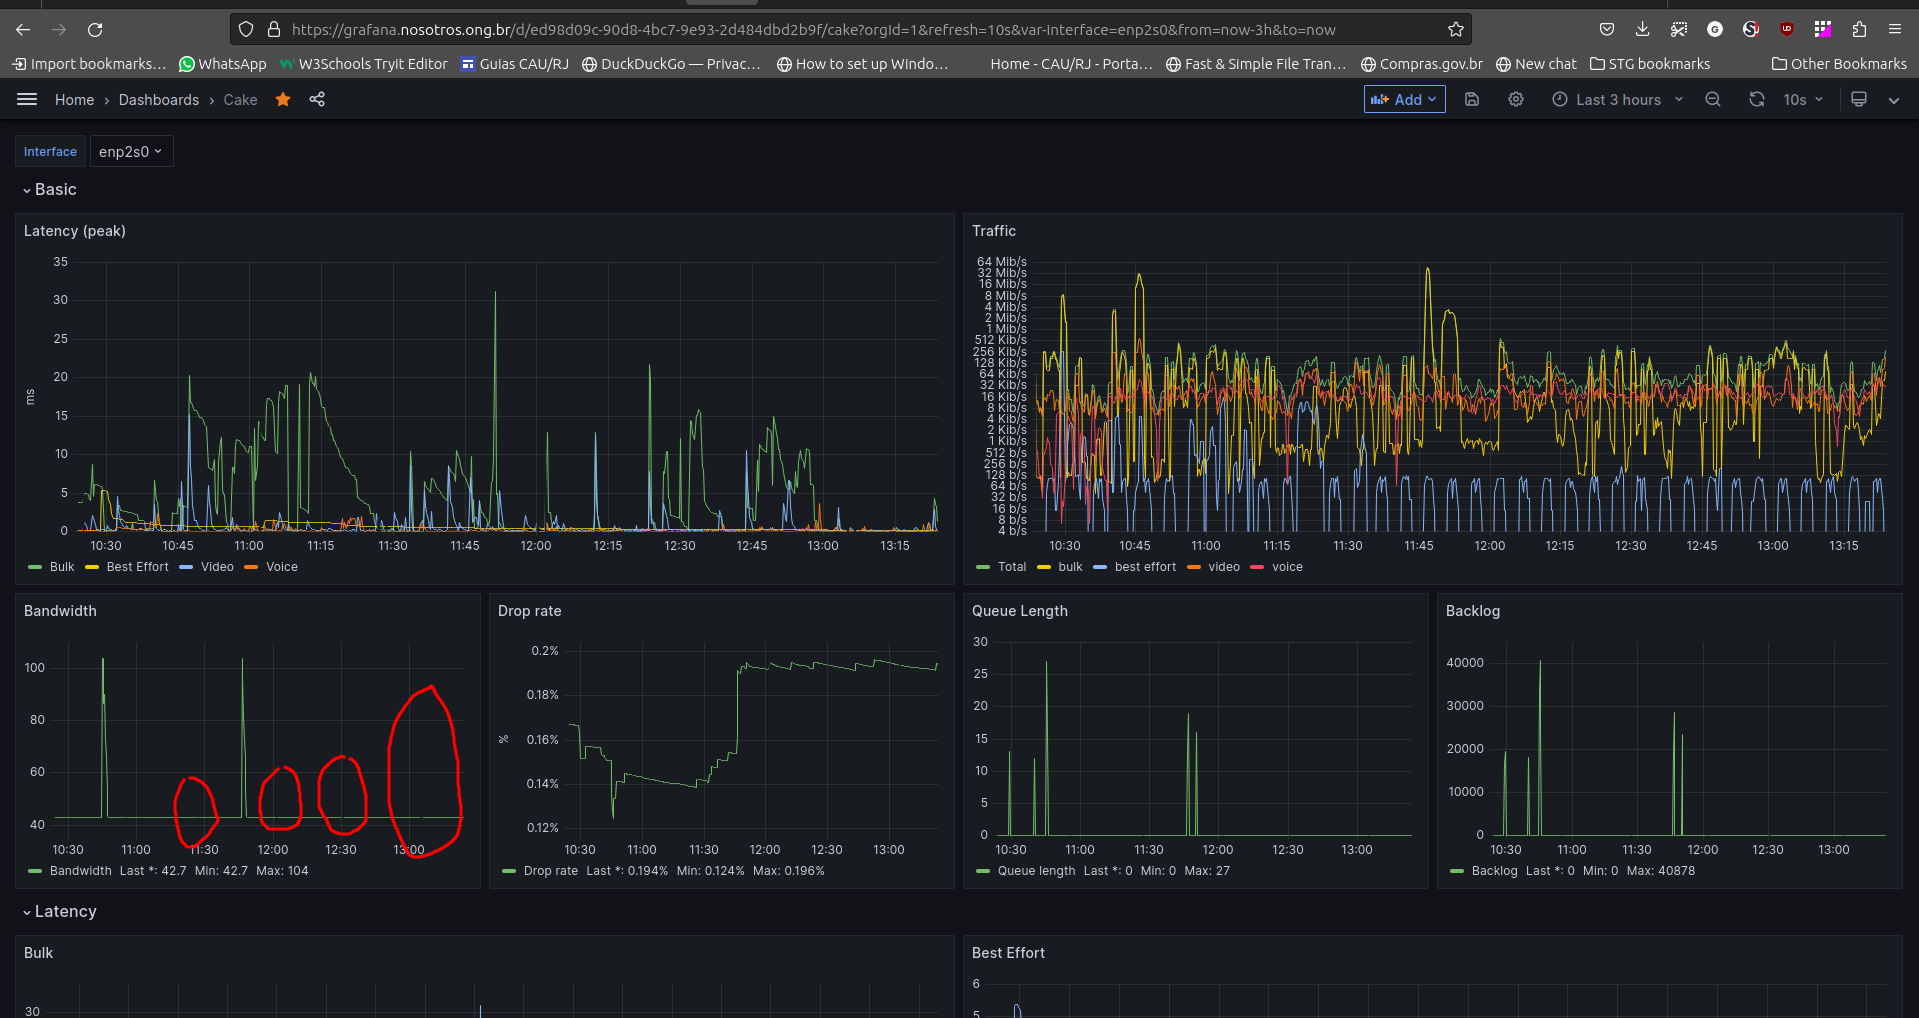
This approach is only a workaround, but as soon as I have the time I'll try collectd again. The main issue here seems to be the api lack of robustness, which I think explains the small gaps in the graphs (see below)
1 Like
Hey @gadolf, would you be able to upload your script somewhere? Your Grafana Cake page is nice and I'm interested in setting up something similar. I like the way how you are showing the different traffic categories.
Hey @rb1 , sure, I can share the script. I'm currently at work and just came to realize that my wireguard tunnel to my server is down ![]() so I can only share it lately.
so I can only share it lately.
Meanwhile, shouldn't we split this discussion into a new thread, or even proceed from the SQM Reporting thread, where it suits better?
EDIT: @rb1 In case you want to start something without waiting for my script, I can advance some details:
- The script reads the json output from tc -s -j qdisc dev ...., then it uses jq to save each metric into a small file named the same as the metric. So, at each run, it updates the files bytes, bandwidth, drops and so on. I set it to run each 10 seconds as a systemd process, started by a timer. Warning: for each metric a jq execution, so the script isn't exactly resource friendly;
- I created some extended snmp oid's, one for each metric. Each oid is obtained simply by cat the metrics files;
- In collectd, I use the snmp plugin, and set it up with all metrics oid's.
By the way, there are two servers (x86/64) involved here: the router (where the script and snmp runs) and the grafana/prometheus/collectd server.
After starting all this, I noticed an increase in the router CPU usage from around 1% to 8%, mainly due to the script running each 10 seconds, as well as snmp being called (by collectd) each 10 seconds.
This is a messy setup, I recognize, but like I said before, I took the script + snmp processes that were already running as collectors for my now dead Cacti monitoring. It can certainly be improved and simplified. But since I have spare resources in the router, I kinda relaxed (well... maybe I should look closely to the energy bill...)
2 Likes
ok, here's the script that pulls cake metrics on the router.
This one is for upstream. There's another one for pulling downstream metrics.
#!/bin/bash

/sbin/tc -s -j qdisc show dev enp2s0 > /tmp/cakeup

cat /tmp/cakeup | jq '.[].backlog' > /etc/snmp/cakeresults/backlogup
cat /tmp/cakeup | jq '.[].bytes' > /etc/snmp/cakeresults/bytesup
cat /tmp/cakeup | jq '.[].packets' > /etc/snmp/cakeresults/packetsup
cat /tmp/cakeup | jq '.[].qlen' > /etc/snmp/cakeresults/qlenup
cat /tmp/cakeup | jq '.[].drops' > /etc/snmp/cakeresults/dropsup
cat /tmp/cakeup | jq '.[].options.bandwidth' > /etc/snmp/cakeresults/bandwidthup

# bulk
cat /tmp/cakeup | jq '.[].tins[0].target_us' > /etc/snmp/cakeresults/0targetup
cat /tmp/cakeup | jq '.[].tins[0].peak_delay_us' > /etc/snmp/cakeresults/0peak_delayup
cat /tmp/cakeup | jq '.[].tins[0].avg_delay_us' > /etc/snmp/cakeresults/0avg_delayup
cat /tmp/cakeup | jq '.[].tins[0].base_delay_us' > /etc/snmp/cakeresults/0base_delayup
cat /tmp/cakeup | jq '.[].tins[0].drops' > /etc/snmp/cakeresults/0dropsup
cat /tmp/cakeup | jq '.[].tins[0].ecn_mark' > /etc/snmp/cakeresults/0ecn_markup
cat /tmp/cakeup | jq '.[].tins[0].sparse_flows' > /etc/snmp/cakeresults/0sparse_flowsup
cat /tmp/cakeup | jq '.[].tins[0].bulk_flows' > /etc/snmp/cakeresults/0bulk_flowsup
cat /tmp/cakeup | jq '.[].tins[0].unresponsive_flows' > /etc/snmp/cakeresults/0unresponsive_flowsup
cat /tmp/cakeup | jq '.[].tins[0].sent_bytes' > /etc/snmp/cakeresults/0sent_bytesup
# best effort
cat /tmp/cakeup | jq '.[].tins[1].target_us' > /etc/snmp/cakeresults/1targetup
cat /tmp/cakeup | jq '.[].tins[1].peak_delay_us' > /etc/snmp/cakeresults/1peak_delayup
cat /tmp/cakeup | jq '.[].tins[1].avg_delay_us' > /etc/snmp/cakeresults/1avg_delayup
cat /tmp/cakeup | jq '.[].tins[1].base_delay_us' > /etc/snmp/cakeresults/1base_delayup
cat /tmp/cakeup | jq '.[].tins[1].drops' > /etc/snmp/cakeresults/1dropsup
cat /tmp/cakeup | jq '.[].tins[1].ecn_mark' > /etc/snmp/cakeresults/1ecn_markup
cat /tmp/cakeup | jq '.[].tins[1].sparse_flows' > /etc/snmp/cakeresults/1sparse_flowsup
cat /tmp/cakeup | jq '.[].tins[1].bulk_flows' > /etc/snmp/cakeresults/1bulk_flowsup
cat /tmp/cakeup | jq '.[].tins[1].unresponsive_flows' > /etc/snmp/cakeresults/1unresponsive_flowsup
cat /tmp/cakeup | jq '.[].tins[1].sent_bytes' > /etc/snmp/cakeresults/1sent_bytesup
# video
cat /tmp/cakeup | jq '.[].tins[2].target_us' > /etc/snmp/cakeresults/2targetup
cat /tmp/cakeup | jq '.[].tins[2].peak_delay_us' > /etc/snmp/cakeresults/2peak_delayup
cat /tmp/cakeup | jq '.[].tins[2].avg_delay_us' > /etc/snmp/cakeresults/2avg_delayup
cat /tmp/cakeup | jq '.[].tins[2].base_delay_us' > /etc/snmp/cakeresults/2base_delayup
cat /tmp/cakeup | jq '.[].tins[2].drops' > /etc/snmp/cakeresults/2dropsup
cat /tmp/cakeup | jq '.[].tins[2].ecn_mark' > /etc/snmp/cakeresults/2ecn_markup
cat /tmp/cakeup | jq '.[].tins[2].sparse_flows' > /etc/snmp/cakeresults/2sparse_flowsup
cat /tmp/cakeup | jq '.[].tins[2].bulk_flows' > /etc/snmp/cakeresults/2bulk_flowsup
cat /tmp/cakeup | jq '.[].tins[2].unresponsive_flows' > /etc/snmp/cakeresults/2unresponsive_flowsup
cat /tmp/cakeup | jq '.[].tins[2].sent_bytes' > /etc/snmp/cakeresults/2sent_bytesup
# voice
cat /tmp/cakeup | jq '.[].tins[3].target_us' > /etc/snmp/cakeresults/3targetup
cat /tmp/cakeup | jq '.[].tins[3].peak_delay_us' > /etc/snmp/cakeresults/3peak_delayup
cat /tmp/cakeup | jq '.[].tins[3].avg_delay_us' > /etc/snmp/cakeresults/3avg_delayup
cat /tmp/cakeup | jq '.[].tins[3].base_delay_us' > /etc/snmp/cakeresults/3base_delayup
cat /tmp/cakeup | jq '.[].tins[3].drops' > /etc/snmp/cakeresults/3dropsup
cat /tmp/cakeup | jq '.[].tins[3].ecn_mark' > /etc/snmp/cakeresults/3ecn_markup
cat /tmp/cakeup | jq '.[].tins[3].sparse_flows' > /etc/snmp/cakeresults/3sparse_flowsup
cat /tmp/cakeup | jq '.[].tins[3].bulk_flows' > /etc/snmp/cakeresults/3bulk_flowsup
cat /tmp/cakeup | jq '.[].tins[3].unresponsive_flows' > /etc/snmp/cakeresults/3unresponsive_flowsup
cat /tmp/cakeup | jq '.[].tins[3].sent_bytes' > /etc/snmp/cakeresults/3sent_bytesup

#cat /tmp/cakeupout | tr '\r\n' ' '  && echo " "  > /tmp/cakeupout

#cat /tmp/cakeupout | sed -i 's/null/0/' /tmp/cakeupout

#cat /tmp/cakeupout
(I'm really embarassed to share this dumb, inefficient piece of code ...)
Having all these small files available, then a correctly configured snmp daemon is able to deliver them whenever needed:
(excerpt from /etc/snmpd.conf)
###############################################################################
#
#  EXTENDING THE AGENT
#

#
#  Arbitrary extension commands
#
# sqm down
extend backlog /bin/cat /etc/snmp/cakeresults/backlog
extend bandwidth /bin/cat /etc/snmp/cakeresults/bandwidth
extend drops /bin/cat /etc/snmp/cakeresults/drops
extend bytes /bin/cat /etc/snmp/cakeresults/bytes
extend packets /bin/cat /etc/snmp/cakeresults/packets
extend qlen /bin/cat /etc/snmp/cakeresults/qlen
# sqm down - bulk
extend 0target /bin/cat /etc/snmp/cakeresults/0target
extend 0peak_delay /bin/cat /etc/snmp/cakeresults/0peak_delay
extend 0avg_delay /bin/cat /etc/snmp/cakeresults/0avg_delay
extend 0base_delay /bin/cat /etc/snmp/cakeresults/0base_delay
extend 0drops /bin/cat /etc/snmp/cakeresults/0drops
extend 0ecn_mark /bin/cat /etc/snmp/cakeresults/0ecn_mark
extend 0sparse_flows /bin/cat /etc/snmp/cakeresults/0sparse_flows
extend 0bulk_flows /bin/cat /etc/snmp/cakeresults/0bulk_flows
extend 0unresponsive_flows /bin/cat /etc/snmp/cakeresults/0unresponsive_flows
extend 0sent_bytes /bin/cat /etc/snmp/cakeresults/0sent_bytes
# sqm down - best_effort
extend 1target /bin/cat /etc/snmp/cakeresults/1target
extend 1peak_delay /bin/cat /etc/snmp/cakeresults/1peak_delay
extend 1avg_delay /bin/cat /etc/snmp/cakeresults/1avg_delay
extend 1base_delay /bin/cat /etc/snmp/cakeresults/1base_delay
extend 1drops /bin/cat /etc/snmp/cakeresults/1drops
extend 1ecn_mark /bin/cat /etc/snmp/cakeresults/1ecn_mark
extend 1sparse_flows /bin/cat /etc/snmp/cakeresults/1sparse_flows
extend 1bulk_flows /bin/cat /etc/snmp/cakeresults/1bulk_flows
extend 1unresponsive_flows /bin/cat /etc/snmp/cakeresults/1unresponsive_flows
extend 1sent_bytes /bin/cat /etc/snmp/cakeresults/1sent_bytes
# sqm down - video
extend 2target /bin/cat /etc/snmp/cakeresults/2target
extend 2peak_delay /bin/cat /etc/snmp/cakeresults/2peak_delay
extend 2avg_delay /bin/cat /etc/snmp/cakeresults/2avg_delay
extend 2base_delay /bin/cat /etc/snmp/cakeresults/2base_delay
extend 2drops /bin/cat /etc/snmp/cakeresults/2drops
extend 2ecn_mark /bin/cat /etc/snmp/cakeresults/2ecn_mark
extend 2sparse_flows /bin/cat /etc/snmp/cakeresults/2sparse_flows
extend 2bulk_flows /bin/cat /etc/snmp/cakeresults/2bulk_flows
extend 2unresponsive_flows /bin/cat /etc/snmp/cakeresults/2unresponsive_flows
extend 2sent_bytes /bin/cat /etc/snmp/cakeresults/2sent_bytes
# sqm down - voice
extend 3target /bin/cat /etc/snmp/cakeresults/3target
extend 3peak_delay /bin/cat /etc/snmp/cakeresults/3peak_delay
extend 3avg_delay /bin/cat /etc/snmp/cakeresults/3avg_delay
extend 3base_delay /bin/cat /etc/snmp/cakeresults/3base_delay
extend 3drops /bin/cat /etc/snmp/cakeresults/3drops
extend 3ecn_mark /bin/cat /etc/snmp/cakeresults/3ecn_mark
extend 3sparse_flows /bin/cat /etc/snmp/cakeresults/3sparse_flows
extend 3bulk_flows /bin/cat /etc/snmp/cakeresults/3bulk_flows
extend 3unresponsive_flows /bin/cat /etc/snmp/cakeresults/3unresponsive_flows
extend 3sent_bytes /bin/cat /etc/snmp/cakeresults/3sent_bytes
#sqm up
extend backlogup /bin/cat /etc/snmp/cakeresults/backlogup
extend bandwidthup /bin/cat /etc/snmp/cakeresults/bandwidthup
extend dropsup /bin/cat /etc/snmp/cakeresults/dropsup
extend bytesup /bin/cat /etc/snmp/cakeresults/bytesup
extend packetsup /bin/cat /etc/snmp/cakeresults/packetsup
extend qlenup /bin/cat /etc/snmp/cakeresults/qlenup
#sqm up - bulk
extend 0targetup /bin/cat /etc/snmp/cakeresults/0targetup
extend 0peak_delayup /bin/cat /etc/snmp/cakeresults/0peak_delayup
extend 0avg_delayup /bin/cat /etc/snmp/cakeresults/0avg_delayup
extend 0base_delayup /bin/cat /etc/snmp/cakeresults/0base_delayup
extend 0dropsup /bin/cat /etc/snmp/cakeresults/0dropsup
extend 0ecn_markup /bin/cat /etc/snmp/cakeresults/0ecn_markup
extend 0sparse_flowsup /bin/cat /etc/snmp/cakeresults/0sparse_flowsup
extend 0bulk_flowsup /bin/cat /etc/snmp/cakeresults/0bulk_flowsup
extend 0unresponsive_flowsup /bin/cat /etc/snmp/cakeresults/0unresponsive_flowsup
extend 0sent_bytesup /bin/cat /etc/snmp/cakeresults/0sent_bytesup
#sqm up - best effort
extend 1targetup /bin/cat /etc/snmp/cakeresults/1targetup
extend 1peak_delayup /bin/cat /etc/snmp/cakeresults/1peak_delayup
extend 1avg_delayup /bin/cat /etc/snmp/cakeresults/1avg_delayup
extend 1base_delayup /bin/cat /etc/snmp/cakeresults/1base_delayup
extend 1dropsup /bin/cat /etc/snmp/cakeresults/1dropsup
extend 1ecn_markup /bin/cat /etc/snmp/cakeresults/1ecn_markup
extend 1sparse_flowsup /bin/cat /etc/snmp/cakeresults/1sparse_flowsup
extend 1bulk_flowsup /bin/cat /etc/snmp/cakeresults/1bulk_flowsup
extend 1unresponsive_flowsup /bin/cat /etc/snmp/cakeresults/1unresponsive_flowsup
extend 1sent_bytesup /bin/cat /etc/snmp/cakeresults/1sent_bytesup
#sqm up - video
extend 2targetup /bin/cat /etc/snmp/cakeresults/2targetup
extend 2peak_delayup /bin/cat /etc/snmp/cakeresults/2peak_delayup
extend 2avg_delayup /bin/cat /etc/snmp/cakeresults/2avg_delayup
extend 2base_delayup /bin/cat /etc/snmp/cakeresults/2base_delayup
extend 2dropsup /bin/cat /etc/snmp/cakeresults/2dropsup
extend 2ecn_markup /bin/cat /etc/snmp/cakeresults/2ecn_markup
extend 2sparse_flowsup /bin/cat /etc/snmp/cakeresults/2sparse_flowsup
extend 2bulk_flowsup /bin/cat /etc/snmp/cakeresults/2bulk_flowsup
extend 2unresponsive_flowsup /bin/cat /etc/snmp/cakeresults/2unresponsive_flowsup
extend 2sent_bytesup /bin/cat /etc/snmp/cakeresults/2sent_bytesup
#sqm up - voice
extend 3targetup /bin/cat /etc/snmp/cakeresults/3targetup
extend 3peak_delayup /bin/cat /etc/snmp/cakeresults/3peak_delayup
extend 3avg_delayup /bin/cat /etc/snmp/cakeresults/3avg_delayup
extend 3base_delayup /bin/cat /etc/snmp/cakeresults/3base_delayup
extend 3dropsup /bin/cat /etc/snmp/cakeresults/3dropsup
extend 3ecn_markup /bin/cat /etc/snmp/cakeresults/3ecn_markup
extend 3sparse_flowsup /bin/cat /etc/snmp/cakeresults/3sparse_flowsup
extend 3bulk_flowsup /bin/cat /etc/snmp/cakeresults/3bulk_flowsup
extend 3unresponsive_flowsup /bin/cat /etc/snmp/cakeresults/3unresponsive_flowsup
extend 3sent_bytesup /bin/cat /etc/snmp/cakeresults/3sent_bytesup
Again, still embarrased, because there's certainly a clever way of configure oid's.
This ends the router side.
On the monitor server side, collectd snmp plugin is configured to issue snmpgets (or walks, not sure) to finally pull the metrics:
<Plugin snmp>
#	<Data "powerplus_voltge_input">
#		Type "voltage"
#		Table false
#		Instance "input_line1"
#		Scale 0.1
#		Values "SNMPv2-SMI::enterprises.6050.5.4.1.1.2.1"
#	</Data>
#	<Data "hr_users">
#		Type "users"
#		Table false
#		Instance ""
#		Shift -1
#		Values "HOST-RESOURCES-MIB::hrSystemNumUsers.0"
#	</Data>
#	<Data "std_traffic">
#		Type "if_octets"
#		Table true
#		InstancePrefix "traffic"
#		Instance "IF-MIB::ifDescr"
#		Values "IF-MIB::ifInOctets" "IF-MIB::ifOutOctets"
#	</Data>
#	Cake - Down
	<Data "cake_bandwidth">
		Type  "cake_bandwidth"
		Table false
		TypeInstance ""
		Values "NET-SNMP-EXTEND-MIB::nsExtendOutput1Line.\"bandwidth\""
	</Data>
        <Data "cake_drops">
                Type  "cake_drops"
                Table false
                TypeInstance ""
                Values "NET-SNMP-EXTEND-MIB::nsExtendOutput1Line.\"drops\""
        </Data>
        <Data "cake_bytes">
                Type  "cake_bytes"
                Table false
                TypeInstance ""
                Values "NET-SNMP-EXTEND-MIB::nsExtendOutput1Line.\"bytes\""
        </Data>
        <Data "cake_packets">
                Type  "cake_packets"
                Table false
                TypeInstance ""
                Values "NET-SNMP-EXTEND-MIB::nsExtendOutput1Line.\"packets\""
        </Data>
        <Data "cake_backlog">
                Type  "cake_backlog"
                Table false
                TypeInstance ""
                Values "NET-SNMP-EXTEND-MIB::nsExtendOutput1Line.\"backlog\""
        </Data>
        <Data "cake_qlen">
                Type  "cake_qlen"
                Table false
                TypeInstance ""
                Values "NET-SNMP-EXTEND-MIB::nsExtendOutput1Line.\"qlen\""
        </Data>
#       Cake - Up
        <Data "cake_bandwidthup">
                Type  "cake_bandwidthup"
                Table false
                TypeInstance ""
                Values "NET-SNMP-EXTEND-MIB::nsExtendOutput1Line.\"bandwidthup\""
        </Data>
        <Data "cake_dropsup">
                Type  "cake_dropsup"
                Table false
                TypeInstance ""
                Values "NET-SNMP-EXTEND-MIB::nsExtendOutput1Line.\"dropsup\""
        </Data>
        <Data "cake_bytesup">
                Type  "cake_bytesup"
                Table false
                TypeInstance ""
                Values "NET-SNMP-EXTEND-MIB::nsExtendOutput1Line.\"bytesup\""
        </Data>
        <Data "cake_packetsup">
                Type  "cake_packetsup"
                Table false
                TypeInstance ""
                Values "NET-SNMP-EXTEND-MIB::nsExtendOutput1Line.\"packetsup\""
        </Data>
        <Data "cake_backlogup">
                Type  "cake_backlogup"
                Table false
                TypeInstance ""
                Values "NET-SNMP-EXTEND-MIB::nsExtendOutput1Line.\"backlogup\""
        </Data>
        <Data "cake_qlenup">
                Type  "cake_qlenup"
                Table false
                TypeInstance ""
                Values "NET-SNMP-EXTEND-MIB::nsExtendOutput1Line.\"qlenup\""
        </Data>
        <Data "cake_0target">
                Type  "cake_0target"
                Table false
                TypeInstance ""
                Values "NET-SNMP-EXTEND-MIB::nsExtendOutput1Line.\"0target\""
        </Data>
        <Data "cake_0targetup">
                Type  "cake_0targetup"
                Table false
                TypeInstance ""
                Values "NET-SNMP-EXTEND-MIB::nsExtendOutput1Line.\"0targetup\""
        </Data>
        <Data "cake_1target">
                Type  "cake_1target"
                Table false
                TypeInstance ""
                Values "NET-SNMP-EXTEND-MIB::nsExtendOutput1Line.\"1target\""
        </Data>
        <Data "cake_1targetup">
                Type  "cake_1targetup"
                Table false
                TypeInstance ""
                Values "NET-SNMP-EXTEND-MIB::nsExtendOutput1Line.\"1targetup\""
        </Data>
        <Data "cake_2target">
                Type  "cake_2target"
                Table false
                TypeInstance ""
                Values "NET-SNMP-EXTEND-MIB::nsExtendOutput1Line.\"2target\""
        </Data>
        <Data "cake_2targetup">
                Type  "cake_2targetup"
                Table false
                TypeInstance ""
                Values "NET-SNMP-EXTEND-MIB::nsExtendOutput1Line.\"2targetup\""
        </Data>
        <Data "cake_3target">
                Type  "cake_3target"
                Table false
                TypeInstance ""
                Values "NET-SNMP-EXTEND-MIB::nsExtendOutput1Line.\"3target\""
        </Data>
        <Data "cake_3targetup">
                Type  "cake_3targetup"
                Table false
                TypeInstance ""
                Values "NET-SNMP-EXTEND-MIB::nsExtendOutput1Line.\"3targetup\""
        </Data>
        <Data "cake_0peak_delay">
                Type  "cake_0peak_delay"
                Table false
                TypeInstance ""
                Values "NET-SNMP-EXTEND-MIB::nsExtendOutput1Line.\"0peak_delay\""
        </Data>
        <Data "cake_0peak_delayup">
                Type  "cake_0peak_delayup"
                Table false
                TypeInstance ""
                Values "NET-SNMP-EXTEND-MIB::nsExtendOutput1Line.\"0peak_delayup\""
        </Data>
        <Data "cake_1peak_delay">
                Type  "cake_1peak_delay"
                Table false
                TypeInstance ""
                Values "NET-SNMP-EXTEND-MIB::nsExtendOutput1Line.\"1peak_delay\""
        </Data>
        <Data "cake_1peak_delayup">
                Type  "cake_1peak_delayup"
                Table false
                TypeInstance ""
                Values "NET-SNMP-EXTEND-MIB::nsExtendOutput1Line.\"1peak_delayup\""
        </Data>
(there's more in here but I ommited because the post is already too long)

#
#	<Host "some.switch.mydomain.org">
#		Address "192.168.0.2"
#		Version 1
#		Community "community_string"
#		Collect "std_traffic"
#		Inverval 120
#		Timeout 10
#		Retries 1
#	</Host>
	<Host "srv.nosotros.ong.br">
		Address "192.168.1.1"
		Version 2
		Community "public"
		Collect "cake_bandwidth" "cake_drops" "cake_bytes" "cake_packets" "cake_backlog" "cake_qlen" \
                        "cake_bandwidthup" "cake_dropsup" "cake_bytesup" "cake_packetsup" "cake_backlogup" "cake_qlenup" \
                        "cake_0target" "cake_0targetup" "cake_1target" "cake_1targetup" "cake_2target" "cake_2targetup" "cake_3target" "cake_3targetup" \
                        "cake_0peak_delay" "cake_0peak_delayup"  "cake_1peak_delay" "cake_1peak_delayup"  "cake_2peak_delay" "cake_2peak_delayup"  "cake_3peak_delay" "cake_3peak_delayup" \
                        "cake_0avg_delay" "cake_0avg_delayup" "cake_1avg_delay" "cake_1avg_delayup" "cake_2avg_delay" "cake_2avg_delayup" "cake_3avg_delay" "cake_3avg_delayup" \
                        "cake_0base_delay" "cake_0base_delayup"  "cake_1base_delay" "cake_1base_delayup"  "cake_2base_delay" "cake_2base_delayup"  "cake_3base_delay" "cake_3base_delayup" \
                        "cake_0drops" "cake_0dropsup"   "cake_1drops" "cake_1dropsup"   "cake_2drops" "cake_2dropsup"   "cake_3drops" "cake_3dropsup" \
                        "cake_0ecn_mark" "cake_0ecn_markup"  "cake_1ecn_mark" "cake_1ecn_markup"  "cake_2ecn_mark" "cake_2ecn_markup"  "cake_3ecn_mark" "cake_3ecn_markup" \
                        "cake_0sparse_flows" "cake_0sparse_flowsup"  "cake_1sparse_flows" "cake_1sparse_flowsup"  "cake_2sparse_flows" "cake_2sparse_flowsup"  "cake_3sparse_flows" "cake_3sparse_flowsup" \
                        "cake_0bulk_flows" "cake_0bulk_flowsup" "cake_1bulk_flows" "cake_1bulk_flowsup" "cake_2bulk_flows" "cake_2bulk_flowsup" "cake_3bulk_flows" "cake_3bulk_flowsup" \
                        "cake_0unresponsive_flows" "cake_0unresponsive_flowsup" "cake_1unresponsive_flows" "cake_1unresponsive_flowsup" "cake_2unresponsive_flows" "cake_2unresponsive_flowsup" "cake_3unresponsive_flows" "cake_3unresponsive_flowsup" \
                        "cake_0sent_bytes" "cake_0sent_bytesup" "cake_1sent_bytes" "cake_1sent_bytesup" "cake_2sent_bytes" "cake_2sent_bytesup" "cake_3sent_bytes" "cake_3sent_bytesup"
The part where prometheus grabs data from collectd, I believe, is not an issue to you.
1 Like
Hi @gadolf, thanks for taking the time explaining in detail how you get the data into prometheus. Very interesting. When I get some time, see if I can set up something similar in Grafana.
Thanks for pointing me towards the SQM Reporting thread. Yeah I guess this could be split into a different thread, it is a bit off topic, I haven't explored this forum much beyond this topic.
One more question, just curious with your cake setup, looks like you have 4 tins: bulk, best effort, video and voice. I'm happy with the built in piece of cake with the one tin but if I use layer_cake.qos or simple.qos, tins I get are bulk, best effort and voice. What do you use to get the video tin?
Hello!
I use diffserv4 (you're probably using diffserv3)
See my sqm conf file
gustavo@srv:/etc/sqm$ cat enp2s0.iface.conf
# Default SQM config; the variables defined here will be applied to all
# interfaces. To override values for a particular interface, copy this file to
# <dev>.iface.conf (e.g., "eth0.iface.conf" for eth0).
#
# When using ifupdown, the interface config file needs to exist for sqm-scripts
# to be activated on that interface. However, these defaults are still applied,
# so the interface config can be empty.

# Uplink and Downlink values are in kbps
#UPLINK=9000
#UPLINK=37000
UPLINK=85000
#DOWNLINK=270000
DOWNLINK=450000

# SQM recipe to use. For more information, see /usr/lib/sqm/*.help
#SCRIPT=piece_of_cake.qos
SCRIPT=layer_cake.qos

# Optional/advanced config

ENABLED=1
QDISC=cake

#LLAM=tc_stab
LINKLAYER=ethernet
OVERHEAD=22
#STAB_MTU=2047
#STAB_TSIZE=512
STAB_MPU=64

#ILIMIT=
#ELIMIT=
#ITARGET=
#ETARGET=

# ECN ingress resp. egress. Values are ECN or NOECN.
IECN=ECN
EECN=ECN

# Extra qdisc options ingress resp. egress
IQDISC_OPTS="diffserv4 nat dual-dsthost"
#EQDISC_OPTS="diffserv4 nat dual-srchost ack-filter"
EQDISC_OPTS="diffserv4 nat dual-srchost"

# CoDel target
#TARGET=5ms

#ZERO_DSCP_INGRESS=1
#IGNORE_DSCP_INGRESS=1
As for the whole grafana/prometheus/collectd setting, I was thinking that if you use a single machine, there's no need to bring snmp into the equation, and just use collectd_exec plugin, as proposed in that thread I pointed before.
I would probably be able to also eliminate snmp from my setup. All I had to do is installing collectd in the router machine and have prometheus on the monitor machine pointing to collectd url. Maybe I'll do that soon.
Please, remember: All this setup is under Debian machines, not Openwrt.
Ok thanks. SQM and cake is something I want to learn more about.
I'm thinking about making another python prometheus exporter starting off with the json values in your first script. I've played around with collectd a long time ago, (I know there is the collectd-mod-sqm package) but had some troubles with collectd exporter getting data from it into Prometheus. I believe there is another way using collectd to influx then grafana but haven't tested that yet. Looks like in that SQM reporting thread, there are some nice grafana plots using collectd-influx.
1 Like
Just tried to install via the method defined on the Github readme page, it looks like I am getting a 404 error when running the following command:
wget -O /tmp/cake-autorate_setup.sh https://raw.githubusercontent.com/lynxthecat/CAKE-autorate/stable/cake-autorate-setup.sh
Is it just me?
Can't tell, I typically do a separate git clone/pull on a separate machine, look at the scripts and manually copy them to my router, so I never tried the installation script. But maybe open a new issue on the github page, so you get the developr's attention to the issue?
Typo in the name? Works for me from here:
https://raw.githubusercontent.com/lynxthecat/cake-autorate/stable/cake-autorate_setup.sh
That did it - the URL is case sensitive. The correct command is as follows:
wget -O /tmp/cake-autorate_setup.sh https://raw.githubusercontent.com/lynxthecat/cake-autorate/stable/cake-autorate_setup.sh
Alright, got it installed, but for some reason the script refuses to function if I want to run QOS for both download and upload.
Surely this is a bug with the script? This is the error message I get:
download interface and upload interface are both set to: 'usb0', but cannot be the same. Exiting script.
Not sure who has download and upload split across two interfaces, that seems like a really rare and overly complex setup.