Interesting observation. Could it be a bad/loose cable or dying NIC?
You might want to look into using irtt to measure OWDs and then see which side blows up during your Desktop tests...
irtt client -d 10s -i 100ms netperf-eu.bufferbloat.net -o irtt.out.json.gz
This is a privately run and financed server, so please treat it respectfully, and never for any automated routine measurements...
I would first run the irtt test without any load to establish a baseline, and then repeat this while loading the link from the desktop (just make the capacity test duration longer than the irtt test, so you first start the capacity test, then the irtt test, and have the irtt test finish before the capacity test...)
Have a look here:
to get a quick tour on reading these graphs
Great tool! Is impressive the amount of good resources produced by the bufferbloat project! Don't worry about the server, I had just performed a couple of manual tests with irtt tool.
Anyway, I performed the OWD measurements, executing the irtt from the openwrt router, and the results points that only the send side is bloated, while the receive side doesn't have any significate change. Does it means that the downstream path is getting more bloated, right? And much more from desktop traffic than from mobile traffic, at the point that it forces the autorate scripts to cap the bandwidth in a attempt to reduce the bloat. Another interesting observation is that when the upstream band is loaded the send delay is equally bloated in mobile and desktop tests.
The tests summary is below:
I don't think so, because in the iperf3 tests between router and desktop I got quite good results (the results are above in the thread), the only strange thing was the packet loss of 0.24%, but it also doesn't seems too much. I also switched the cables in the router, switched ports to the same port used in the Wireless AP but nothing really changed.
@moeller0 Thanks for the chart analysis guide. I took some hours today to dive into them.
See some additional stuffs that I discovered in the tcp dumps and charts, I'm not sure if these observations makes sense, so takes them with a grain of salt.
TCP Windows updates:
Desktop TCP stream has a lot of windows updates: In a 10 second dump, the desktop sent 1700 (1.5%) windows updates, while mobile just sent 2 (0%).
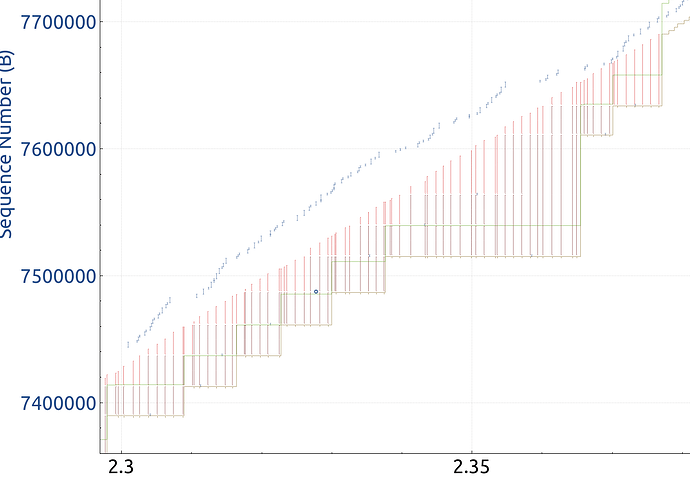
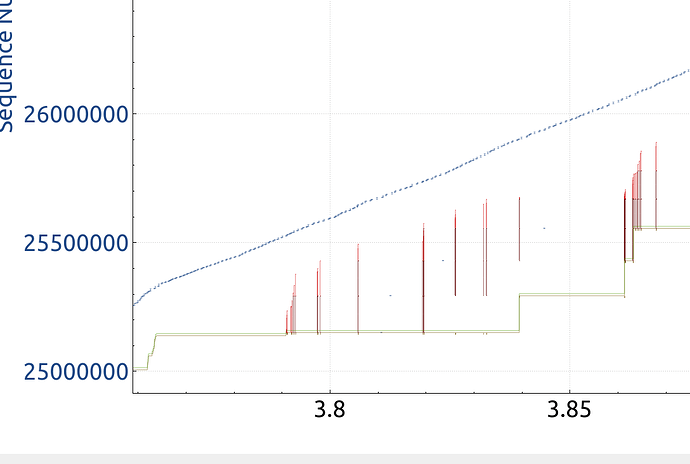
Here I also found that the mobile receive window line (green) is very close to the ACK (yellow) line, while in the desktop the receive window line (green) has some buffer from ACK (yellow) line. One thing that I could not understand is why the green line is not above the tcp segments line, in almost all tutorials they teaches that it is usually the case?
From tcptrace chart, I could easily see that the ACKs (yellow) takes a lot of times to arrive, and arrives in batch (distance from tcp segments (blue) increasing from ACK (yellow) line, and the line is flat many times). This behavior is the same for mobile and desktop, however:
SACKs packets
Here is the desktop stream zoom from tcptrace chart, we can see that a lot of SACKs are sent, this behavior repeats through the whole stream.Counting them in wireshark I got the following figures:
- Desktop sends more SACKs packets than mobile, 18% vs 9% of total dump packets. I have used the filter
tcp.options.sack.count
While in the mobile the SACKs also appear but fewer and less frequently than desktop stream as we confirm from the mobile stream zoom below.
For me that do not understand so much these stuffs, I had this theory here: seems that the mobile waits more before start to send SACKs, while the desktop connection is more impatient and soon as the ACKs is too much delayed it starts to send several SACKs asking for retransmissions.
Excellent! BTW, it is not my server, but the logic still holds. @dtaht had deployed a number of measurement servers and was quite generous with allowing folks to use those, but that got abused quickly for automated measurements ramping up unacceptable costs, at least that is my recollection...
Reminds me to set up my own irtt server at home to share in situations like this, not to stress others' donated resources.
Regarding your results, the EU server is quite far away from your location, so not a terrible suitable reflector...
This morning I set up an irtt server in South America cloud datacenter to use and the overall conclusion seems similar from the EU tests, so the send side (downstream path) is the villain. See below:
Hmm. I really don't get why it makes a difference whether you use desktop or mobile. But the cake-autorate data and all your other tests confirm this. And it doesn't seem to be your LAN network throughput capability since that seems to well exceed your WAN throughput capability. I was unable to follow the Wireshark aspects, but I assume @moeller0 has not identified anything from this post:
Yeah, this is a very intriguing problem. I tried a lot of things but I still don't have any idea about what could be causing it, my only suspect is that the TCP stack from ubuntu is somehow causing it, so in the next week I will try to benchmark with other devices and OSes (notebooks wired and wifi, other smartphones, macbook, windows OS) to see what happens.
ubuntu may have a bug in enabling fq_codel locally. tc -s qdisc show should show fq_codel on the ethernet and noqueue on the wifi.
PS, I so love seeing other people using tcp trace and wireshark. Not that I have the braincells to chip in this morning.
Another interesting thing that happened, I flashed openwrt in my dumb AP (AX3200) and after that the mobile is also getting very similar results in comparison with desktop, maybe is related to the offloading features that maybe is already tuned in the stock firmware, I'm not sure. I tried to play with WED and offloading in Openwrt but nothing really changed, also the CPU usage kept in the same levels ~50%, with or without WED and HW offloading. But I also changed my topology completely, now I'm using VLANs to segment the traffic from guest, IOT and LAN, and maybe this also plays some role on these benchmarks.
I cant really understand how the ping starts to spikes, even when I reduced 90% of the bandwidth in cake, my ISP link is 250 mbps Us/25 mbps Ds.
So now I'm practically giving up the battle against the bloat! I will try to switch the ISP in the near future to see if I get better results.
Thanks for the hint @dtaht and by the podcast link, for sure I will watch. These days I'm studying a lot of networks and more content is very welcome.
If you live in an area where the temperature is changing and your ISP uses coax, it might be temperature causing irregularities: https://broadbandlibrary.com/long-loop-alc/ . I think that played a small part with my issues.
Interesting finding! I lives near the equator, and here the temperatures are quite stable overall, only ranging from 20~30 over the whole year and with a delta of 5~7º degrees in a same day.
Today I had the idea to perform a traceroute during a speedtest to see which is the first hop to bloat in the path. I performed the tests in bridge and NAT mode in the ISP router, in order to also detect the latency between openwrt router and ISP router.
The results belows seems to clearly indicates that the bloat is happening between my ISP router and the first hop. Therefore or my ISP router is still suffering bufferbloat or the first hop after my home is the villain, besides the attempts to control the bloat with Cake SQM.
Somebody knows I way to really confirm who is the responsible hop for this bloat? @moeller0, @Lynx or anybody else ?
nat mode
baseline traceroute to 1.1.1.1
traceroute to 1.1.1.1 (1.1.1.1), 30 hops max, 60 byte packets
 1  OpenWrt.lan (192.168.1.1)  0.371 ms  0.352 ms  0.399 ms
 2  192.168.0.1 (192.168.0.1)  6.968 ms  11.203 ms  2.809 ms
 3  ??.??.??.?? (??.??.??.??)  22.461 ms  22.292 ms  22.542 ms
 4  ??.??.??.?? (??.??.??.??)  26.510 ms  22.750 ms  25.833 ms
 5  ??.??.??.?? (??.??.??.??)  35.826 ms  26.634 ms  36.149 ms
 6  ??.??.??.?? (??.??.??.??)  35.960 ms  33.266 ms  33.133 ms
 7  one.one.one.one (1.1.1.1)  31.602 ms  31.592 ms  27.624 ms
loaded traceroute to 1.1.1.1
traceroute to 1.1.1.1 (1.1.1.1), 30 hops max, 60 byte packets
 1  OpenWrt.lan (192.168.1.1)  0.370 ms  0.403 ms  0.458 ms
 2  192.168.0.1 (192.168.0.1)  5.460 ms  14.451 ms  7.843 ms
 3  ??.??.??.?? (??.??.??.??)  71.436 ms  71.699 ms  98.338 ms
 4  ??.??.??.?? (??.??.??.??)  73.343 ms  73.619 ms  101.544 ms
 5  ??.??.??.?? (??.??.??.??)  101.856 ms  102.035 ms  73.490 ms
 6  ??.??.??.?? (??.??.??.??)  111.442 ms  110.076 ms  109.834 ms
 7  one.one.one.one (1.1.1.1)  97.937 ms  90.076 ms  90.763 ms
bridge mode
baseline traceroute to 1.1.1.1
traceroute to 1.1.1.1 (1.1.1.1), 30 hops max, 60 byte packets
 1  OpenWrt.lan (192.168.1.1)  0.372 ms  0.437 ms  0.346 ms
 2  ??.??.??.?? (??.??.??.??)  13.156 ms  21.936 ms  22.140 ms
 3  ??.??.??.?? (??.??.??.??)  23.335 ms  22.925 ms  23.444 ms
 4  ??.??.??.?? (??.??.??.??)  23.895 ms  22.620 ms  24.252 ms
 5  ??.??.??.??(??.??.??.??)  62.000 ms  63.047 ms  62.498 ms
 6  one.one.one.one (1.1.1.1)  20.181 ms  19.934 ms  19.400 ms
loaded traceroute to 1.1.1.1
traceroute to 1.1.1.1 (1.1.1.1), 30 hops max, 60 byte packets
 1  OpenWrt.lan (192.168.1.1)  0.210 ms  0.193 ms  0.187 ms
 2  ??.??.??.?? (??.??.??.??)  125.289 ms  124.532 ms  124.045 ms
 3  ??.??.??.?? (??.??.??.??)  127.392 ms  137.437 ms  127.381 ms
 4  ??.??.??.?? (??.??.??.??)  126.780 ms  136.930 ms  137.918 ms
 5  ??.??.??.?? (??.??.??.??)  125.626 ms  136.259 ms  136.582 ms
 6  one.one.one.one (1.1.1.1)  135.754 ms  134.026 ms  133.743 ms
So I think we should try forward and reverse mtr with and without load, to try to pinpoint the location of the delay somewhat more reliable. I am happy to offer my link as reflector and startingbpoint for the reverse mtr. That is not ideal, since I am far away, but it is easy to do, so why not. However that will need to wait as I am on my way to work....
@niltonvasques - If you are based in the United States or North America, I run several servers (Los Angeles, Chicago, Virginia, and NYC) where I could run an MTR to you as well if that would be helpful. If you could PM me your public IP address and which location you're closest to, I can provide you with one to test to and can coordinate testing with and without a load like is suggested. I think it'd be interesting to see what the results come back with.
Please try the following invocations (from both sides):
mtr -ezb4w -c 30 -o LSNBAWVJMXI ${THE.OTHER.SECRET.IP-ADDRESS}
Note that with -c 30 this will run for 30 seconds which might be too much for your speedtest duration, if so try to reduce the count or the interval for the mtr e.g. -i 0.5 for half a second (so -c 30will only run for 15 seconds) instead of a full second. But note you need to be root to do that and some reflectors will not be too happy and introduce their own delays...
If instead of a speedtest, you could initiate a number of parallel large downloads that last a bit longer that would make the 'take forward and reverse mtrs' during the same load event considerably simpler...
Thanks @RyanBlakeIT and @moeller0 , but I'm from Brazil, a little bit far, my AVG latency to US is around 120ms, so maybe is better for me to setup a cloud server near me to perform these tests.
Is that fine just use a VPS in a cloud like vultr for example?


