Bufferbloat persists with SQM enabled

Hello guys,

I'm trying to figure out why my bufferbloat is not mitigated with the SQM enabled on OpenWRT.

This is my current setup:

  • ISP Modem (Cable Modem Arris TG1692A) in Bridge Mode
  • MINI PC x86 with Intel J4125 (8GB RAM)
    • WAN eth0 -> ISP
    • eth1 -> Xiaomi Repeater
    • eth2 -> My Desktop PC
  • Xiaomi AX3200 AP in Repeater Mode (Smartphone connects here)

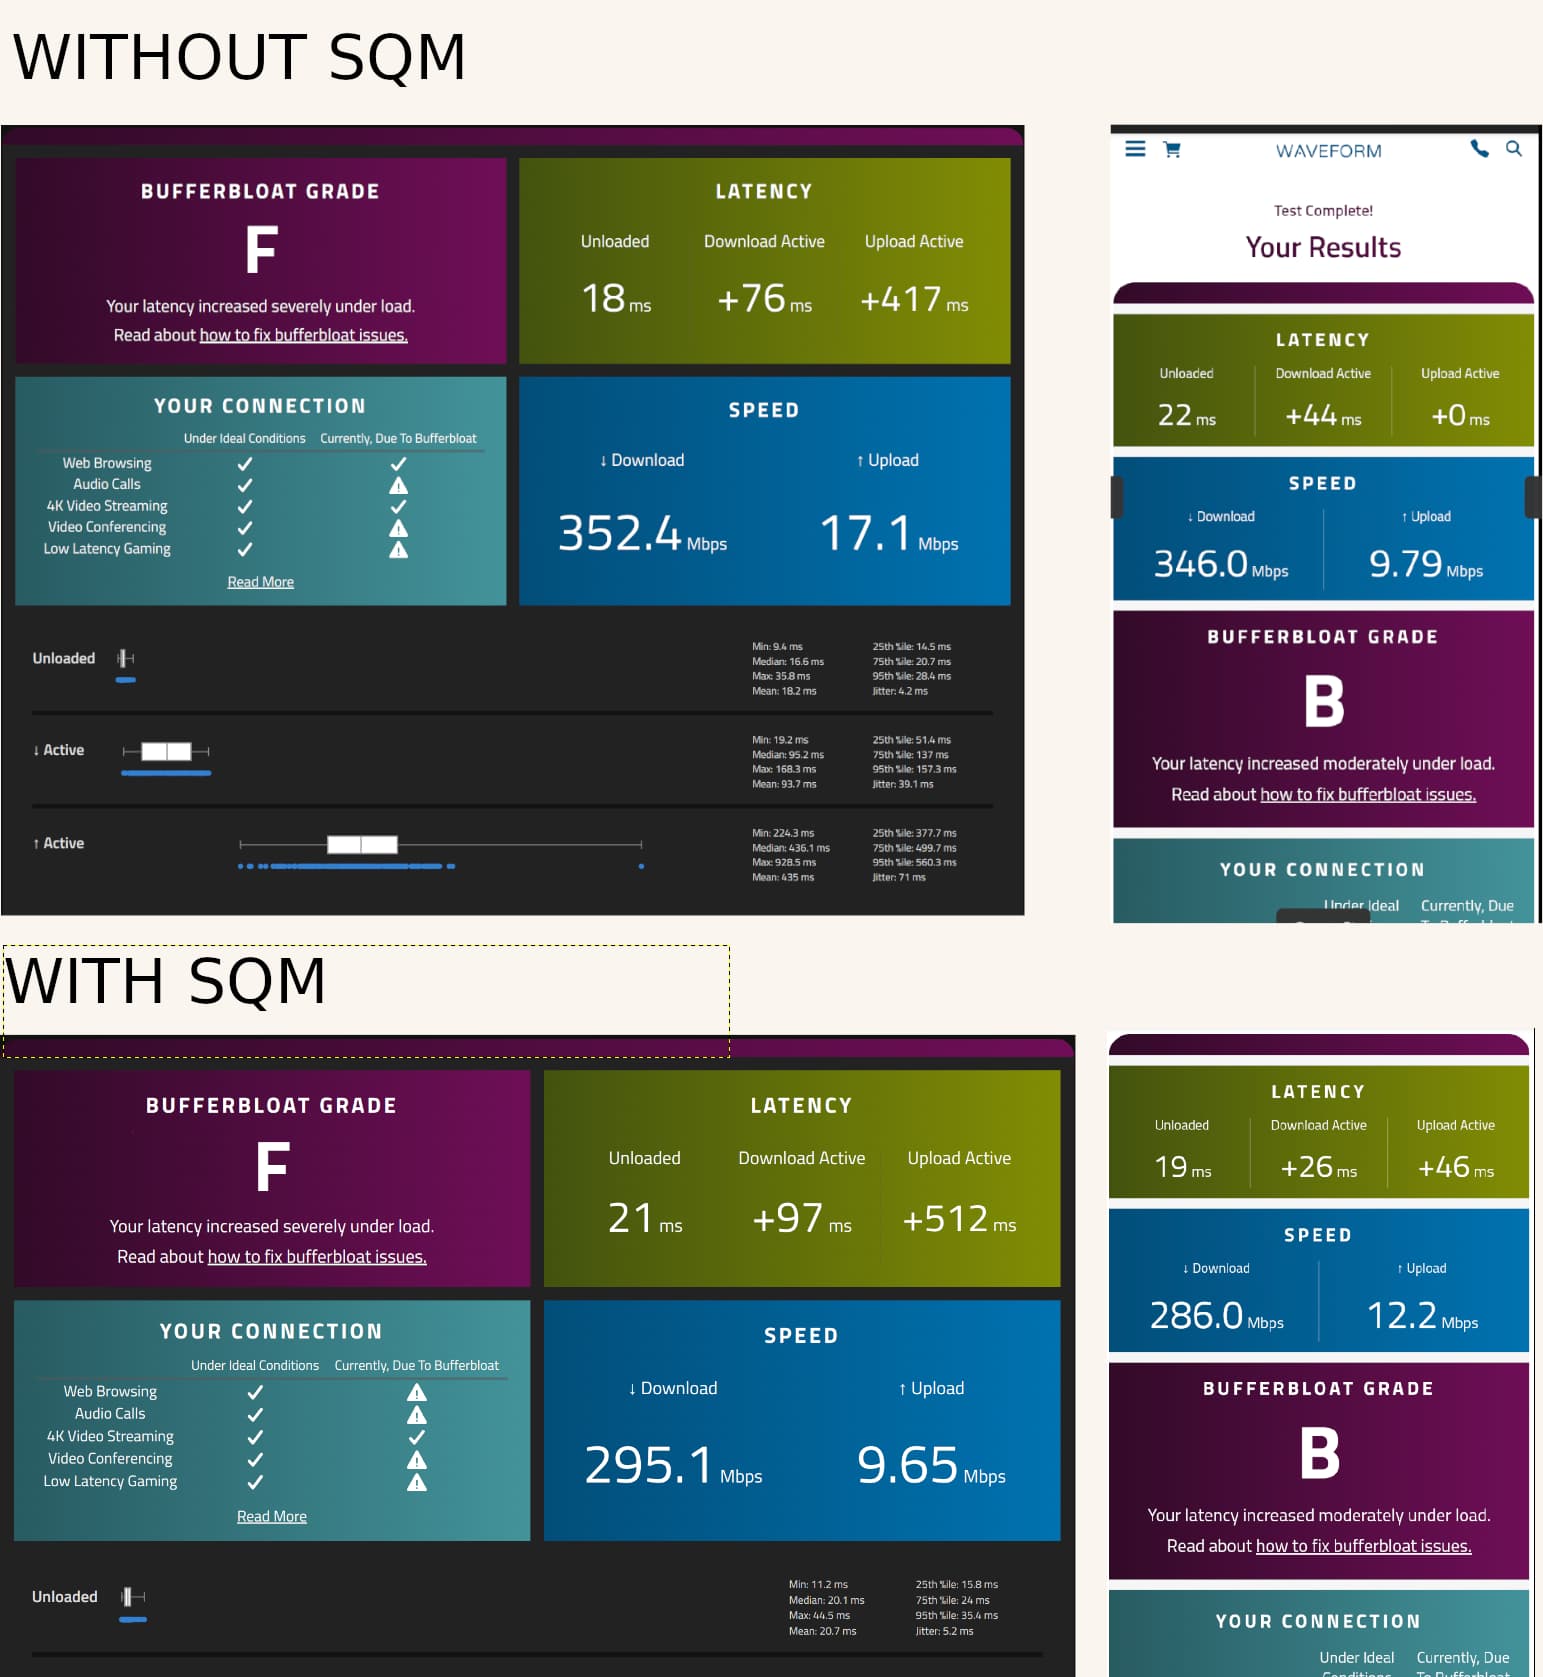
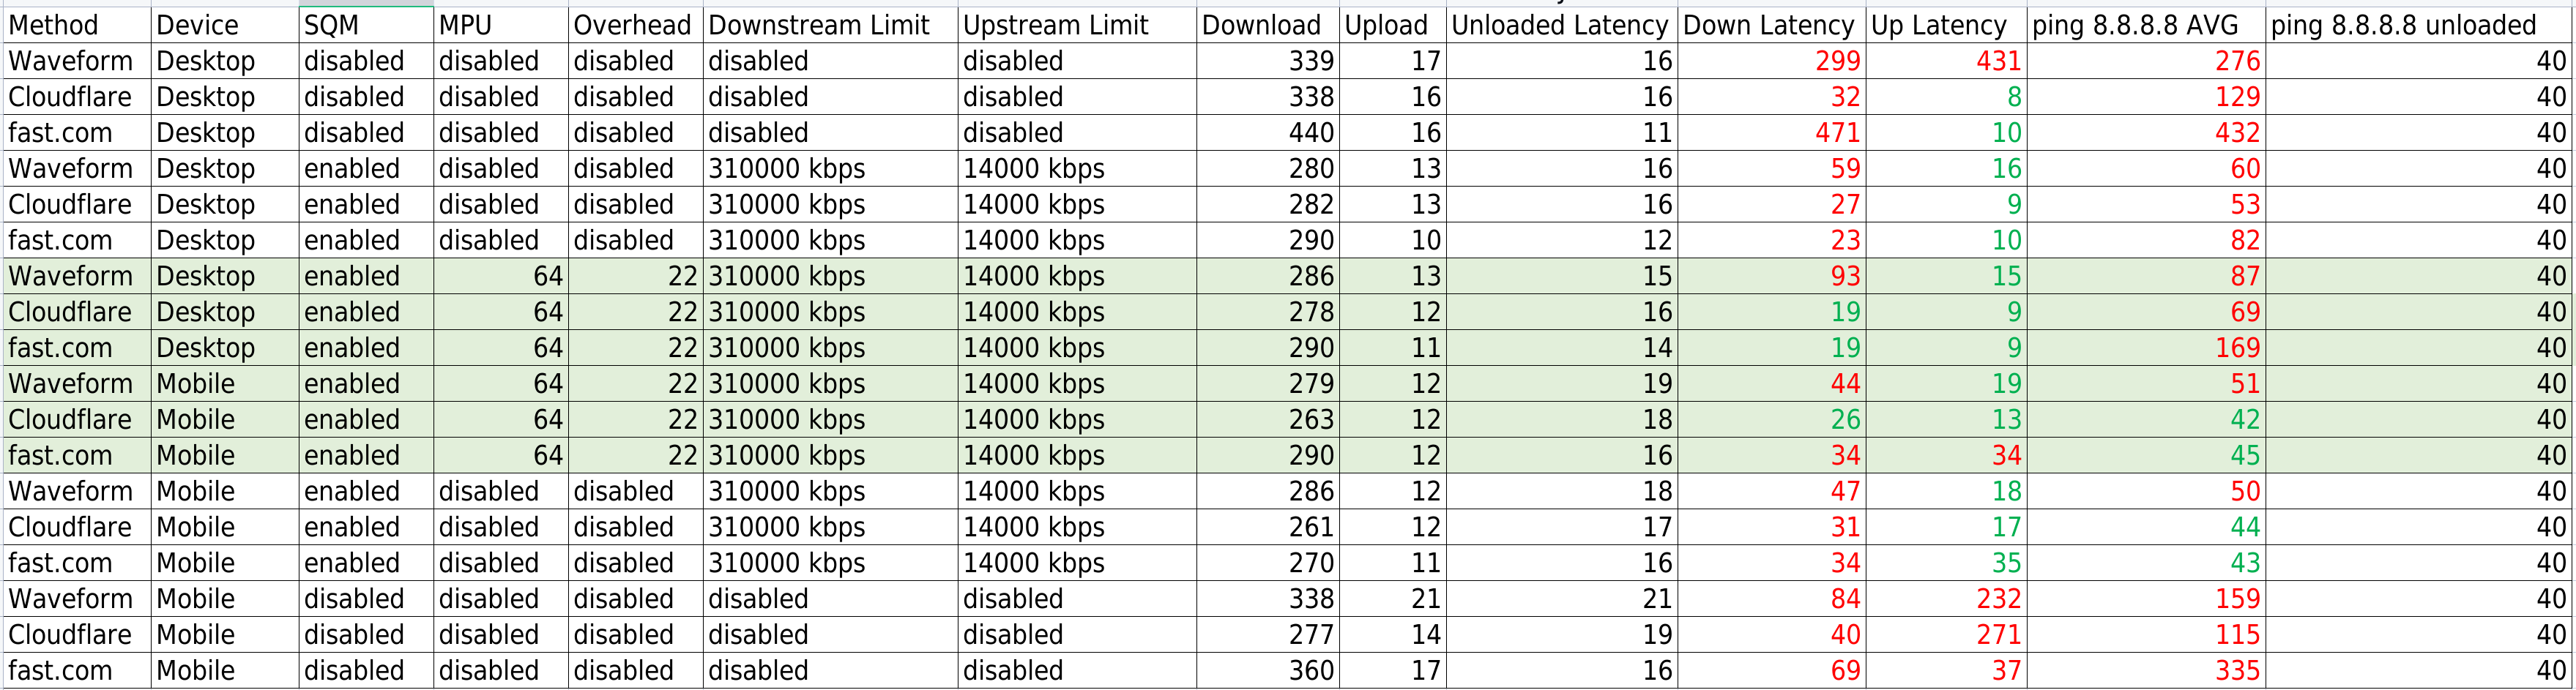
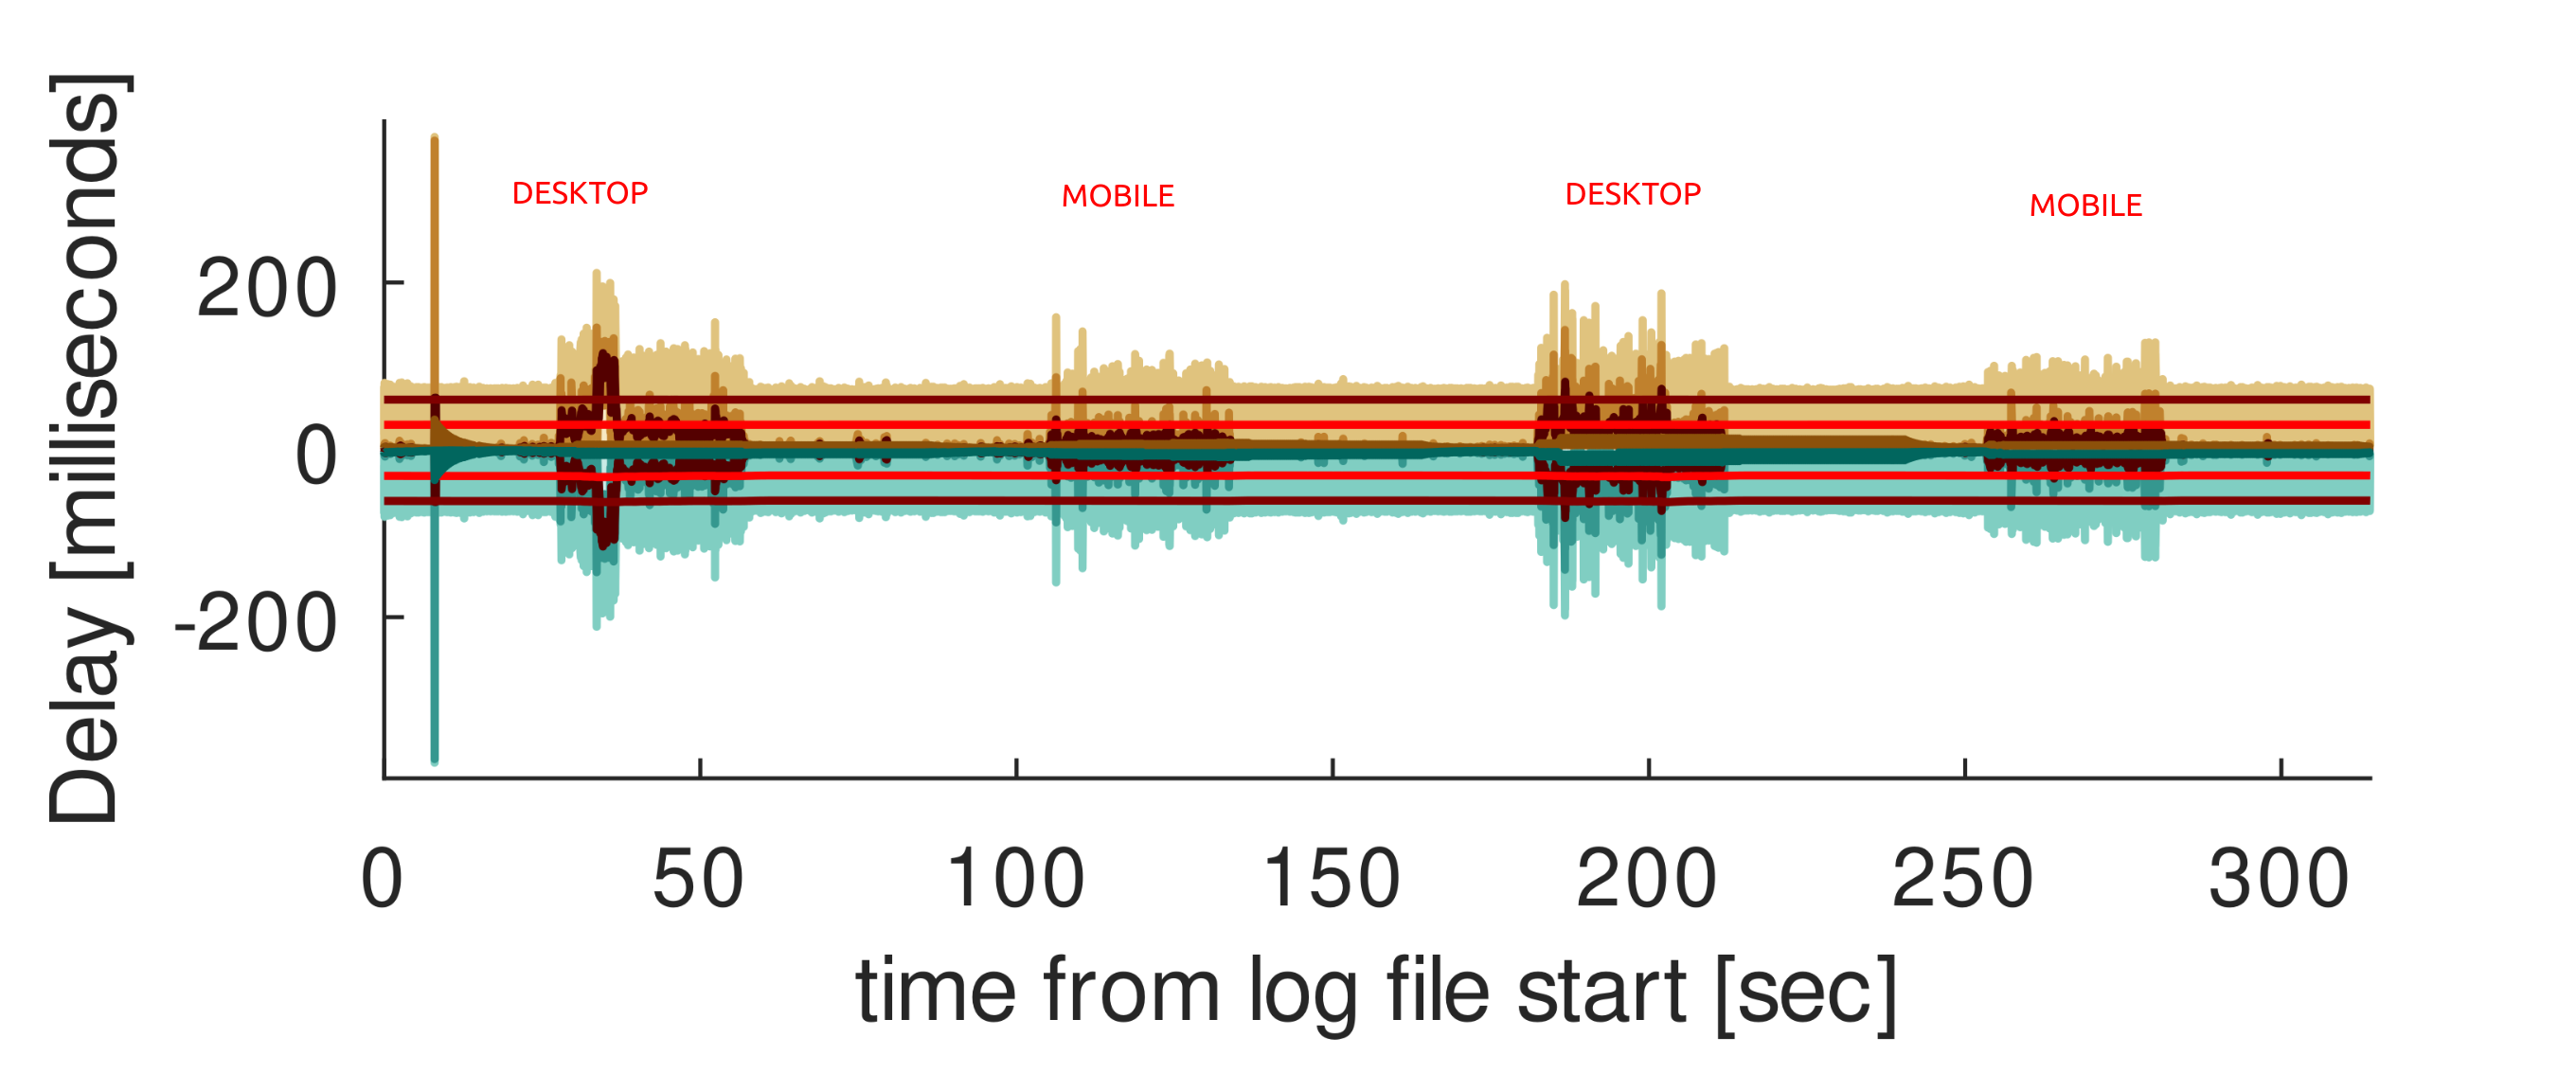
Here we already notes a huge difference between my smartphone wireless and my computer wired network.

Below I pasted the qc qdisc logs using SQM with PC and Smartphone:

PC
tc -s qdisc

root@OpenWrt:~# tc -s qdisc
qdisc noqueue 0: dev lo root refcnt 2
 Sent 0 bytes 0 pkt (dropped 0, overlimits 0 requeues 0)
 backlog 0b 0p requeues 0
qdisc cake 802d: dev eth0 root refcnt 5 bandwidth 21Mbit besteffort triple-isolate nonat nowash no-ack-filter split-gso rtt 100ms raw overhead 0
 Sent 63379900 bytes 277693 pkt (dropped 36, overlimits 217709 requeues 2)
 backlog 0b 0p requeues 2
 memory used: 484872b of 4Mb
 capacity estimate: 21Mbit
 min/max network layer size:           42 /    1494
 min/max overhead-adjusted size:       42 /    1494
 average network hdr offset:           14
 
                  Tin 0
  thresh         21Mbit
  target            5ms
  interval        100ms
  pk_delay       2.78ms
  av_delay        741us
  sp_delay          4us
  backlog            0b
  pkts           277729
  bytes        63428870
  way_inds         1577
  way_miss          191
  way_cols            0
  drops              36
  marks               0
  ack_drop            0
  sp_flows            1
  bk_flows            1
  un_flows            0
  max_len          5736
  quantum           640
 
qdisc ingress ffff: dev eth0 parent ffff:fff1 ----------------
 Sent 1076662679 bytes 800019 pkt (dropped 0, overlimits 0 requeues 0)
 backlog 0b 0p requeues 0
qdisc mq 0: dev eth1 root
 Sent 94621648836 bytes 85645752 pkt (dropped 63, overlimits 0 requeues 90435)
 backlog 0b 0p requeues 90435
qdisc fq_codel 0: dev eth1 parent :4 limit 10240p flows 1024 quantum 1514 target 5ms interval 100ms memory_limit 32Mb ecn drop_batch 64
 Sent 18193739771 bytes 14649633 pkt (dropped 8, overlimits 0 requeues 16093)
 backlog 0b 0p requeues 16093
  maxpacket 18642 drop_overlimit 0 new_flow_count 10807 ecn_mark 0
  new_flows_len 0 old_flows_len 0
qdisc fq_codel 0: dev eth1 parent :3 limit 10240p flows 1024 quantum 1514 target 5ms interval 100ms memory_limit 32Mb ecn drop_batch 64
 Sent 29740509205 bytes 22846232 pkt (dropped 22, overlimits 0 requeues 32189)
 backlog 0b 0p requeues 32189
  maxpacket 11472 drop_overlimit 0 new_flow_count 25423 ecn_mark 0
  new_flows_len 0 old_flows_len 0
qdisc fq_codel 0: dev eth1 parent :2 limit 10240p flows 1024 quantum 1514 target 5ms interval 100ms memory_limit 32Mb ecn drop_batch 64
 Sent 27384300918 bytes 21251711 pkt (dropped 24, overlimits 0 requeues 24516)
 backlog 0b 0p requeues 24516
  maxpacket 14340 drop_overlimit 0 new_flow_count 19088 ecn_mark 0
  new_flows_len 0 old_flows_len 0
qdisc fq_codel 0: dev eth1 parent :1 limit 10240p flows 1024 quantum 1514 target 5ms interval 100ms memory_limit 32Mb ecn drop_batch 64
 Sent 19303098942 bytes 26898176 pkt (dropped 9, overlimits 0 requeues 17637)
 backlog 0b 0p requeues 17637
  maxpacket 11472 drop_overlimit 0 new_flow_count 11184 ecn_mark 0
  new_flows_len 0 old_flows_len 0
qdisc mq 0: dev eth2 root
 Sent 42092256562 bytes 32497901 pkt (dropped 0, overlimits 0 requeues 32982)
 backlog 0b 0p requeues 32982
qdisc fq_codel 0: dev eth2 parent :4 limit 10240p flows 1024 quantum 1514 target 5ms interval 100ms memory_limit 32Mb ecn drop_batch 64
 Sent 9423504139 bytes 7381996 pkt (dropped 0, overlimits 0 requeues 5600)
 backlog 0b 0p requeues 5600
  maxpacket 18168 drop_overlimit 0 new_flow_count 5345 ecn_mark 0
  new_flows_len 0 old_flows_len 0
qdisc fq_codel 0: dev eth2 parent :3 limit 10240p flows 1024 quantum 1514 target 5ms interval 100ms memory_limit 32Mb ecn drop_batch 64
 Sent 12088431043 bytes 9377949 pkt (dropped 0, overlimits 0 requeues 8267)
 backlog 0b 0p requeues 8267
  maxpacket 28766 drop_overlimit 0 new_flow_count 8559 ecn_mark 0
  new_flows_len 0 old_flows_len 0
qdisc fq_codel 0: dev eth2 parent :2 limit 10240p flows 1024 quantum 1514 target 5ms interval 100ms memory_limit 32Mb ecn drop_batch 64
 Sent 9701918011 bytes 7314544 pkt (dropped 0, overlimits 0 requeues 9260)
 backlog 0b 0p requeues 9260
  maxpacket 24224 drop_overlimit 0 new_flow_count 7805 ecn_mark 0
  new_flows_len 0 old_flows_len 0
qdisc fq_codel 0: dev eth2 parent :1 limit 10240p flows 1024 quantum 1514 target 5ms interval 100ms memory_limit 32Mb ecn drop_batch 64
 Sent 10878403369 bytes 8423412 pkt (dropped 0, overlimits 0 requeues 9855)
 backlog 0b 0p requeues 9855
  maxpacket 19682 drop_overlimit 0 new_flow_count 12474 ecn_mark 0
  new_flows_len 0 old_flows_len 0
qdisc mq 0: dev eth3 root
 Sent 15179037241 bytes 24418478 pkt (dropped 0, overlimits 0 requeues 25745)
 backlog 0b 0p requeues 25745
qdisc fq_codel 0: dev eth3 parent :4 limit 10240p flows 1024 quantum 1514 target 5ms interval 100ms memory_limit 32Mb ecn drop_batch 64
 Sent 1105938021 bytes 2272617 pkt (dropped 0, overlimits 0 requeues 5107)
 backlog 0b 0p requeues 5107
  maxpacket 1514 drop_overlimit 0 new_flow_count 2625 ecn_mark 0
  new_flows_len 0 old_flows_len 0
qdisc fq_codel 0: dev eth3 parent :3 limit 10240p flows 1024 quantum 1514 target 5ms interval 100ms memory_limit 32Mb ecn drop_batch 64
 Sent 363110404 bytes 1575782 pkt (dropped 0, overlimits 0 requeues 3503)
 backlog 0b 0p requeues 3503
  maxpacket 1805 drop_overlimit 0 new_flow_count 1588 ecn_mark 0
  new_flows_len 0 old_flows_len 0
qdisc fq_codel 0: dev eth3 parent :2 limit 10240p flows 1024 quantum 1514 target 5ms interval 100ms memory_limit 32Mb ecn drop_batch 64
 Sent 467310237 bytes 1866639 pkt (dropped 0, overlimits 0 requeues 5406)
 backlog 0b 0p requeues 5406
  maxpacket 2988 drop_overlimit 0 new_flow_count 2625 ecn_mark 0
  new_flows_len 0 old_flows_len 0
qdisc fq_codel 0: dev eth3 parent :1 limit 10240p flows 1024 quantum 1514 target 5ms interval 100ms memory_limit 32Mb ecn drop_batch 64
 Sent 13242678579 bytes 18703440 pkt (dropped 0, overlimits 0 requeues 11729)
 backlog 0b 0p requeues 11729
  maxpacket 1514 drop_overlimit 0 new_flow_count 7392 ecn_mark 0
  new_flows_len 0 old_flows_len 0
qdisc noqueue 0: dev br-lan root refcnt 2
 Sent 0 bytes 0 pkt (dropped 0, overlimits 0 requeues 0)
 backlog 0b 0p requeues 0
qdisc cake 802e: dev ifb4eth0 root refcnt 2 bandwidth 320Mbit besteffort triple-isolate nonat wash no-ack-filter split-gso rtt 100ms raw overhead 0
 Sent 1106724385 bytes 792244 pkt (dropped 7775, overlimits 928921 requeues 0)
 backlog 0b 0p requeues 0
 memory used: 3837704b of 15140Kb
 capacity estimate: 320Mbit
 min/max network layer size:           60 /    1514
 min/max overhead-adjusted size:       60 /    1514
 average network hdr offset:           14
 
                  Tin 0
  thresh        320Mbit
  target            5ms
  interval        100ms
  pk_delay         52us
  av_delay          9us
  sp_delay          2us
  backlog            0b
  pkts           800019
  bytes      1117871309
  way_inds            1
  way_miss          186
  way_cols            0
  drops            7775
  marks               0
  ack_drop            0
  sp_flows            2
  bk_flows            1
  un_flows            0
  max_len         18642
  quantum          1514

Smartphone

tc -s qdisc

root@OpenWrt:~# tc -s qdisc
qdisc noqueue 0: dev lo root refcnt 2
 Sent 0 bytes 0 pkt (dropped 0, overlimits 0 requeues 0)
 backlog 0b 0p requeues 0
qdisc cake 8039: dev eth0 root refcnt 5 bandwidth 21Mbit besteffort triple-isolate nonat nowash no-ack-filter split-gso rtt 100ms raw overhead 0
 Sent 63575815 bytes 166831 pkt (dropped 93, overlimits 376134 requeues 50)
 backlog 0b 0p requeues 50
 memory used: 791256b of 4Mb
 capacity estimate: 21Mbit
 min/max network layer size:           42 /    1494
 min/max overhead-adjusted size:       42 /    1494
 average network hdr offset:           14
 
                  Tin 0
  thresh         21Mbit
  target            5ms
  interval        100ms
  pk_delay       3.04ms
  av_delay        959us
  sp_delay          4us
  backlog            0b
  pkts           166924
  bytes        63699769
  way_inds            0
  way_miss          235
  way_cols            0
  drops              93
  marks               0
  ack_drop            0
  sp_flows            1
  bk_flows            1
  un_flows            0
  max_len         11472
  quantum           640
 
qdisc ingress ffff: dev eth0 parent ffff:fff1 ----------------
 Sent 1080824883 bytes 805621 pkt (dropped 0, overlimits 0 requeues 0)
 backlog 0b 0p requeues 0
qdisc mq 0: dev eth1 root
 Sent 95733016883 bytes 86464173 pkt (dropped 63, overlimits 0 requeues 90574)
 backlog 0b 0p requeues 90574
qdisc fq_codel 0: dev eth1 parent :4 limit 10240p flows 1024 quantum 1514 target 5ms interval 100ms memory_limit 32Mb ecn drop_batch 64
 Sent 18383937837 bytes 14790093 pkt (dropped 8, overlimits 0 requeues 16109)
 backlog 0b 0p requeues 16109
  maxpacket 18642 drop_overlimit 0 new_flow_count 10815 ecn_mark 0
  new_flows_len 0 old_flows_len 0
qdisc fq_codel 0: dev eth1 parent :3 limit 10240p flows 1024 quantum 1514 target 5ms interval 100ms memory_limit 32Mb ecn drop_batch 64
 Sent 29923489192 bytes 22979181 pkt (dropped 22, overlimits 0 requeues 32225)
 backlog 0b 0p requeues 32225
  maxpacket 11472 drop_overlimit 0 new_flow_count 25443 ecn_mark 0
  new_flows_len 0 old_flows_len 0
qdisc fq_codel 0: dev eth1 parent :2 limit 10240p flows 1024 quantum 1514 target 5ms interval 100ms memory_limit 32Mb ecn drop_batch 64
 Sent 27928818113 bytes 21642997 pkt (dropped 24, overlimits 0 requeues 24579)
 backlog 0b 0p requeues 24579
  maxpacket 14340 drop_overlimit 0 new_flow_count 19180 ecn_mark 0
  new_flows_len 0 old_flows_len 0
qdisc fq_codel 0: dev eth1 parent :1 limit 10240p flows 1024 quantum 1514 target 5ms interval 100ms memory_limit 32Mb ecn drop_batch 64
 Sent 19496771741 bytes 27051902 pkt (dropped 9, overlimits 0 requeues 17661)
 backlog 0b 0p requeues 17661
  maxpacket 11472 drop_overlimit 0 new_flow_count 11209 ecn_mark 0
  new_flows_len 0 old_flows_len 0
qdisc mq 0: dev eth2 root
 Sent 42094878142 bytes 32502762 pkt (dropped 0, overlimits 0 requeues 32992)
 backlog 0b 0p requeues 32992
qdisc fq_codel 0: dev eth2 parent :4 limit 10240p flows 1024 quantum 1514 target 5ms interval 100ms memory_limit 32Mb ecn drop_batch 64
 Sent 9424774406 bytes 7383762 pkt (dropped 0, overlimits 0 requeues 5604)
 backlog 0b 0p requeues 5604
  maxpacket 18168 drop_overlimit 0 new_flow_count 5346 ecn_mark 0
  new_flows_len 0 old_flows_len 0
qdisc fq_codel 0: dev eth2 parent :3 limit 10240p flows 1024 quantum 1514 target 5ms interval 100ms memory_limit 32Mb ecn drop_batch 64
 Sent 12088806711 bytes 9378747 pkt (dropped 0, overlimits 0 requeues 8272)
 backlog 0b 0p requeues 8272
  maxpacket 28766 drop_overlimit 0 new_flow_count 8561 ecn_mark 0
  new_flows_len 0 old_flows_len 0
qdisc fq_codel 0: dev eth2 parent :2 limit 10240p flows 1024 quantum 1514 target 5ms interval 100ms memory_limit 32Mb ecn drop_batch 64
 Sent 9702433547 bytes 7316029 pkt (dropped 0, overlimits 0 requeues 9261)
 backlog 0b 0p requeues 9261
  maxpacket 24224 drop_overlimit 0 new_flow_count 7805 ecn_mark 0
  new_flows_len 0 old_flows_len 0
qdisc fq_codel 0: dev eth2 parent :1 limit 10240p flows 1024 quantum 1514 target 5ms interval 100ms memory_limit 32Mb ecn drop_batch 64
 Sent 10878863478 bytes 8424224 pkt (dropped 0, overlimits 0 requeues 9855)
 backlog 0b 0p requeues 9855
  maxpacket 19682 drop_overlimit 0 new_flow_count 12474 ecn_mark 0
  new_flows_len 0 old_flows_len 0
qdisc mq 0: dev eth3 root
 Sent 15199893109 bytes 24446928 pkt (dropped 0, overlimits 0 requeues 25790)
 backlog 0b 0p requeues 25790
qdisc fq_codel 0: dev eth3 parent :4 limit 10240p flows 1024 quantum 1514 target 5ms interval 100ms memory_limit 32Mb ecn drop_batch 64
 Sent 1106331141 bytes 2273678 pkt (dropped 0, overlimits 0 requeues 5116)
 backlog 0b 0p requeues 5116
  maxpacket 1514 drop_overlimit 0 new_flow_count 2631 ecn_mark 0
  new_flows_len 0 old_flows_len 0
qdisc fq_codel 0: dev eth3 parent :3 limit 10240p flows 1024 quantum 1514 target 5ms interval 100ms memory_limit 32Mb ecn drop_batch 64
 Sent 363581807 bytes 1577192 pkt (dropped 0, overlimits 0 requeues 3510)
 backlog 0b 0p requeues 3510
  maxpacket 1805 drop_overlimit 0 new_flow_count 1592 ecn_mark 0
  new_flows_len 0 old_flows_len 0
qdisc fq_codel 0: dev eth3 parent :2 limit 10240p flows 1024 quantum 1514 target 5ms interval 100ms memory_limit 32Mb ecn drop_batch 64
 Sent 467798222 bytes 1868546 pkt (dropped 0, overlimits 0 requeues 5416)
 backlog 0b 0p requeues 5416
  maxpacket 2988 drop_overlimit 0 new_flow_count 2630 ecn_mark 0
  new_flows_len 0 old_flows_len 0
qdisc fq_codel 0: dev eth3 parent :1 limit 10240p flows 1024 quantum 1514 target 5ms interval 100ms memory_limit 32Mb ecn drop_batch 64
 Sent 13262181939 bytes 18727512 pkt (dropped 0, overlimits 0 requeues 11748)
 backlog 0b 0p requeues 11748
  maxpacket 1514 drop_overlimit 0 new_flow_count 7398 ecn_mark 0
  new_flows_len 0 old_flows_len 0
qdisc noqueue 0: dev br-lan root refcnt 2
 Sent 0 bytes 0 pkt (dropped 0, overlimits 0 requeues 0)
 backlog 0b 0p requeues 0
qdisc cake 803a: dev ifb4eth0 root refcnt 2 bandwidth 320Mbit besteffort triple-isolate nonat wash no-ack-filter split-gso rtt 100ms raw overhead 0
 Sent 1106899343 bytes 794720 pkt (dropped 10901, overlimits 934907 requeues 0)
 backlog 0b 0p requeues 0
 memory used: 3171172b of 15140Kb
 capacity estimate: 320Mbit
 min/max network layer size:           60 /    1514
 min/max overhead-adjusted size:       60 /    1514
 average network hdr offset:           14
 
                  Tin 0
  thresh        320Mbit
  target            5ms
  interval        100ms
  pk_delay         13us
  av_delay          7us
  sp_delay          3us
  backlog            0b
  pkts           805621
  bytes      1122531377
  way_inds            6
  way_miss          224
  way_cols            0
  drops           10901
  marks               0
  ack_drop            0
  sp_flows            2
  bk_flows            1
  un_flows            0
  max_len         37284
  quantum          1514

SQM Settings

cat /etc/config/sqm 

config queue 'eth1'
        option enabled '1'
        option interface 'eth0'
        option download '320000'
        option upload '21000'
        option qdisc 'cake'
        option script 'piece_of_cake.qos'
        option linklayer 'none'
        option debug_logging '0'
        option verbosity '5'

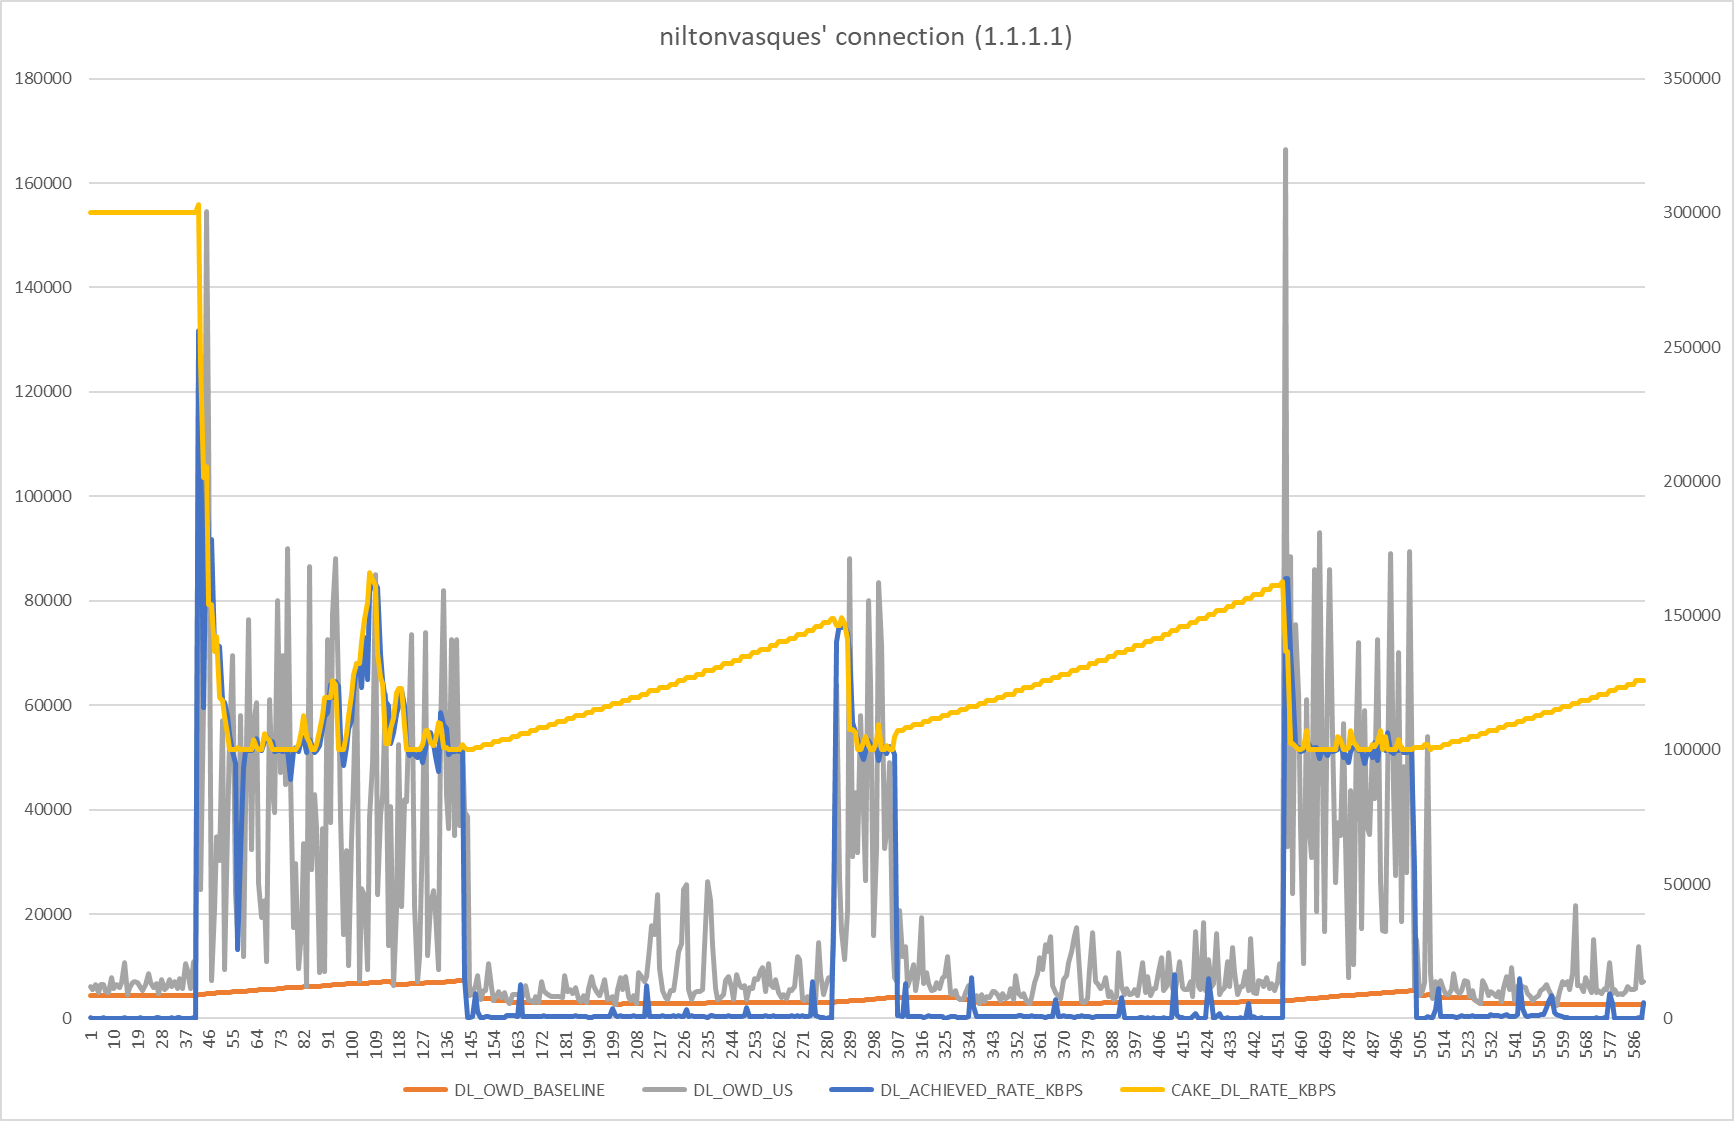
I was inclined to just blame my internet connection, but it doesnt justify why my smartphone get better results, although it is still far from an unbloated result.

Could be some misconfiguration from my side?

Can you show the SQM settings you applied? You have to set the download and upload speed limit to lower than what your ISP provides.

1 Like

…and keep decreasing each direction separately by 5-10% until you get 1-5ms bloat.

You might try testing with https://speed.cloudflare.com to ensure it isn’t a case of bad routing between you and Waveform’s bufferbloat test servers.

Plus you also didn't set wan packet overhead or mpu as described in the wiki. It's there for a reason: https://openwrt.org/docs/guide-user/network/traffic-shaping/sqm

@zekica the settings were in the bottom of my post reply. But I will show them here again:

config queue 'eth1'
        option enabled '1'
        option interface 'eth0'
        option download '320000'
        option upload '21000'
        option qdisc 'cake'
        option script 'piece_of_cake.qos'
        option linklayer 'none'
        option debug_logging '0'
        option verbosity '5'

@qunvureze, yesterday I tried with several values, even decreased downstream to 10 Mbits but the latency was still increasing. I will create a spreadsheet will all the experiments and paste it here to show better the situation.
Anyway I will also try will speedtest from cloudflare and run simultaneously pings to 8.8.8.8 to see how the ping latency spikes.

@gameinn I tried in the past week with several MPUs/Overhead combinations but without success, for that reason I just disabled it. But I will make a full comparison table with the results and bring it here.

I've performed several tests with SQM enabled/disabled, MPU/Overhead on/off and with different test providers (Waveform, Fast.com, Speed Cloudflare) and in all tests I also calculated the AVG ping to 8.8.8.8.

Below we can see in the table all results. Based on the tests I can confident say that the bufferbloat is better with SQM than without. However the MPU/Overhead seems to make the AVG ping to 8.8.8.8 worser than without MPU/Overhead tests, although the results was a little better on cloudflare and fast.com.

Example of ping spiking during a fast.com test with MPU and Overhead in place:

PING 8.8.8.8 (8.8.8.8) 56(84) bytes of data.
64 bytes from 8.8.8.8: icmp_seq=1 ttl=115 time=44.6 ms
64 bytes from 8.8.8.8: icmp_seq=2 ttl=115 time=42.3 ms
64 bytes from 8.8.8.8: icmp_seq=3 ttl=115 time=100 ms
64 bytes from 8.8.8.8: icmp_seq=4 ttl=115 time=659 ms
64 bytes from 8.8.8.8: icmp_seq=5 ttl=115 time=459 ms
64 bytes from 8.8.8.8: icmp_seq=6 ttl=115 time=1220 ms
64 bytes from 8.8.8.8: icmp_seq=7 ttl=115 time=643 ms
64 bytes from 8.8.8.8: icmp_seq=8 ttl=115 time=221 ms
64 bytes from 8.8.8.8: icmp_seq=9 ttl=115 time=230 ms
64 bytes from 8.8.8.8: icmp_seq=10 ttl=115 time=45.8 ms
64 bytes from 8.8.8.8: icmp_seq=11 ttl=115 time=36.2 ms
64 bytes from 8.8.8.8: icmp_seq=12 ttl=115 time=38.2 ms
64 bytes from 8.8.8.8: icmp_seq=13 ttl=115 time=57.4 ms
64 bytes from 8.8.8.8: icmp_seq=14 ttl=115 time=37.7 ms
64 bytes from 8.8.8.8: icmp_seq=15 ttl=115 time=40.6 ms
64 bytes from 8.8.8.8: icmp_seq=16 ttl=115 time=34.7 ms

But I still see bufferbloat happening, I could not eliminate it completely, and the issue is worser on the desktop than in the mobile.

Is there anything that I could do to figure out why the bloat seems worser on the desktop computer? And why the bloat is not completely eliminated?

Next I will experiment decreasing the downstream limit in 5% blocks to compare the results.

Have you tried cake autorate script?

Also give this a read as the issue seems similar

I was planning to use autorate to see if it could help me, I tried tonight but the bloat is still present, and with autorate it is even worser on desktop, since the autorate drops the download rate to minimum on it.

Below it is the comparison with autorate via desktop and mobile. We can see that in mobile the download bandwidth is near the maximum, but the latency bloat is not solved, although the AVG ping 8.8.8.8 is quite good. However in desktop download bandwidth is downgraded until the min limit defined in the autorate script and even in this situation the latency is bloated.

cake autorate settings

dl_if=ifb4eth0 # download interface
ul_if=eth0     # upload interface

adjust_dl_shaper_rate=1 # enable (1) or disable (0) actually changing the dl shaper rate
adjust_ul_shaper_rate=1 # enable (1) or disable (0) actually changing the ul shaper rate

min_dl_shaper_rate_kbps=100000  # minimum bandwidth for download (Kbit/s)
base_dl_shaper_rate_kbps=300000 # steady state bandwidth for download (Kbit/s)
max_dl_shaper_rate_kbps=350000  # maximum bandwidth for download (Kbit/s)

min_ul_shaper_rate_kbps=5000  # minimum bandwidth for upload (Kbit/s)
base_ul_shaper_rate_kbps=10000 # steady state bandwidth for upload (KBit/s)
max_ul_shaper_rate_kbps=20000  # maximum bandwidth for upload (Kbit/s)

I also set performance in all CPUs with echo performance > /sys/devices/system/cpu/cpufreq/*/scaling_governor but nothing has changed.

Sample waveform with autorate enabled from desktop

Sample waveform with autorate enabled from mobile

Maybe you could export data file on cake-autorate after resetting it and performing two or three speed tests, and then we can get a good look at what’s happening in terms of bandwidth and latency.

See:

Hello @Lynx, really nice that the autorate scripts has richer logs and a nice analyzer tool behind it.

I have executed three experiments here and collected the logs from all:

  • 1st: Desktop speed tests with Waveform reaching 328 mbps

    • The bandwidth here reachs 300 Mbps even in desktop because latency was not high enough to drop tha bandwidth, but the bloat was there!
  • 2nd: Desktop speed tests with Waveform -> fast -> speedtest

    • The bandwidth here reachs 100 Mbps only in desktop, because the latency was spiking too much.
  • 3rd: Mobile speed tests with Waveform -> fast -> speedtest

    • Good latency Grade A on waveform, but with bandwidth of just 232 mpbs, fast with 100mbps and speedtest with 127.

The strange thing is that the results changes from time to time, in a one given moment the latency is more calm and in other moment the latency is really bad.

2 Likes

It could mean your ISP network segment could be oversubscribed. Could be interesting to check without SQM in the middle of the night and during the evening peak hours if you get consistent bufferbloat. That would help to establish a baseline and estimate oversubscribtion levels.

1 Like

Thanks for the encouraging feedback. Please can you upload the raw log files (gzipped) here:

@lynx find the logs https://easyupload.io/m/cekime

1 Like

With this connection I would use cake-autorate:

cake-autorate seems to be operating as designed in terms of controlling the cake bandwidth to keep latency in check.

But I do not understand why your data in respect of your mobile phone client shows a higher bandwidth before cake-autorate throttles with the same settings as compared to your desktop client. Something doesn't seem right here.

Have you verified that iperf3 tests between:

  • the client desktop device performing speed test and your router; and

  • the client mobile device and your router,

offer significant headroom above client devices and the internet? I mean it's not that this relates to an ethernet issue like a powerline adapter or something is it?

To elaborate on the above, in my case my 4G connection gives circa 15-80Mbit/s, and any connection between any client device and my router exceeds that by far. Hence my local network is never a bottleneck.

Assuming the same is the case for you, why is it that using your mobile phone as a client results in higher bandwidth before latency spikes occur as compared to when you use your desktop? This does not make sense to me.

@moeller0 am I missing anything that you see?

@lynx Yes. This difference in latency and bandwidth between mobile and desktop seems completely non intuitive for me, the expectation should be in the opposite.

Do you think that the desktop NIC could be the cause? Is there a way to measure its performance?

I just executed the iperf3 tests:

  • desktop <--> OpenWRT Router X86 (936 mbps)
  • Smartphone <--> Wifi 5G Xiaomi AX3200 <--> OpenWRT Router X86 (446 Mbits)

Desktop Test

Accepted connection from 192.168.1.133, port 56578
[  5] local 192.168.1.1 port 5201 connected to 192.168.1.133 port 56594
[ ID] Interval           Transfer     Bitrate
[  5]   0.00-1.00   sec   112 MBytes   935 Mbits/sec                  
[  5]   1.00-2.00   sec   112 MBytes   936 Mbits/sec                  
[  5]   2.00-3.00   sec   112 MBytes   937 Mbits/sec                  
[  5]   3.00-4.00   sec   111 MBytes   928 Mbits/sec                  
[  5]   4.00-5.00   sec   112 MBytes   937 Mbits/sec                  
[  5]   5.00-6.00   sec   112 MBytes   936 Mbits/sec                  
[  5]   6.00-7.00   sec   112 MBytes   936 Mbits/sec                  
[  5]   7.00-8.00   sec   112 MBytes   936 Mbits/sec                  
[  5]   8.00-9.00   sec   112 MBytes   936 Mbits/sec                  
[  5]   9.00-10.00  sec   112 MBytes   936 Mbits/sec                  
[  5]  10.00-10.00  sec   128 KBytes  1.66 Gbits/sec                  
- - - - - - - - - - - - - - - - - - - - - - - - -
[ ID] Interval           Transfer     Bitrate
[  5]   0.00-10.00  sec  1.09 GBytes   936 Mbits/sec                  receiver

Mobile test

Accepted connection from 192.168.1.126, port 55888
[  5] local 192.168.1.1 port 5201 connected to 192.168.1.126 port 55896
[ ID] Interval           Transfer     Bitrate
[  5]   0.00-1.00   sec  31.9 MBytes   267 Mbits/sec                  
[  5]   1.00-2.00   sec  56.6 MBytes   475 Mbits/sec                  
[  5]   2.00-3.00   sec  57.6 MBytes   483 Mbits/sec                  
[  5]   3.00-4.00   sec  61.1 MBytes   513 Mbits/sec                  
[  5]   4.00-5.00   sec  58.2 MBytes   489 Mbits/sec                  
[  5]   5.00-5.03   sec  1.75 MBytes   510 Mbits/sec                  
- - - - - - - - - - - - - - - - - - - - - - - - -
[ ID] Interval           Transfer     Bitrate
[  5]   0.00-5.03   sec   267 MBytes   446 Mbits/sec                  receiver

@qunvureze I'm planning to schedule hourly speedtests without SQM to evaluate how my ISP connection is oscilating through the day.

To confirm that the issue is happening more stronger in the desktop, I executed 4 waveform tests in sequence using this order: DESKTOP -> MOBILE -> DESKTOP -> MOBILE. That way I tried to eliminate periodic ISP connection oscilations.

Now look to the weirdest chart showing the bandwidth dropping hard in desktop but staying in the maximum for mobile:

Bufferbloat worser in desktop

Raw logs: https://easyupload.io/hpt096

@lynx could the packet loss be the problem? I executed the iperf3 tests again in UDP mode and observed that the packet loss is higher on desktop(~0.24%) than mobile (0.0042%).

Desktop

[ ID] Interval           Transfer     Bitrate         Jitter    Lost/Total Datagrams
[  5]   0.00-60.00  sec  6.63 GBytes   949 Mbits/sec  0.022 ms  12046/4927479 (0.24%)  receiver

Mobile

[ ID] Interval           Transfer     Bitrate         Jitter    Lost/Total Datagrams
[SUM]  0.0-60.0 sec  10 datagrams received out-of-order
[  5]   0.00-60.00  sec  2.20 GBytes   315 Mbits/sec  0.026 ms  68/1633481 (0.0042%)  receiver

Maybe. Something is broken here and I’m hoping @moeller0 can help us.

Well, that I;HO just shows he got lucky on that test, and whatever is often congested on his path by chance was not congested in this measurement window

Not really, unless it reports ethernet errors/drops...

Mmmh, but I see your later data that indicates some significant difference between mobile and desktop...

What mobile device are you using, and what desktop (CPU model and operating system name and version for both please), also what ethernet adaprter is in the desktop?

@moeller0 I identified a packet loss of 0.24% in the desktop, but for me seems not enough to justify the spikes latency.

Find the hardware details:

Desktop

  • Intel(R) Core(TM) i9-9900KS CPU @ 4.00GHz
  • RAM: 64GB
  • NIC: Intel Corporation Ethernet Connection (7) I219-V (rev 10)
  • OS: Ubuntu 22.04.4
  • Kernel: 6.5.0-21-generic
lshw -class network
  *-network                 
       description: Ethernet interface
       product: Ethernet Connection (7) I219-V
       vendor: Intel Corporation
       physical id: 1f.6
       bus info: pci@0000:00:1f.6
       logical name: eno1
       version: 10
       size: 1Gbit/s
       capacity: 1Gbit/s
       width: 32 bits
       clock: 33MHz
       capabilities: pm msi bus_master cap_list ethernet physical tp 10bt 10bt-fd 100bt 100bt-fd 1000bt-fd autonegotiation
       configuration: autonegotiation=on broadcast=yes driver=e1000e driverversion=6.5.0-21-generic duplex=full firmware=0.5-4 ip=192.168.1.133 latency=0 link=yes multicast=yes port=twisted pair speed=1Gbit/s
       resources: irq:129 memory:55400000-5541ffff

Mobile

  • Device: Google Pixel 7 Pro
  • OS: Android 14 (UQ1A.240205.002)
  • Processor: Octa-core (2x2.85 GHz Cortex-X1 & 2x2.35 GHz Cortex-A78 & 4x1.80 GHz Cortex-A55)
  • RAM 8G
  • Kernel: 5.10.177
  • NIC: not found the model - Wi-Fi 6E (802.11ax) with 2.4GHz+5GHz+6GHz, HE160, MIMO