Bufferbloat - Continuous measurement script

Hi!
Although not an Opewrt directly related question, it has to do with bufferbloat, where Openwrt shines, so...

I would like feedback from you guys to see if I'm going in the right direction.

What I want?

To plot periodic and continuous bufferbloat measurements (in my case, I'll do it in Cacti).

How?

The core functionality lies in a script that will run periodically in cron.
Here it is:

#!/bin/sh
wget -q https://releases.ubuntu.com/20.04.4/ubuntu-20.04.4-desktop-amd64.iso & echo $! > pid.txt &
ping -qc 20 1.1.1.1 > bufferbloat.txt; kill $(cat pid.txt); rm ubuntu-20.04*

The idea is to start a download (in this case, Ubuntu ISO) and, in parallel, to ping twenty times some IP address (in this case, 1.1.1.1) and redirect the ping output to a file named bufferbloat.txt. As a side note, the script also manages to interrupt the wget command after ping ends, and also deletes the data that has already been downloaded.

The content of bufferbloat.txt will look like this:

gustavo@srv2:~/bin$ cat bufferbloat.txt 
PING 1.1.1.1 (1.1.1.1) 56(84) bytes of data.

--- 1.1.1.1 ping statistics ---
20 packets transmitted, 19 received, 5% packet loss, time 19030ms
rtt min/avg/max/mdev = 11.237/56.486/143.167/36.687 ms

If I got it right, the average rtt (avg) could be thought as a bufferbloat "measurement", and then it's just a matter of classifying it according to this standard:

Less than 5ms (average of down bloat and up bloat) - A+
Less than 30ms - A
Less than 60ms - B
Less than 200ms - C
Less than 400ms - D
400ms+ - F

(https://www.dslreports.com/faq/17930)

Am I going in the right direction?

(Something I noticed now while writing this post is that the bufferbloat classification is the the download AND UPLOAD timings, so I guess I have to add to the script the upload part then get the average of the download avg and upload avg ...)

NOTE: Plotting is TBD, after getting the script right

Any advise will be welcome!

UPDATE: Since this thread was listed in this other, very useful thread, I'm obliged to update you.
I'm no longer running this script, because I concluded that doing a speed test every minute would either raise suspicions on my IP as well as drain bandwidth from my ISP plan.
But I still pursue ways of measuring and monitoring bufferbloat.
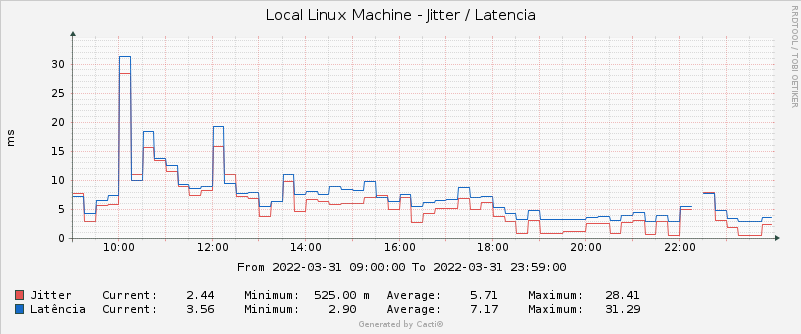
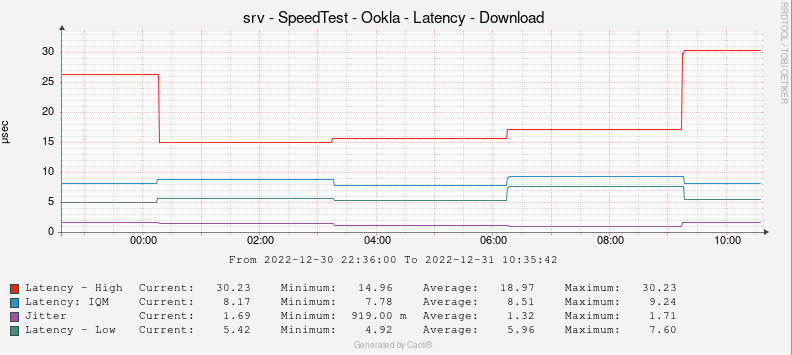
Today, I plot ping results every minute and focus on max latency values. I even account for percentiles distribution so that I can get a hint on bufferbloat events.
This is the graph where I get it


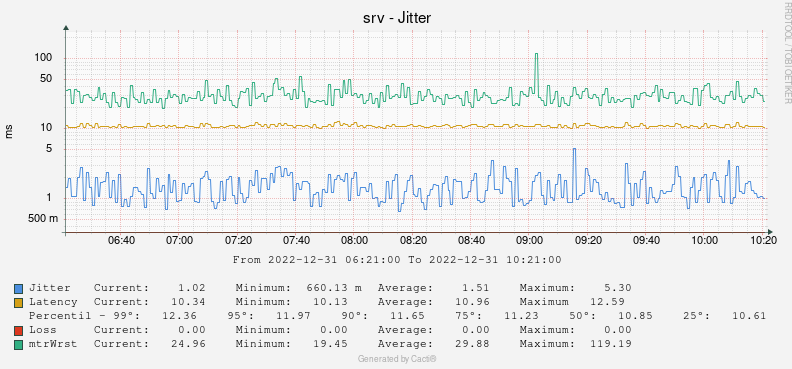
(Forget about the title...).
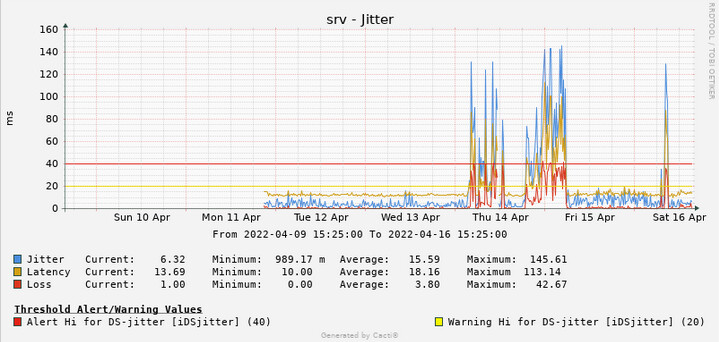
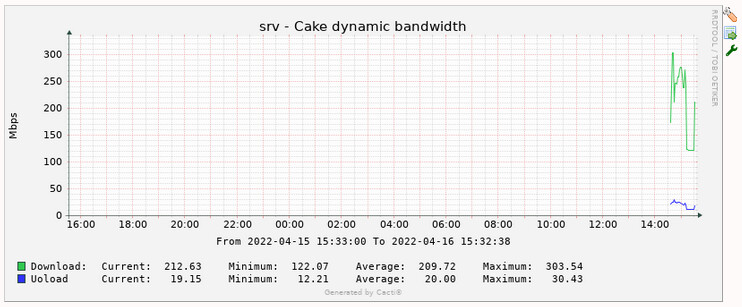
However, since Ookla's speed test now shows latency under load, I also automated speed tests, this time every three hours, and plot the idle, download and upload higher latencies.
The cron script parses these values:

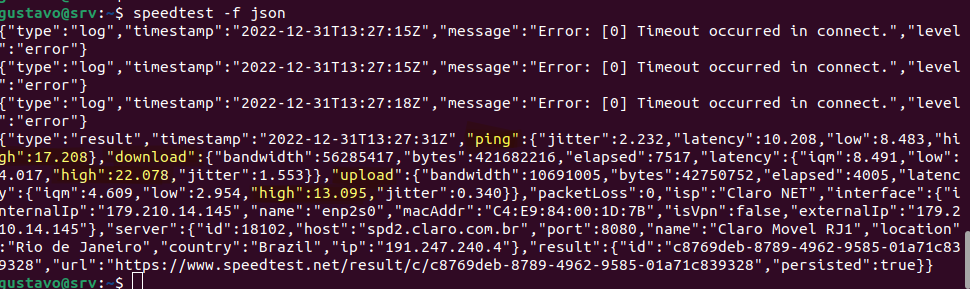
The resulting plots serve as complementary data to the ping graphs, all of that to help me infer if I'm a victim of bufferbloat at any given moment in time.

(I have similar graphs for idle and upload latency measurements from Ookla)
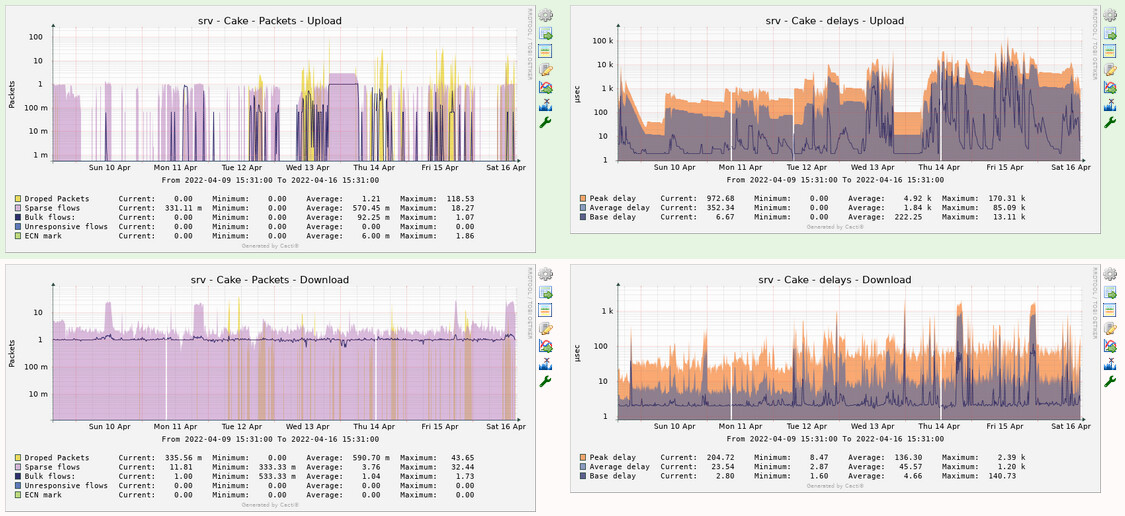
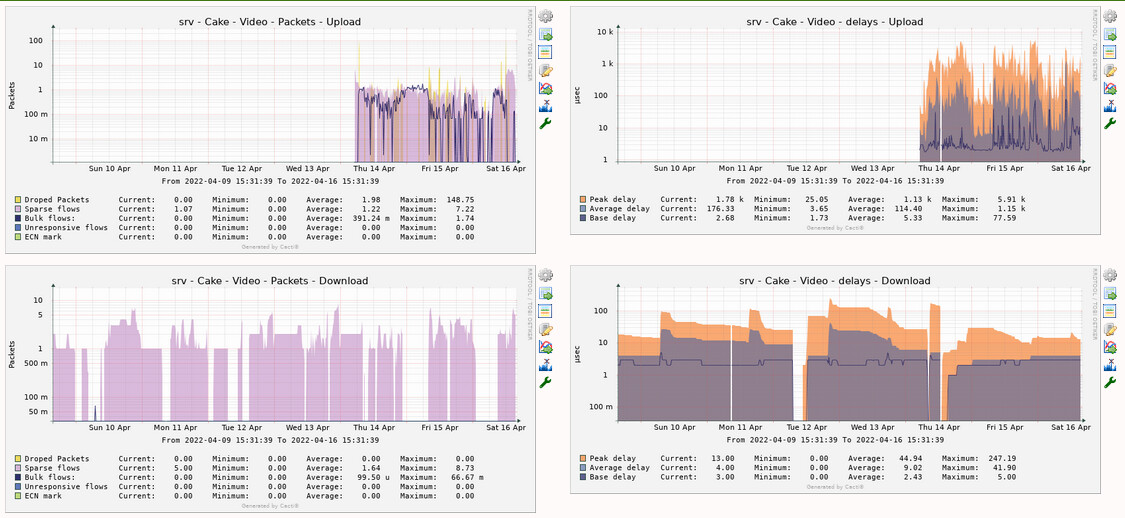
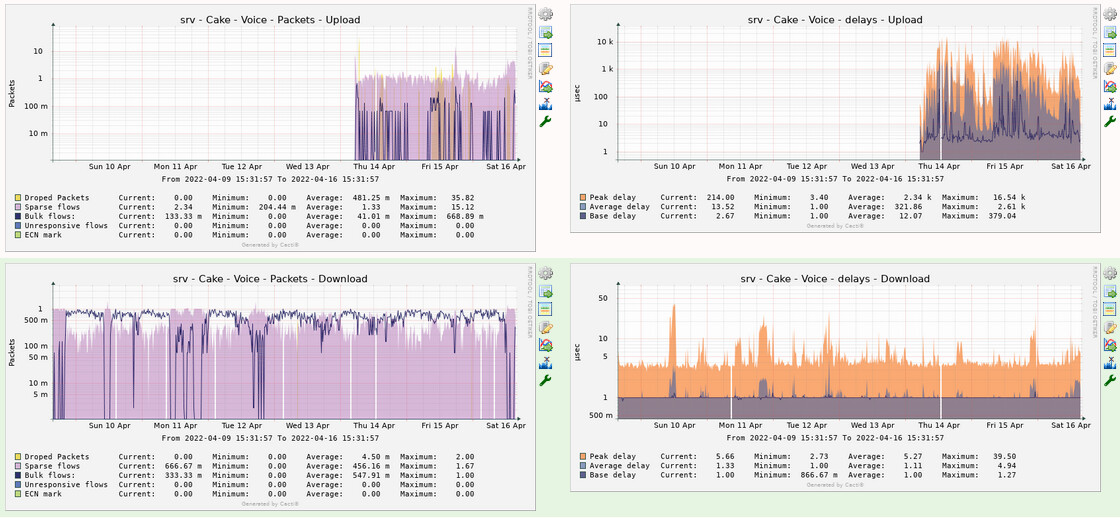
Finally, I think the best and most precise way of measuring /monitoring/plotting bufferbloat is @moeller0's Octave parser, bundled together with @Lynx's cake-autorate script.
Besides being very precise and granular (miliseconds precision, not minute like my plots above), the graphs are also very pretty...

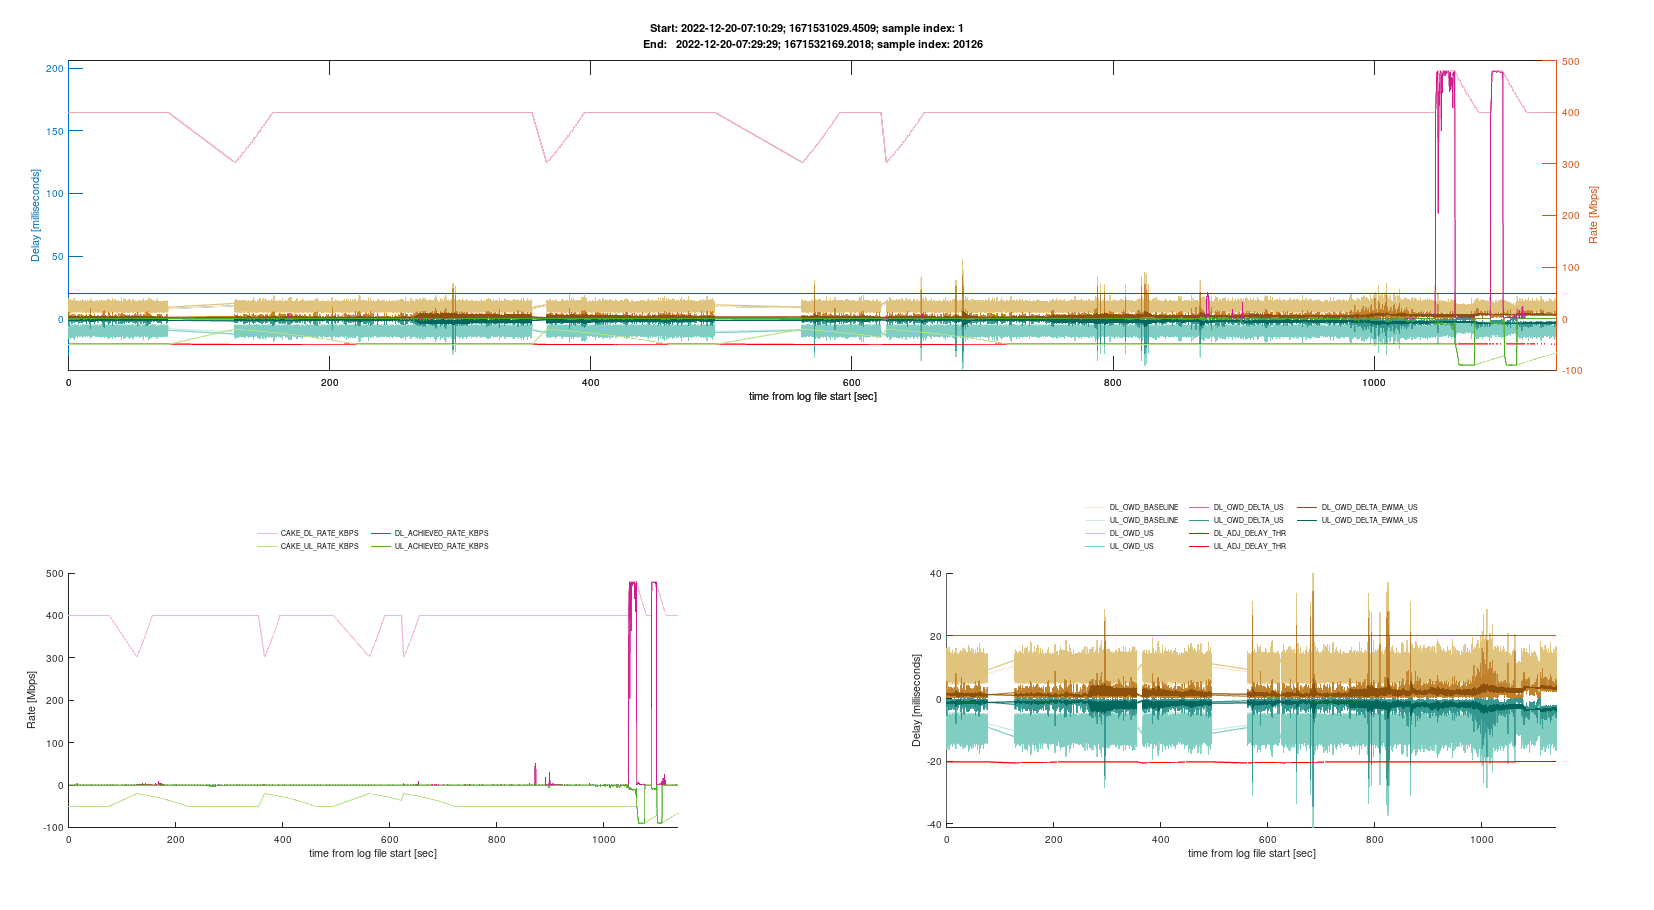
(In this plot, bufferbloat is shown as brownish spikes when they go above the red line threshold, better visualized in the bottom right graph)
You don't have to bother about changing cake bandwidth, since cake-autorate can run in "monitor" mode (it just logs its measurements, but doesn't actually change cake bandwidth limits).
All this to say that this thread was just a starting point, that brought me to cake-autorate script and also helped me realize that my ping graphs can still be useful, although they give me only a rough, imprecise, indirect snapshot of bufferbloat.

1 Like

Sweet! Baby Steps achieved!

PING 1.1.1.1 (1.1.1.1): 56 data bytes

--- 1.1.1.1 ping statistics ---
20 packets transmitted, 20 packets received, 0% packet loss
round-trip min/avg/max = 50.925/65.599/92.772 ms

Sorry, @Bill , but I don't get what you mean... :thinking:

It means we've got the download part of the BB script doing a fine job, didn't burn down the internet or catch my router on fire. This is just one small step to your success.

Ah, ok. So you agree with the download measurement, thanks.

I believe you're referring to the upload part... Well, I guess I'll have to put some money to get some remote server where to upload to. Let me check what I already have (Google Drive, BlackBlaze...).
Meanwhile, any ideas?
Thanks for the feedback.

You will create a lot of useless traffic that way... instead you could just run the RTT measurements continuously and also concurrently monitor and log the network traffic. Then in "post" you can look at the RTTs and detect epochs with higher RTTs than expected and look at the concurrently recorded throughput numbers what traffic was flowing... In essence if you have a reliable well connected RTT reflector and a stable baseline RTT (so a relative constant RTT when the link is not loaded) all you need to monitor/log is the RTT, no real need to create artificial loads... (but logging the throughput as well will allow you to look at how the RTT behaved in epochs with naturally high traffic, so you would simply piggy-back the bufferbloat measurements on real data transfers avoiding too artificial load on ubuntu's infrastructure).

Indeed...

Interesting!
I think I already have it, then.

Latency and Jitter

(Taking the opportunity, do you agree with my jitter measurement?
It's from the same ping command I mentioned in my first post, except that it's the mdev field.)

Network Traffic

Oh, man! ... I completely missed that, thanks for pointing it out. I would probably have my IP blacklisted by Canonical. Although it's a dynamic IP, the graph would be full of gaps...

I think a lot of people seem to be fine with something like the standard deviation as "jitter" while RFC4689 has a slightly different definition, but taking the mdev that ping reports is IMHO fine (assuming you always run ping for the same fixed numbers of samples as you do).

I guess there are servers that are fine to probe here (e.g. nodes of one of the speedtest networks should expect the kind of traffic you want to produce).

1 Like

You could make use of or take inspiration from my bash script here:

It already outputs inter alia the following: timestamps; achieved rx and tx rates; percentage rx and tx loads; ping result lines from one or more reflectors; maintained baselines for each reflector; delays indicative of bufferbloat; and classification of upload and download as either 'low_load', 'high_load' or 'bufferbloat'.

Output lines look like this:

1648887410.862867 11     11     0   0   [1648887410.853793] 1.1.1.1 456    11017  11600  583    0 low_load     low_load     30000  4900  
1648887410.922821 11     22     0   0   [1648887410.914123] 1.0.0.1 456    11019  11900  881    0 low_load     low_load     30000  4900  
1648887410.961900 17     17     0   0   [1648887410.953298] 8.8.8.8 456    46999  51100  4105   0 low_load     low_load     30000  4900  
1648887411.005887 15     0      0   0   [1648887410.997343] 8.8.4.4 456    46568  47100  532    0 low_load     low_load     30000  4900 

Headers are:

(($output_processing_stats)) && printf '%s %-6s %-6s %-3s %-3s %s %s %-6s %-6s %-6s %-6s %s %-12s %-12s %-6s %-6s\n' $EPOCHREALTIME $dl_achieved_rate $ul_achieved_rate $dl_load $ul_load $timestamp $reflector $seq $rtt_baseline $rtt $rtt_delta $sum_delays $dl_load_condition $ul_load_condition $dl_shaper_rate $ul_shaper_rate

This can be run as a service in the background and you could output data to a USB mount. You could just comment out the 'tc qdisc change' lines, since you presumably do not want to actually make any CAKE bandwidth adjustments. Or perhaps you would since you are wanting to measure this.

Overview of the theory and approach (which drew, and continues to rely heavily on, inspiration from @moeller0) is here:

Alternatively I also have this version:

That employs hping3 and uses ICMP type 13 with timestamps to monitor one way delays. It works fine, but hping3 is not an OpenWrt package and has to be built manually. Also reflectors are picky about whether they offer ICMP type 13 and some of those are a bit flaky about it, e.g. change their timestamps/clocks in weird ways - though that is handled to some extent already given the way offsets are updated in the script and we always just look at deltas, which helps.

1 Like

+1; really the only missing piece here is the CPU loads for all CPUs in the system to make it a well-rounded network-monitoring solution (in addition to its day-job as adaptive rate-controller) :wink:

1 Like

Good point. I will add that in. Should I just use /proc/loadavg? It can be slightly misleading where scheduler is not 'performance', e.g. I use 'schedutil' on my RT3200, because the clock rate is lowered, leading to an artificially higher figure. But presumably even with such a scheduler the max loadavg shouldn't exceed number of cores?

Perhaps I should have a separate branch of repository for this but just for monitoring. But then I'd like it to benefit from updates without two parallel tracks diverging. Hmm.

What I would like to see is for all CPUs/HT-siblings 100-%idle... loadavg is not the right measure here...
I would use the cpuN lines from cat /proc/stat

root@turris:~# cat /proc/stat 
cpu  5909064 26936 1697407 210303430 1809247 0 1440728 0 0 0
cpu0 3066461 13859 842812 105338697 943297 0 388277 0 0 0
cpu1 2842603 13077 854595 104964733 865950 0 1052451 0 0 0
intr 1361849891 0 0 0 0 0 0 0 0 0 0 0 0 0 0 0 0 0 0 718231763 0 0 111179 22 0 0 0 0 0 0 0 0 0 0 0 0 0 0 20486552 15267694 147090191 0 0 0 0 0 2811330 0 14517374 0 2 2 0 0 0 0 0 0 0 40 0 0 4 0 3 33 0 0 0 0 0 0 0 0 0 0 0 1 0 113784447 140749112
ctxt 1038967495
btime 1647964976
processes 2324144
procs_running 1
procs_blocked 0
softirq 1549519881 0 187760591 164873342 579513036 5016228 0 297775348 214348509 0 100232827
root@turris:~# cat /proc/stat 

for that purpose, and I would ignore the governor/power scheduler effects... (or I would try to also add information about the CPUs frequencies, but that gets approximate pretty quickly so I think ignoring that is just fine)...

1 Like

Many thanks for taking time to summarize all that information!

Very useful to me, although it'll take some time to digest all of it.

Bookmarked!

As an update, I started monitoring latency, loss and mdev (still addressing to it as jitter on the graph...)

(Interesting to note from the graph above that rain seems to deeply affect link quality, as shown by the spikes from 14 April on, as they match exactly when it was raining...)

I'm also collecting tc numbers to get these (4 graphs for each of diffserv4 tins):

Since these graphs from tc output are minute to minute screenshots, I suspect they give a very blurry representation of cake activity and may not be that useful, since that activity presents fast changes measured to the milliseconds.

However, they still seem to provide rough patterns that are in line with the network usage at the time.

As for @Lynx script, I started running it as a service and collecting the bandwidth changes:

Nominal speed: 500Mbps
Min down: 100 Mbps
base down: 250 Mbps
max down: 400 Mbps
Min up: 10 Mbps
base up: 20 Mbps
max up: 40 Mbps

Update? Sorry if the flurry of changes to my GitHub caused you any issues. I must get round to proper versioning and going easy on the commits.