Any Interactive Graph showing packets for OpenWrt

As the title says ...
I'm curious if there is any packages that I can install and set up to show and monitor packets,
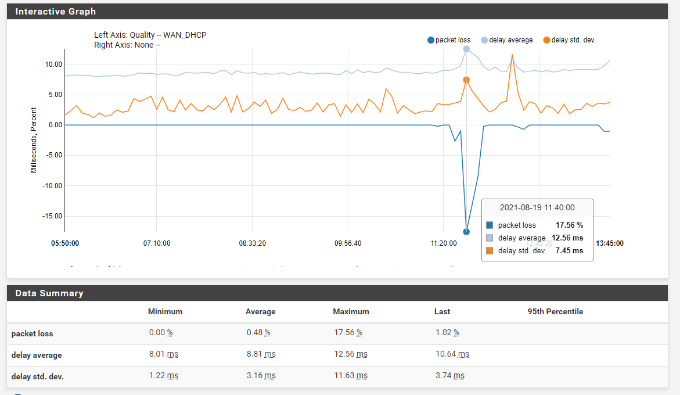
Such as with what pfSense has by default.

I'd love if there was a Interactive graph that displays

  1. packet loss.
  2. delay average
  3. delay std dev.

Could such a feature as the "Interactive Graph and Data Summary" with in pfSense work on oWRT ?

Here is a example of pfSense graph showing packets. I'm referencing

PL

1 Like

Have a look at collectd: https://openwrt.org/docs/guide-user/perf_and_log/statistic.collectd

2 Likes

Yeah I seen this before but I don't see the any packet loss graphs or delay average unless I'm doing it wrong. I also checked out NetData a bit but also again I did not happen to see anything related to what I'm looking for as in to a simple graph that just shows packet loss as described in OP.

1 Like

I don't think there is going to be an exactly pfSense comparative option for you in OpenWrt.

collectd I believe would be the closest equivalent functionality. There is the potential option of adding an additional plugin to collectd to perform this, if it doesn't exist. The closest might be ICMP monitoring, with graphing.

1 Like

LuCI statistics - ping plugin (which uses collectd as the underlying data tool).

1 Like

Okay so I got both options working need to play around with settings more but I ran in to a issue.

I can't install any more packages as my device thinks I've ran out out space..

i.e.
Collected errors:

  • verify_pkg_installable: Only have 0kb available on filesystem /overlay, pkg XXX needs X
  • opkg_install_cmd: Cannot install package XXX.
Only have 0kb available on filesystem /overlay

root@LEGION:~# df -h
Filesystem                Size      Used Available Use% Mounted on
/dev/root                 3.0M      3.0M         0 100% /rom
tmpfs                     3.9G     15.9M      3.8G   0% /tmp
/dev/loop0              251.1M    181.1M         0 100% /overlay
overlayfs:/overlay      251.1M    181.1M         0 100% /
/dev/sda1                15.7M      3.8M     11.6M  25% /boot
tmpfs                   512.0K         0    512.0K   0% /dev

Not sure why my /overlay is so small and FULL ... my box is sort of uh over kill as you might say.

Now from my understand and, Yes. I know a simple reboot will flush that and I'll be good again for a bit.
The box uptime is of a while now I'd rather not reboot ... even tho I know to fix I'll eventually have to.

But my question is now seeing that I have 8GB ram and around *500GB SSD for this device.
** Tho when I first formatted I was lazy and did the default /dev/sda2 size not that it should matter.

Okay so main question now:
How would I go about extending the /overlay something lager so this wont happen in the future?

If you have USB, it's easy:

Yeah I actually saw that last night. Gave it about 5 minutes and got disk is full errors still. So I decided to flash the whole hypervisor. Anywho I was on a older [squashfs.img.gz] Now on the latest an greatest [combined-ext4.img.gz] Just had to SCP over my DATA.BACKUP :cheese: Seems to have done the trick. :+1:

 -----------------------------------------------------
 OpenWrt 19.07.8, r11364-ef56c85848
 -----------------------------------------------------
root@LEGION:~# df -h
Filesystem                Size      Used Available Use% Mounted on
/dev/root               110.0G    141.0M    109.9G   0% /
tmpfs                     3.9G      6.9M      3.8G   0% /tmp
/dev/sda1                15.7M      3.8M     11.6M  25% /boot
tmpfs                   512.0K         0    512.0K   0% /dev
root@LEGION:~#

Now back to the OP at hand with attempting to generate useful graphs indicating loss % ages :slight_smile:

This:

  • luci-app-statistics
  • collectd-mod-ping

Optional:

  • collectd-mod-cpufreq
  • collectd-mod-sensors
  • collectd-mod-thermal