Huh, don't recognize that CPU indicator. You can see sirq, which is valuable, but greater resolution would be nice. In basic top, you get the percentages in text, in htop that and a text based bargraph, but across separate cores.
Guestimating will get you in the ballpark, testing to verify and adjusting will find out how high you can set it and still stay ahead of the bloat. DSLReports is/was good for that with their graphing, see this link for a standardized setting:
[http://www.dslreports.com/speedtest/69834829]([SQM/QOS] Recommended settings for the dslreports speedtest (bufferbloat testing))
You might have to limit/eliminate sites to get it to work, though it looks like you're doing OK from your location. Key thing that many seem to miss, is the hidden detailed graphs of the bloat when you click on the speed bars, especially with the hi res bufferbloat switch on:
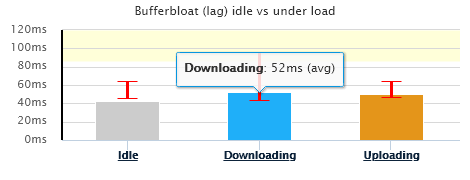
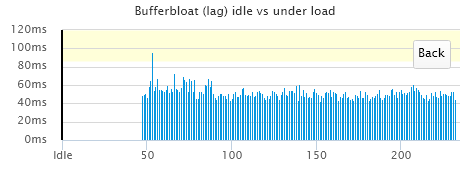
Just observe this and adjust your speeds, you can clearly see when the bloat starts in, and pick a speed just below that.