Note this is work in progress, and will see some more edits....
Tuning one's own internet access for low latency under load (aka bufferbloat) can be quite satisfying and the end result is a generally better internet experience. To make the tuning fun and efficient it can be quite helpful to know which tools are available to assess the current latency-under-load behaviour. In my experience there are several levels of tooling available, all with different pros and cons. Here I try to give the main categories I see, with examples and a quick evaluation.
The browser-based tests
These tend to be the most convenient, as "everybody (and almost every device) has a browser". That is generally true, and modern browsers are marvels of utility, yet, they are not perfect for high fidelity, high-quality measurements (see below). Still for quick tests or for getting started these are invaluable.
1) Waveform's bufferbloat test (https://www.waveform.com/tools/bufferbloat)
Pros:
- Measures latency (and throughput) during idle, download, and upload epochs.
- High number of latency samples
- Shows latency distributions (and summary statistics) for the three epochs separately
- Allows exporting data as .csv file (contains all latency samples, but only aggregate summaries for the throughput)
- Operated from cloudflare CDNs so typically will find a reasonably close by server location.
Cons:
- Tests are relative short (common for on-line tests, someone needs to pay for the server capacity)
- No bidirectionally saturating measurement phase
2) Cloudflare's Speedtest (https://speed.cloudflare.com)
Pros:
- Measures latency (and throughput) during idle, download, and upload epochs.
- Measures throughput for differently sized objects
- Also includes a packet loss test
- Shows latency distributions (and summary statistics) for the three epochs separately
- Allows exporting data as .csv file (contains only aggregate summaries for throughput and latency), latency numbers can be manually scraped from the web page...
- Operated from cloudflare CDNs so typically will find a reasonably close by server location.
Cons:
- Tests are relative short (common for on-line tests, someone needs to pay for the server capacity)
- No bidirectionally saturating measurement phase
- Relative low number of latency samples
NOTE: the results page contains the local IP address as well as maps of the server location and the estimated client location. If you consider these sensitive, redact them before sharing. In my case the geoIP is just really far off (100s of kilometers) and my IPv6 prefix changes every day, so I am not concerned sharing these, but be aware...
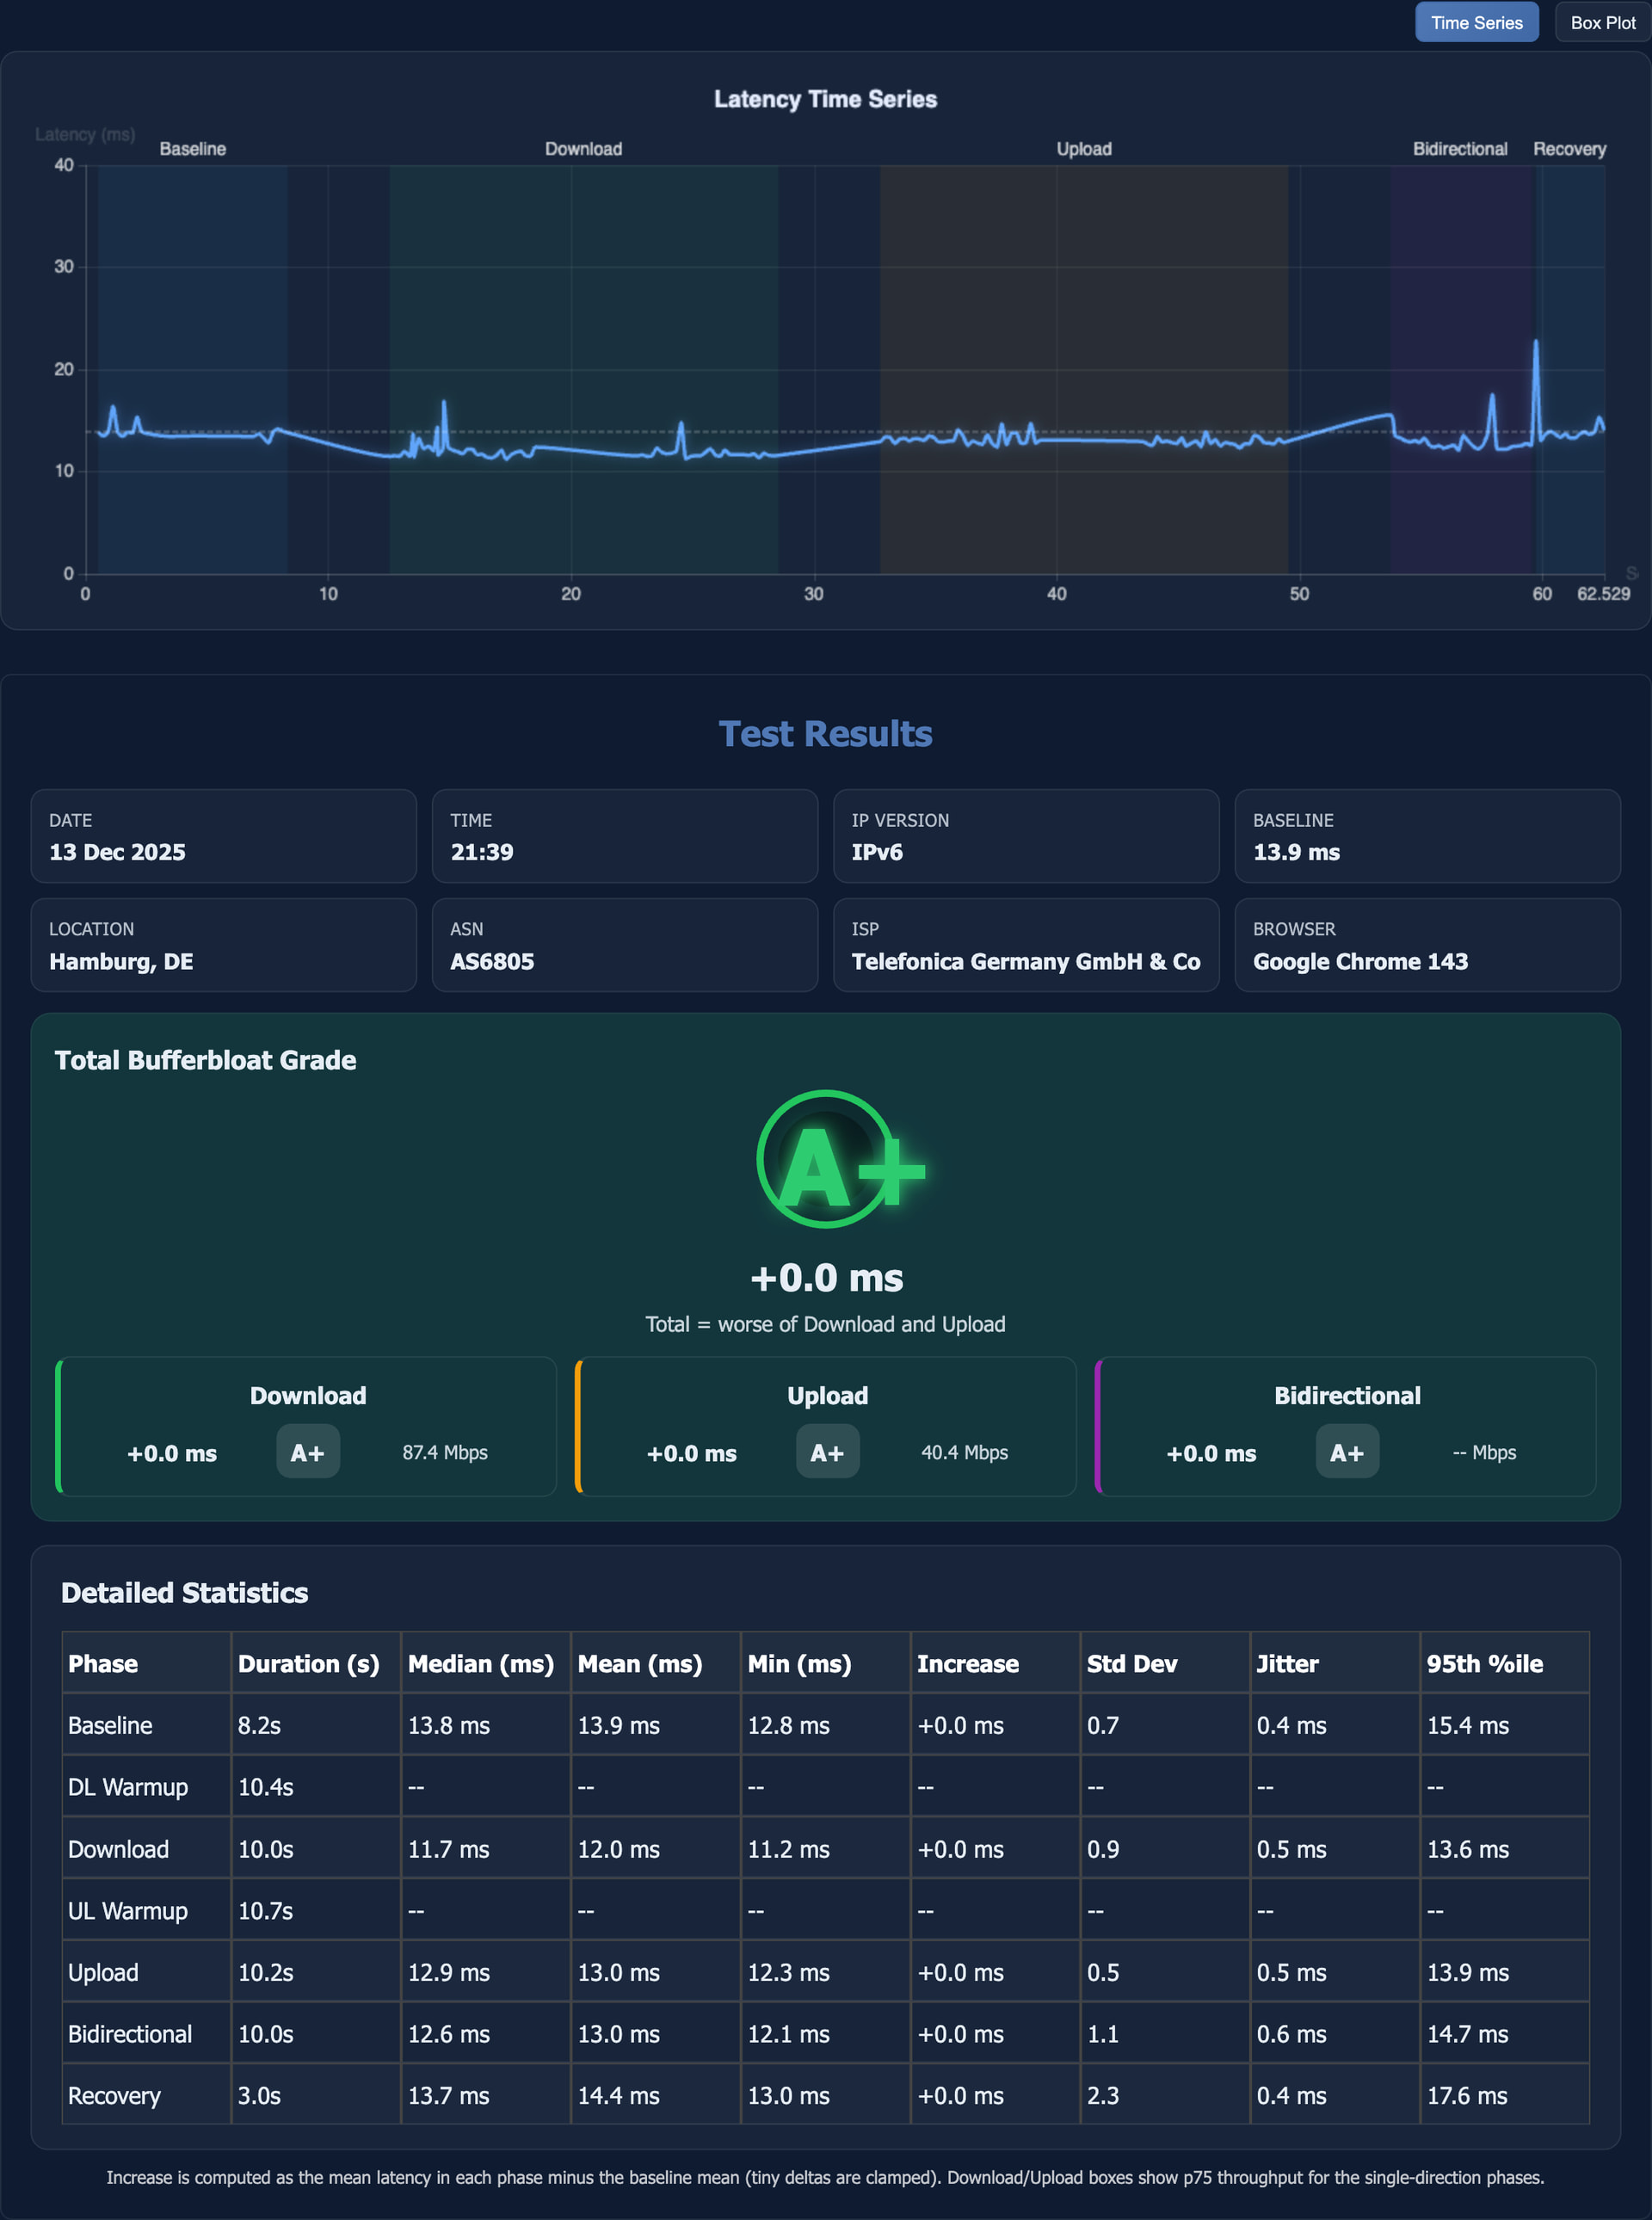
3) the new kid on the block: the LibreQoS Test (https://bufferbloat.libreqos.com)
Pros:
- Measures latency (and throughput) during idle, download, upload, as well as concurrent down- and upload epochs.
- Shows latency distributions (and summary statistics) for all epochs separately
- Offers both time series and box plots for the latency results
- Allows exporting the full result page as .png image.
EDIT: the png now exports the relevant part of the results only which helps making the png smaller and easier to past and view in fora like this. - Operated from cloudflare CDNs so typically will find a reasonably close by server location.
- Virtual household test, in which 4 different usage profiles (games, video call, video streaming, background update) are tested concurrently, this test shows how well different uses are separated (see post 18 for current screenshots from both libreqos tests)
Cons:
- No digital data export yet
- No option for longer measurement durations (same as the other on-line tests)
NOTE: As of 2025 12 14 you need to click on the advanced details "header" to see and export the "Detailed Statistics" table, I typically always want that table. Also note that this table contains noticeable fewer columns in smartphone mode, so set your mobile browser to "Desktop site" (chrome, firefox, no idea how mobile safari and other browsers handle that), before you start a test as switching post-test will not reveal the "missing" columns.
These are the main browser tests useful for debloating a link, but there are two additional capacity tests that can be useful
4) Ookla's Speetest (https://www.speedtest.net)
Pros:
- Large network on servers, typically it will find servers close by
- Measures throughput and latency under load
Cons:
- Latency per epoch only reported as summary statistics (aggregate, Low, and High, and sometimes Jitter). NOTE you need to select the Results history and click the test session of interest to see the latency statistics.
5) Netflix fast.com (https://fast.com)
Pros:
- Uses Netflix' own large content delivery network, typically it will find servers close by
- Measures throughput and latency under load
- Allows to configure number of flows as well as test duration
Cons:
- Loaded latency results a only reported as single aggregate number (not even split for down- and upload)
IMHO the first three are decent tools in their own right, with the newcomer 3) currently my favourite. The last two are less than ideal, but better than nothing ![]()
The public command line interface (CLI) tests:
These are command line utilities that talk to public servers and hence are easy to use, but are more limited than tests where one controls both sides
1) networkQuality (either Apple's own implementation included in Apple OSs or the great go-responsiveness (https://github.com/network-quality/goresponsiveness))
Pros:
- Use servers from apple's CDN so should be able to find close by servers
- Throughput and concurrent latency measurements
- Summary reporting of latency and throughput statistics
- Allow saving latency sample data to file
- Allow to configure either sequential tests of both directions or a concurrent test with bidirectional saturation.
Cons:
- the two implementations have similar capabilities but are not identical, only a con if one wants to mix data from both
- Tests are currently aiming for short run times, and offer no (apple) or little configurability of run time (goresponsiveness)
2) Oookla's speedtest app
Pros:
- similar to 4. above
Cons:
- similar to 4. above
The private command line interface (CLI) tests:
netserver/flent (https://flent.org)
This IMHO is the GOAT for self testing, but requires to set up a remote netserver on the other side.
iperf2 (https://sourceforge.net/projects/iperf2/)
In spite of still being on sourceforge (I think it moved to sourceforge when SF was the new hotness ![]() ) iperf2 is under active development and has bunch of latency related features. Like flent/netserver it also requires to set up remote a server on the far side.
) iperf2 is under active development and has bunch of latency related features. Like flent/netserver it also requires to set up remote a server on the far side.
iperf3 (https://iperf.fr)
Quite popular, and NOT in any way shape of form the successor of iperf2 (rather both develop in parallel), there are some remote servers publicly available. Popular, I believe but lacks the depth of iperf2 regarding latency tests.
networkQuality/goresponsiveness
These can be run against one's own servers (these servers are essentially just web servers). Apple's networkQuality binary can also be started in local server mode and used for local tests.
crusader (https://github.com/Zoxc/crusader)
Great tool for local testing. Simple to use, offers both server and client, and has a great default test set: Download, Upload, Concurrent Down- and Upload, interspersed with small recovery periods for queues to dissolve. Creates nice graphical output. Will require to set up one's own server if to be used over the internet.
Notes on browser measurements
As I said above, modern browsers are marvels of utility, but getting high precision temporal network measurements out of them is a challenge. For the same tests different browsers can behave differently and return different results, so with browser tests always keep in mind that you are testing the browser itself just as much as the network, ideally repeat tests with different browsers (ideally different lineages, like safari, mozilla, chrome/chromium). See the Safari example in the next post and compare with the firefox measurement under otherwise very similar conditions, clearly some latency samples reliably and repeatably came from Safari and did not reflect the network itself.