Finally managed to start testing, will take a while before I can comment upon the stability.
Using a build that @stonerl gracefully supplied (thanks!), with a recent stable firmware blob from an FB7490 (5.9.1.4).
All I can say so far is that the BT HomeHub5A seems to have worse analog input stages than the bridged (broadcom) Zyxel vmg1312-b30a it replaces, as it shows less SNR and especially for the upload o lower sync (35.5 instead of 37 Mbps), error counters and retransmissions seem okay, but uptime is just ~12 hours, so in no way representative yet.
I have switchted to master with the DSA changes now, and will run this build for some time as a baseline. Had an occasional hang yesterday so I'm not sure the problem was related to the code added in this branch.
As far as I can tell vectoring is enabled:
Line State: Showtime with TC-Layer sync
Line Mode: G.993.2 (VDSL2, Profile 17a, with down- and upstream vectoring)
Line Uptime: 1d 1h 34m 34s
Annex: B
Data Rate: 116.797 Mb/s / 35.483 Mb/s
Max. Attainable Data Rate (ATTNDR): 137.986 Mb/s / 35.484 Mb/s
Latency: 0.14 ms / 0.00 ms
Line Attenuation (LATN): 9.9 dB / 8.3 dB
Signal Attenuation (SATN): 9.9 dB / 8.3 dB
Noise Margin (SNR): 11.9 dB / 9.6 dB
Aggregate Transmit Power (ACTATP): -3.4 dB / 14.5 dB
Forward Error Correction Seconds (FECS): 0 / 17666
Errored seconds (ES): 0 / 7
Severely Errored Seconds (SES): 0 / 3
Loss of Signal Seconds (LOSS): 0 / 0
Unavailable Seconds (UAS): 166 / 166
Header Error Code Errors (HEC): 0 / 0
Non Pre-emptive CRC errors (CRC_P): 0 / 0
Pre-emptive CRC errors (CRCP_P): 0 / 0
ATU-C System Vendor ID: Broadcom 194.25
Power Management Mode: L0 - Synchronized
and it seems error samples are not dropped.
current_dsl_struct.dsmsg
input_string: 'nReturn=0 eVectorStatus=2 eVectorFriendlyStatus=0'
Return: 0
eVectorStatus: 2
eVectorFriendlyStatus: 0
return_code: 'DSL_SUCCESS'
dsl_sub_cmd_name: 'DSM_StatusGet'
current_dsl_struct.dsmstatg
input_string: 'nReturn=0 n_processed=479156 n_fw_dropped_size=0 n_mei_dropped_size=0 n_mei_dropped_no_pp_cb=0 n_pp_dropped=0'
Return: 0
N_processed: 479156
N_fw_dropped_size: 0
N_mei_dropped_size: 0
N_mei_dropped_no_pp_cb: 0
N_pp_dropped: 0
return_code: 'DSL_SUCCESS'
dsl_sub_cmd_name: 'DSM_STATisticsGet'
Will report on the longer term performance/stability.
Addendum:
in the past dsmstatg looked like this:
current_dsl_struct.dsmstatg
input_string: 'nReturn=0 n_processed=0 n_fw_dropped_size=14680 n_mei_dropped_size=0 n_mei_dropped_no_pp_cb=221288 n_pp_dropped=0'
Return: 0
N_processed: 0
N_fw_dropped_size: 14680
N_mei_dropped_size: 0
N_mei_dropped_no_pp_cb: 221288
N_pp_dropped: 0
return_code: 'DSL_SUCCESS'
dsl_sub_cmd_name: 'DSM_STATisticsGet'
I just noticed this, haven't tried it yet, but nice work!
Should we add those stats to the ubus output? Any other values that are missing?
What exactly is a error sample in this case? Are there any concerns sending those?
Patches to do exactly that, looks like this:
	"erb": {
		"processed": 4783,
		"dropped_fw": 0,
		"dropped_irq": 0,
		"dropped_setup": 0,
		"dropped_driver": 0
	},
I'm not yet sold on the names, I tried to avoid lantiq specific names and went by the comments in the drv_mei_cpe-1.5.17.6/src/drv_mei_cpe_interface.h header. Consider it a draft, so feedback is welcome:
https://dpaste.com/FM4LTSWZ3.txt
https://dpaste.com/4UBJSAQFS.txt
The according prometheus-node-exporter-lua patches:
https://dpaste.com/2MPJUK52B.txt
https://dpaste.com/H3CTVYQX3.txt
Those patches will work with or without Jan's patches, in case anyone want to use this for comparing metrics.
2 Likes
An error sample tells how much the actually received signal differs from a perfect undistorted signal (it is calculated from the difference between the received data sample and the expected QAM constellation point, this Wikipedia article shows the general principle of an error vector). The VCE needs this information for downstream vectoring (crosstalk from neighboring lines is pre-compensated in the downstream signal). The full details are in ITU-T G.993.5 (linked in a previous post).
These counters are specific to the Lantiq driver architecture anyway (the standard doesn't mandate any counters for vectoring error reports at all), so it probably doesn't make sense to find more generic names. In fact, they are even specific to VR9/VR10 modems. For VR11, this is handled in firmware and only n_processed and n_fw_dropped_size are valid (and an additional value is added). But for now only VR9 modems are supported in OpenWrt, so that doesn't really matter at this point.
Mmmh, one unsolicited DSL resync today (the modem-router itself stayed up, so not a massive electricity glitch), slightly lower upstream sync, no real errors accumulated (except for a few FECS in upstream direction)... also no useful obvious diagnostics in any of the values returned from the firmware blob if queried with . /lib/functions/lantiq.sh ; dsl_cpe_pipe.sh... similar to the error of the old days, with unenforced resyncs often multiple times a day...
I will keep the experiment going for a few more days, to see wether this was a one off event or whether that truly is as in the past... (this time, I am pretty relaxed, as I can switch over quickly to the broadcom-based zyxel modem which proved it self to be quite stable on this link*).
*) Matching the anecdotal reports of "more harmony" between Broadcom-modems and old broadcom profile 17 line-cards...
Alright, thanks.
And while some of this is indeed lantiq specific, I do consider ubus values (once they're merged) like an api. It's possible to change them, but better try to find good initial names to avoid potential breakage of downstream users (as the shift to ubus metric showed).
"pp driver callback not set" is rather implementation specific and the opposite of self explanatory  We might as well just something like "internal setup error" or whatever...
Yes, I agree it makes sense to pick good names from the start. It's just that all of the dropped_* values are entirely specific to the Lantiq VR9/VR10, and I'm not sure if generic names actually make things simpler when interpretation of the values is always going to depend on the actual implementation.
I think the best way to actually make this more independent from the implementation would be to add a combined dropped counter which is the sum of all individual counters. The individual values would then only provide additional information, which may or may not be available depending on the actual device (as we already know there is only a single drop counter for VR11/VRX518).
Looking at the names, dropped_irq should definitely be renamed, as n_mei_dropped_size is not related to interrupts (it is incremented when the data received from the firmware has an invalid size). A better name would be dropped_invalid. Renaming dropped_setup to something like dropped_missing_driver could make things clearer for n_mei_dropped_no_pp_cb (but I realize this makes it quite implementation-specific again).
Just as a reference what kind of information is available on non-Lantiq modems, this is from a Broadcom modem (although Broadcom xDSL support in OpenWrt is extremely unlikely to ever happen):
root@modem:~# xdslctl info --vectoring
xdslctl: ADSL driver and PHY status
Status: Showtime
Last Retrain Reason:    0
Last initialization procedure status:   0
Max:    Upstream rate = 54452 Kbps, Downstream rate = 345742 Kbps
Bearer: 0, Upstream rate = 46720 Kbps, Downstream rate = 292030 Kbps
Bearer: 1, Upstream rate = 0 Kbps, Downstream rate = 0 Kbps
Vectoring state: 1
VCE MAC Address: 0:19:8f:1c:c0:50
Total error samples Ethernet pkts sent: 9187556
Total error samples Ethernet pkts discarded: 0
Total error samples statuses sent: 2296889
Total error samples statuses discarded: 0
In this case, the last two lines would correspond to the processed and dropped values.
I like 'sent' and 'discarded' where the latter is just the sum. Any maybe that's sufficient and we don't need the detail of the 4 distinct values at all?
Btw, my initial idea was to use a name related to the source of where the dropping occurred. And n_fw_dropped_size has this comment: Most likely this happens if the error vector data handling (within interrupt) is not fast enough. But as mentioned: not sold on those names
That sounds good. Adding more detailed information is always possible at a later point.
The thing about n_fw_dropped_size is that we don't really know all possible reasons for the firmware to drop error reports, especially for VR11/VRX518 (which is somewhat likely to be supported in the future) where this is the only drop counter.
Also, the one you named dropped_irq is n_mei_dropped_size, which really isn't related to interrupts (the size check happens in the interrupt handler, but the callback in the vectoring driver is also called from there, so basically everything runs in the interrupt handler, except for the packet queuing in the end).
From the actual code (and not just the comments), I would describe the different counters like this:
- n_fw_dropped_size: dropped in the firmware for unknown reason (maybe due to slow handling on CPU)
- n_mei_dropped_size: dropped due to invalid size
- n_mei_dropped_no_pp_cb: dropped due to missing vectoring driver
- n_pp_dropped: dropped in the vectoring driver
Oh, see, already picked the wrong one. It's settled, let's start with just 2 vars then
Without your patches I had n_processed=0 and n_mei_dropped_no_pp_cb=$value, and now I have n_processed=$value and the rest=0, so maybe that's really all we need.
First impression of the patch set:
Before:
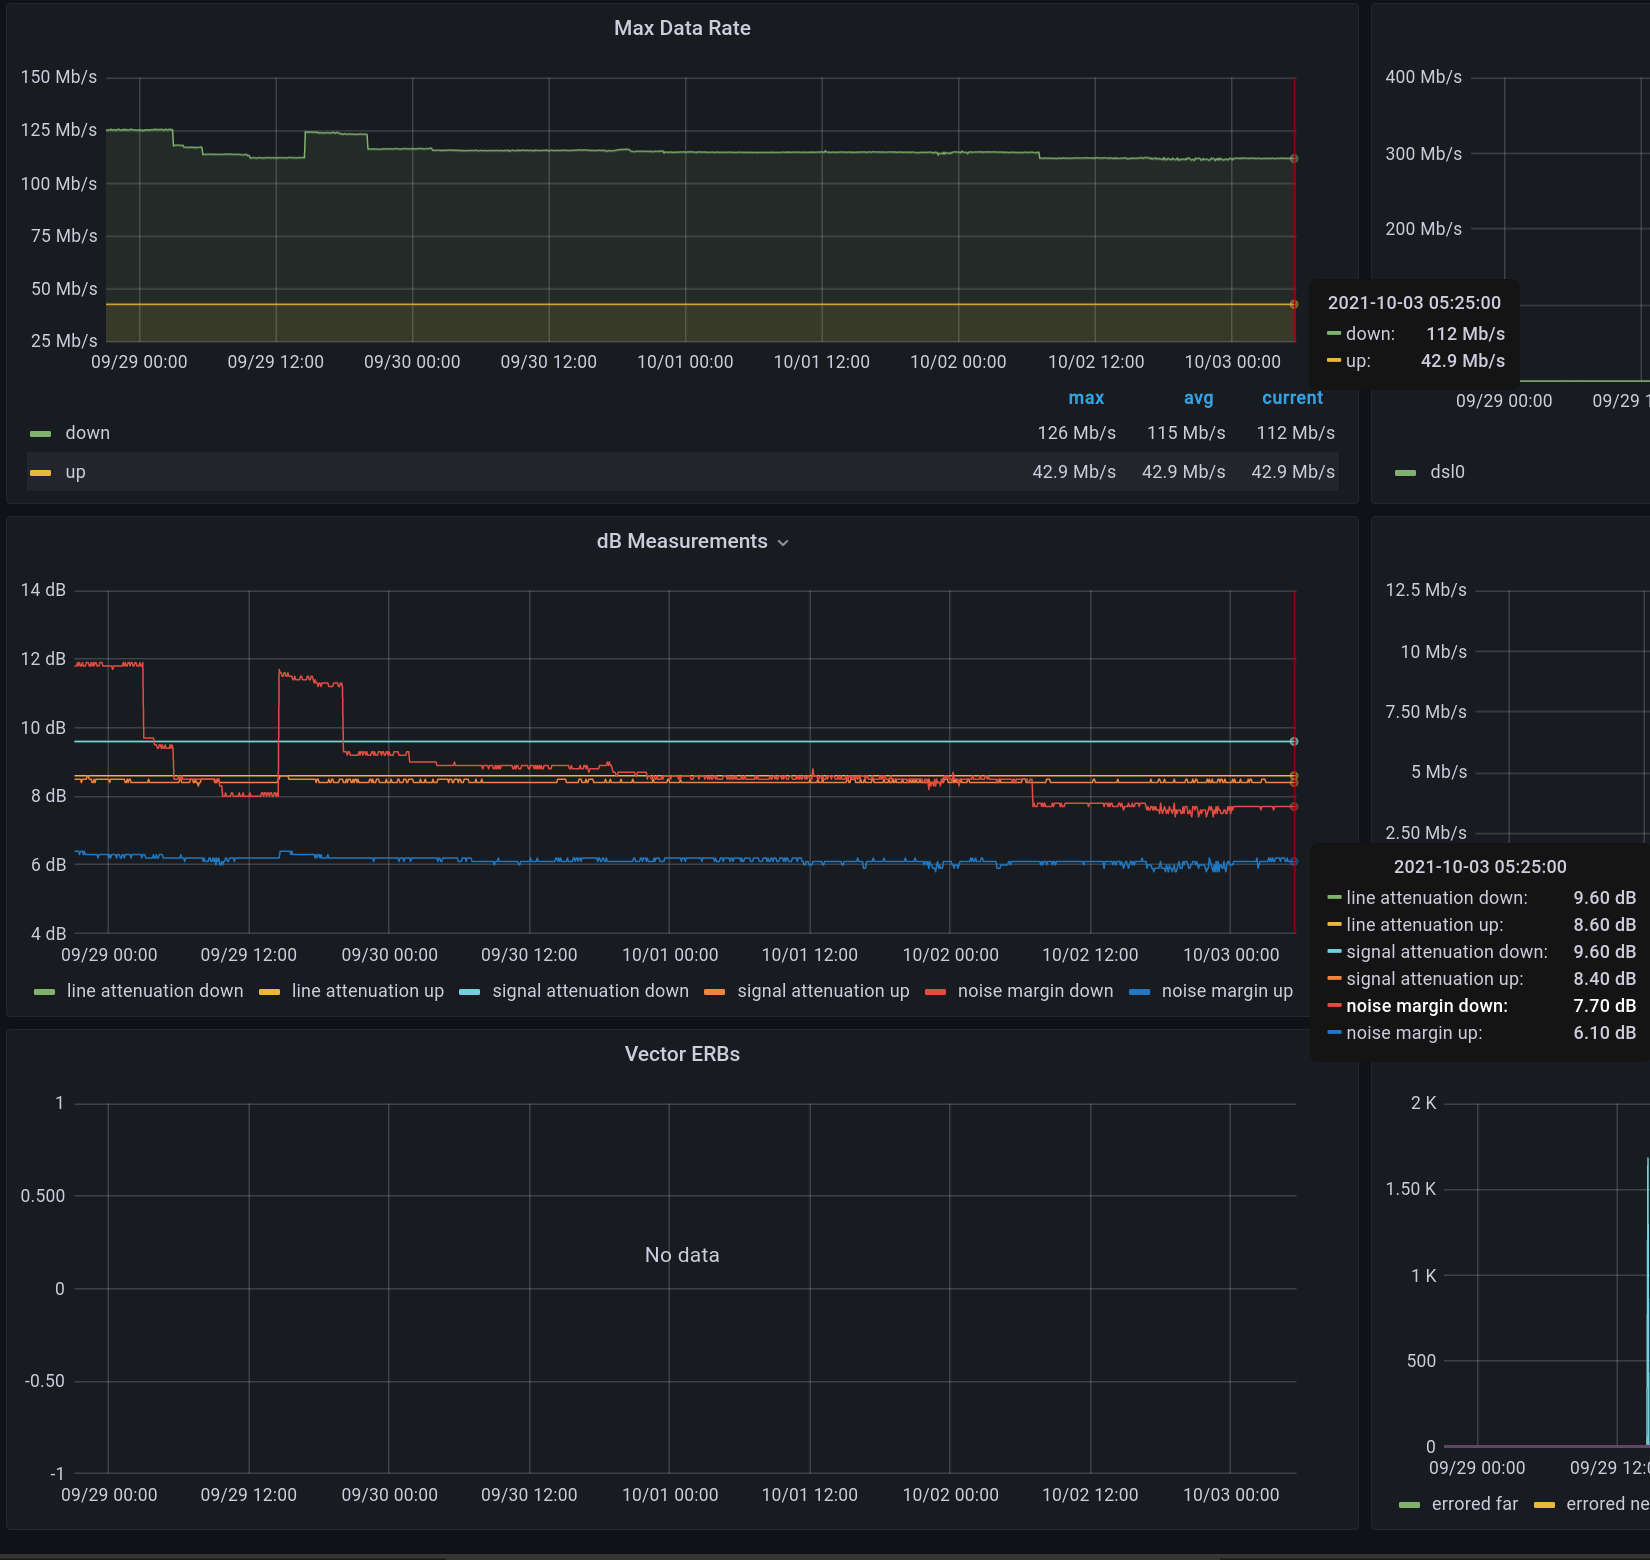
That's ~3.5 days right after a reboot. SNR starts at ~12dB and starts to deteriorate after just ~3h.
After:
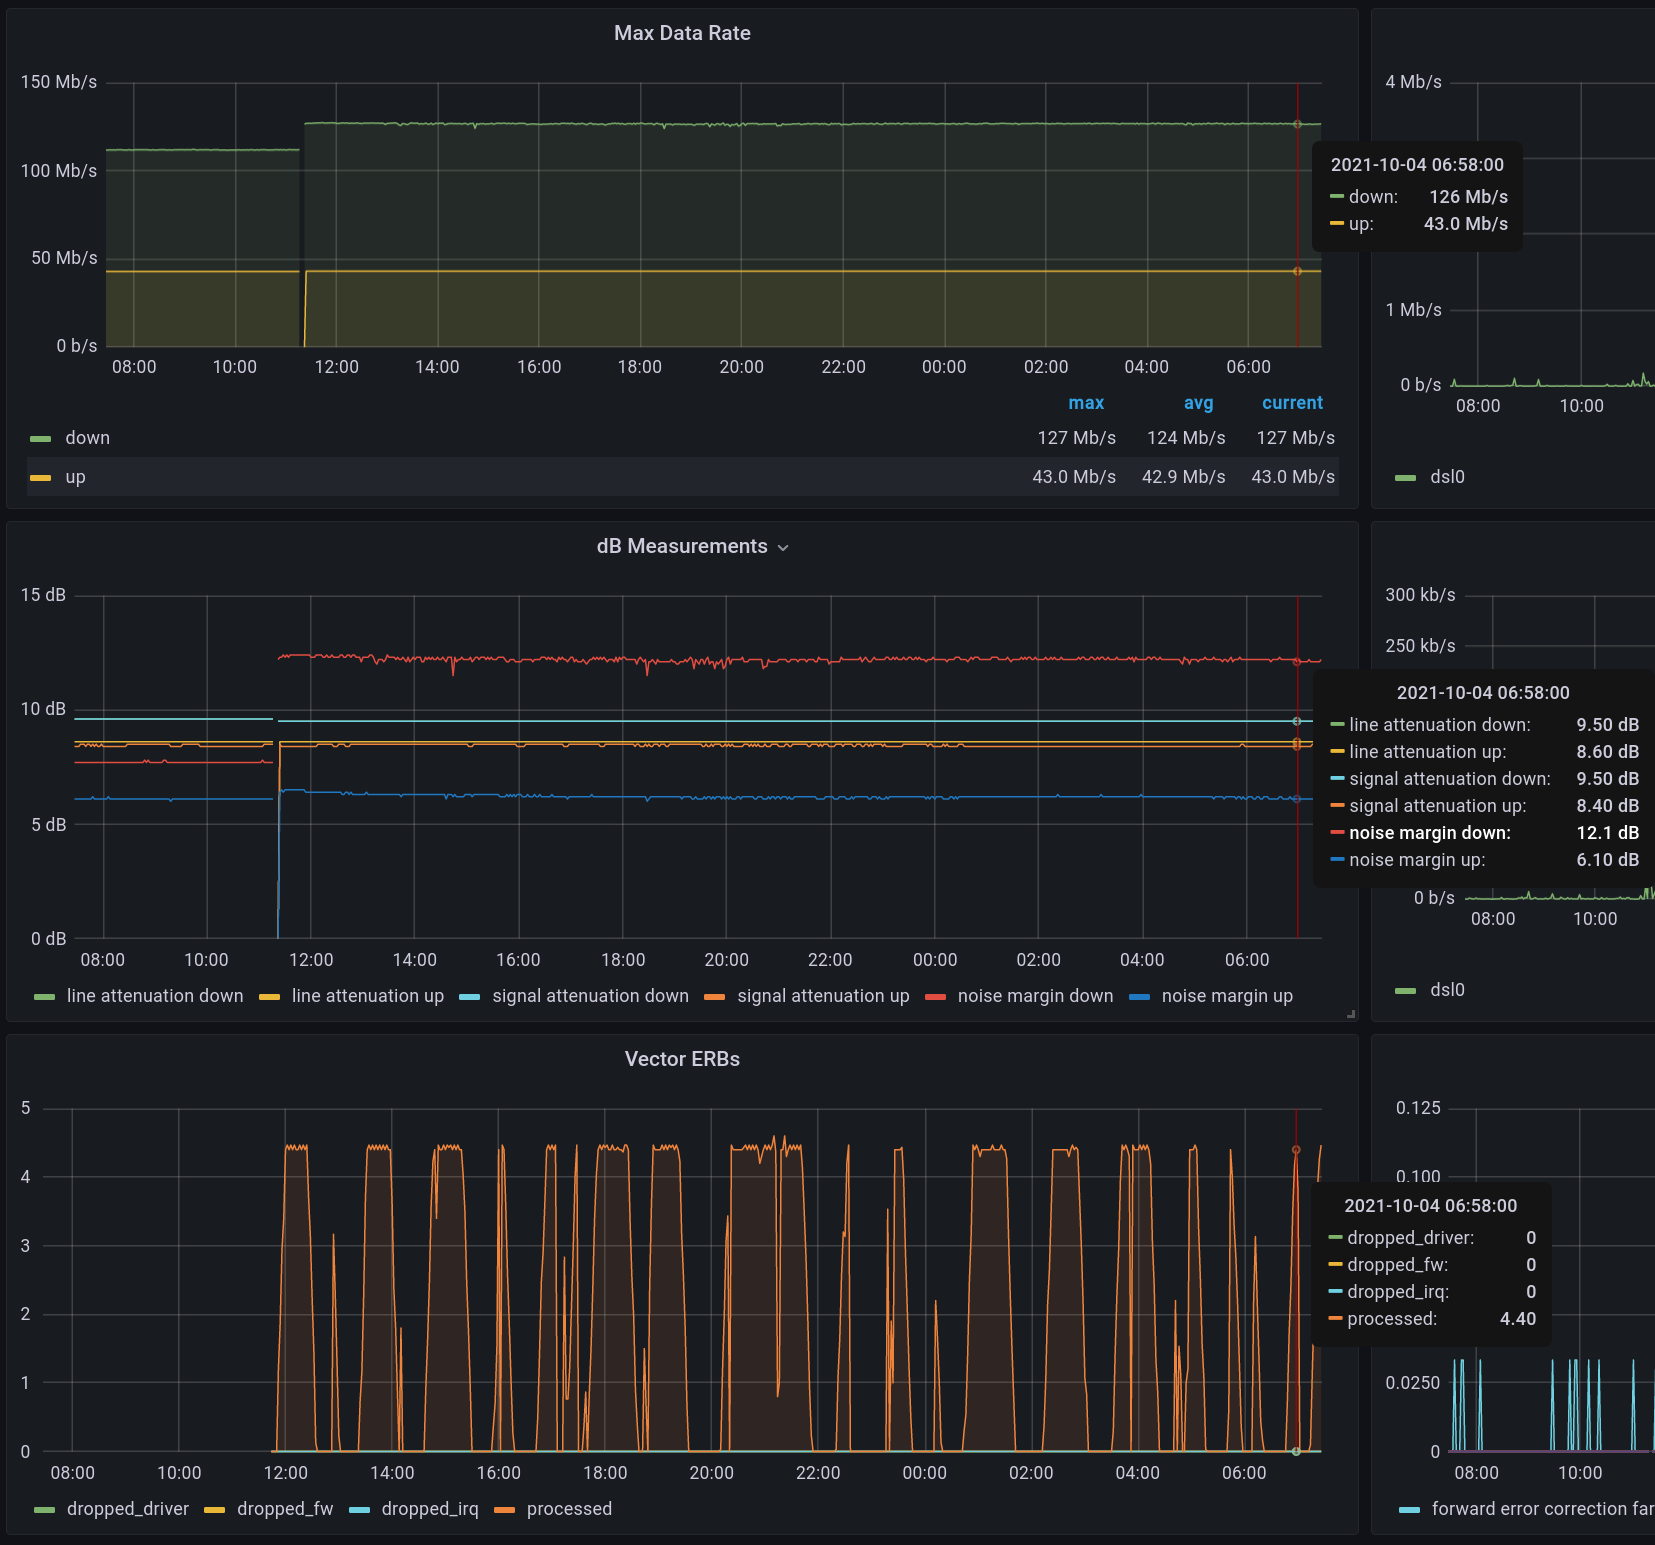
That's just the last 24h, but so far SNR looks stable at ~12dB.
There're about 4 sent error samples per seconds, and those seem to get sent if upstream is in use.
PR for the ubus metrics:
3 Likes
That is the expected result. As long as n_processed increases and all the others stay at roughly 0, everything should be fine. The individual values would mostly be useful to find out what goes wrong in case there are any dropped ERBs.
This sounds interesting, I would have expected the ERBs to be sent more regularly. During my testing, the ERBs were sent roughly every 50 seconds, in bursts of 65 ERBs (fragmented into 130 packets) over about 4 seconds. This is with a Nokia (Alcatel-Lucent) MSAN, but the behavior may be different for other vendors, as the VCE decides when to request ERBs.
In case you want to look at this in more detail, this is possible using tcpdump, as described in a previous post. The vendor is also visible from the destination MAC address.
Without counting packets but just from watching the tcpdump output it does looks like the behaviour you're describing.
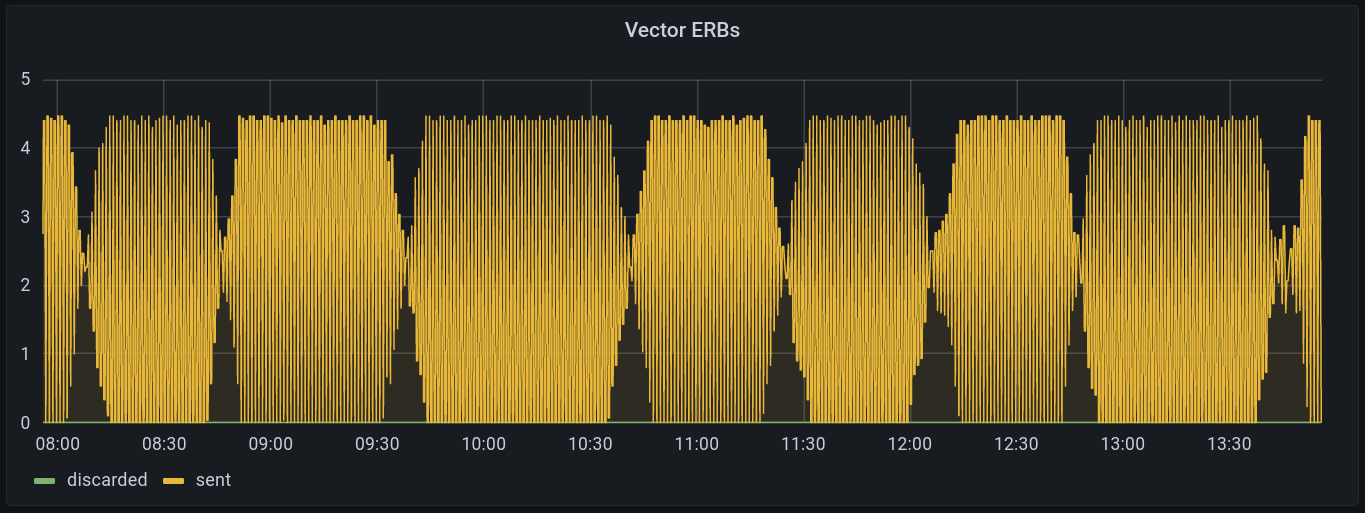
That's probably an artifact of my scrape interval and how counter increases are visualized here.
Here's a 6h zoom:
1 Like
Meanwhile, I'm using these patches for +1 week now. The results are rather clear:
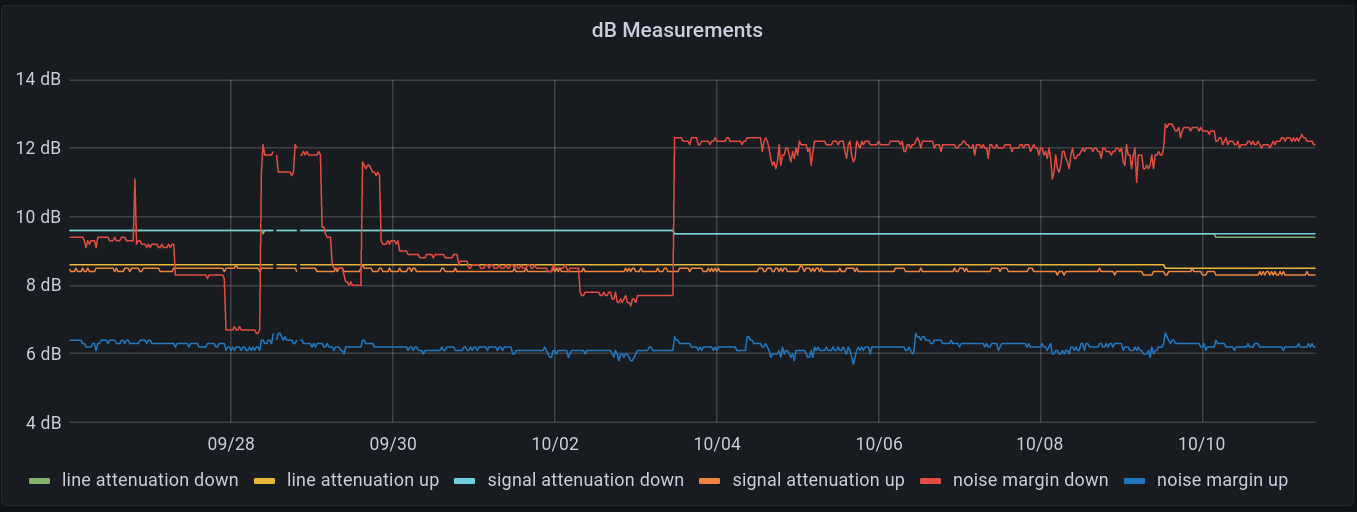
The steep reoccurring line deterioration is gone. There're SNR fluctuations, but those are probably normal (the street is being worked on and we have the builders in house too).
I'd say this can be thrown in a PR 
I made a clean build from this branch and the Ethernet issue is gone now. I ran the patch for a couple of days and saw that line values are more stable but I'm getting daily resyncs as I did when i tried one of the 5.9 fritzbox firmwares without the error callback.
I tried to use an older blob 5.8 with the error callback but it does not sync at all. So currently I went back to the 5.8 and master as it gives me uptimes of multiple weeks.
One last thing i could try is extract the belgian blob from fritzbox as there might be a difference due to a firmware whitelisting that is applied by the isp..
Hm, that doesn't sound so good.
I'm using a BT HH5A, and the 5.9 fw range was never stable for me on this device.
So I intentionally didn't change the fw to test these patches. It's still 5.8.1.5.0.7 with sha256sum
a6b841aaa27f75d5709486c1fa52d1254399c478503be7c790271f7356642571 which I've been using for a long time now.
This doesn't look normal to me. If your line didn't start at such a high SNRM (the target SNRM is probably 6 dB), these drops would definitely cause interruptions. It is interesting that this only happens in downstream direction. This suggests that either vectoring still doesn't work properly, or there is some other issue (like strong external interference near your end of the line).
Could you check if n_processed actually increases at a constant rate over a longer time? For that, you would need to work around the Moiré effect in your graph somehow (maybe just plot the total value instead of packets/second for a quick check?).
Otherwise, a SNR spectrum (g997sansg 0 and g997sansg 1, or g997dsnrg 0 1 and g997dsnrg 1 1) from when the SNRM is high and when it is low could be helpful.